Viral infection and transmission in a large well-traced outbreak caused by the Delta SARS-CoV-2 variant
Baisheng Li1,2#, Aiping Deng1,2#, Kuibiao Li3#, Yao Hu1,2#, Zhencui Li1,2#, Qianling Xiong1,2,4, Zhe Liu1,2, Qianfang Guo1,2, Lirong Zou1,2, Huan Zhang1,2,Meng Zhang1,2, Fangzhu Ouyang1,2, Juan Su1,2, Wenzhe Su3, Jing Xu1,2, Huifang Lin1,2,4, Jing Sun1,2,4, Jingju Peng1,2,4, Huiming Jiang1,2,4, Pingping Zhou1,2,4, Huanying Zhen1,2, Jianpeng Xiao1,2,4, Tao Liu1,2,4, Rongfei Che1,2, Hanri Zeng1,2, Zhonghua Zheng1,2, Yushi Huang1,2, Jianxiang Yu1,2, Lina Yi1,2,4, Jie Wu1,2, Jingdiao Chen1,2, Haojie Zhong1,2, Xiaoling Deng1,2, Min Kang1,2, Oliver G. Pybus5, Matthew Hall6, Katrina A. Lythgoe6, Yan Li1,2*, Jun Yuan3*, Jianfeng He1,2*, Jing Lu1,2,4*
1Guangdong Provincial Center for Disease Control and Prevention, Guangzhou, Guangdong, China
2Guangdong Workstation for Emerging Infectious Disease Control and Prevention, Chinese Academy of Medical Sciences, Guangzhou, Guangdong, China
3Guangzhou Center for Disease Control and Prevention, Guangzhou, Guangdong, China
4Guangdong Provincial Institution of Public Health, Guangzhou, Guangdong, China
5Department of Zoology, University of Oxford, Oxford OX1 3SZ, UK
6Big Data Institute, Nuffield Department of Medicine, University of Oxford, Old Road Campus, Oxford OX3 7LF, UK
#Joint first authors.
- Corresponding authors: Yan Li, Jun Yuan, Jianfeng He, Jing Lu
Summary
We report the first local transmission of the Delta SARS-CoV-2 variant in mainland China. All 167 infections could be traced back to the first index case. The investigation on daily sequential PCR testing of the quarantined subjects indicated the viral load of the first positive test of Delta infections was ~1000 times higher than that of the 19A/19B strains infections back in the initial epidemic wave of 2020, suggesting the potential faster viral replication rate and more infectiousness of the Delta variant at the early stage of the infection. The 126 high-quality sequencing data and reliable epidemiological data indicated some minor intra-host single nucleotide variants (iSNVs) could be transmitted between hosts and finally fixed in the virus population during the outbreak. The minor iSNVs transmission between donor-recipient contribute at least 4 of 31 substitutions identified in the outbreak suggesting some iSNVs could quickly arise and reach fixation when the virus spread rapidly. Disease control measures, including the frequency of population testing, quarantine in pre-symptomatic phase and enhancing the genetic surveillance should be adjusted to account for the increasing prevalence of the Delta variant at global level.
During the global spread of SARS-CoV-2, the genetic variants of the viruses emerged, and some have been proved to be more transmissible or could escape from the host immunity, which posed an increased risk to global public health1–3. An emerging genetic lineage, B.1.617, has been dominant in the largest outbreak of COVID-19 in India since March 2021, gaining global attention. One sublineage, B.1.617.2, with spike protein mutations L452R, T478K and P681R, accounts for ~28% sequenced cases in Indian and rapidly replaced other lineages to become dominant in multiple regions and countries (https://outbreak.info/)4. The B.1.617.2 has been labeled as Variant of Concern (VOC), Delta (Tracking SARS-CoV-2 variants). The virological profile of this VOC is needed to be urgently illustrated.
On May 21, 2021 the first local infection of the Delta variant in mainland China was identified. Similar to what has been done to the early epidemic in January 20205, strict interventions including population screen testing, activate contact tracing, and central quarantine/isolation have been carried out. However, in contrast to the restricted transmissions in 20205, a successive intergenerational transmission has been observed in the 2021 epidemic. Here, we investigated the epidemiological, genetic, and serological data from this well-traced outbreak to characterize the virological profile of the Delta SARS-CoV-2 variant and discuss how the intervention strategies need to be improved on the racing against this emerging variant.
Results
The viral loads in the Delta infections were ~1000 times higher than those in the earlier 19A/19B strain infections on the day when viruses were firstly detected
From the first index case identified on May 21, 2021 to the last case reported on June 18, 2021, a total of 167 local infections were identified (Figure 1A). All these cases could be epidemiologically or genetically traced back to the first index case. One notable epidemiologic feature of the Delta variant is the shorter serial interval compared with the early Wuhan strains or other VOC variants6–8. However, critical parameters before the illness onset remain elusive, including when the viruses can be detected in a subject after exposure and how infectious they are. Here, we investigated the data from the quarantined subjects in this outbreak and compared it to the previous 2020 epidemic caused by 19A/19B genetic strains. The central quarantined subjects are the close contacts of the confirmed cases/asymptomatic infections. Once a new infection was identified, his/her close contacts were immediately traced, centrally isolated and daily PCR testing was performed. The dataset from quarantined subjects allowed us to determine the time interval between the exposure and reaching detectable viral load by PCR in the infected subjects. Considering the exact exposure time of the intra-family transmissions was difficult to pinpoint, we deducted the intra-family transmission pairs from our time interval analysis. Our results showed the time interval from the exposure to first PCR positive in the quarantined population (n=29) was 6.00 (IQR 5.00-8.00) days in the 2020 epidemic (peak at 5.61 days) and was 4.00 (IQR 3.00-5.00) days in the 2021 (n=34) epidemic (peak at 3.71 days) (Figure 1B). We next evaluate the relative viral loads when SAS-CoV-2 viruses were firstly detected in hosts. Compared to the 19A/19 B strains, the relative viral loads in the Delta variant infections (62 cases, Ct value 24.00 (IQR 19.00~29.00) for ORF1ab gene) were 1260 times higher than the 19A/19B strains infections (63 cases, Ct value 34.31 (IQR 31.00~36.00) for ORF1ab gene) on the day when viruses were first detected (Figure 1C). Considering the daily testing performed for the central isolated subjects since the beginning of quarantine, the higher within host growth rate of the Delta variant was proposed, which led to the higher viral loads on the time points when viral nucleotides excess the PCR detection threshold (Figure 1D). Similar to the study done by Roman et.al9., we found samples with Ct value above 30 (<6x10⁵ copies/mL viruses) never yield an infectious isolate in-vitro. For the Delta variant infections, 80.65% samples contained >6x10⁵ copies/mL in oropharyngeal swabs when viruses were firstly detected compared to the 19.05% samples in 19A/19B infections. These data highlight that the Delta variant could be more infectious during the early stage of the infection (Figure 1D).
As we know, individuals undergo a latent period after infection, during which viral titers are too low to be detected. As viral proliferation continues within host, the viral load will eventually reach detectable level and become infectious. Knowing when an infected person can spread viruses is essential for designing intervention strategies to break chains of transmission. However, this is difficult to study based on clinical investigations since over 50% of transmission occurred during the pre-symptomatic phase10. Our investigation on the quarantined subjects suggested for the Delta variant, the time window from the exposure to the detection of viruses was peaks at ~3.7 days and presented a higher infectiousness/transmission risk when the virus was first detected. In response to this notable viral parameter, the government required people leaving the Guangzhou city from airports, train stations and shuttle bus stations to show proof of a negative COVID-19 test within 72 hours on June 6 and further shorten into 48 hours on June 7, in contrast to the seven days in the 2020 epidemic.
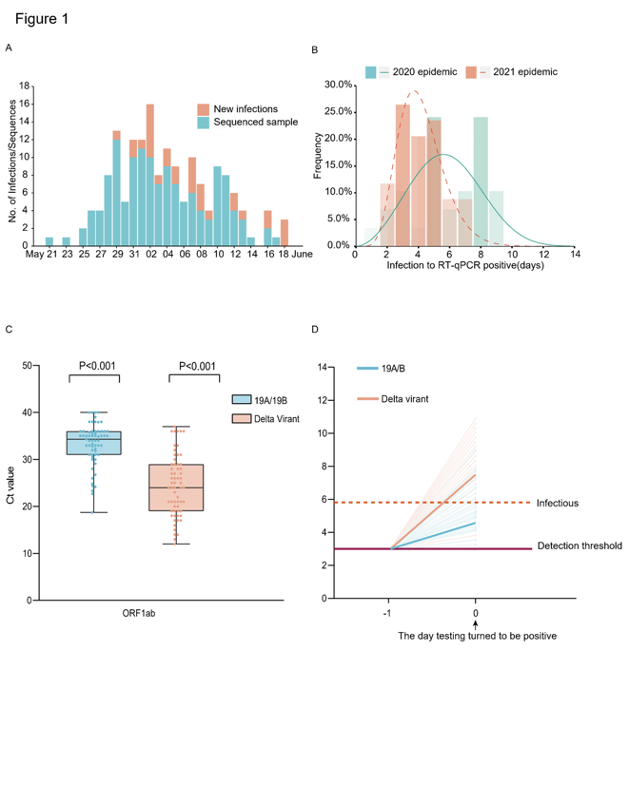
Figure 1: Summary of the epidemiology and early detection of the Delta SARS-CoV-2 variant in Guangdong. (A) Time series of 167 laboratory-confirmed infections originated from the first index case on May 21. Daily numbers of new infections shown in red and samples with high-quality sequences (coverage>95%) are shown in blue. (B) Estimate the time frame between the exposure to the first RT-PCR positive in quarantined subjects. The best-fitting distributions of the exposure to RT-qPCR positive interval for the infections caused by the Delta variant (n=34) and the 19A/19B strains (n=29). Lines represent the best-fitting distributions of the interval. Bars represent the cumulative number of the interval (days). (C) Ct values of the Delta variant infections (n=62) and previous 19A/19B strains infections (n=63) in quarantined subjects when screen test first turn to be positive. Dots represent Ct value distribution tested by RT-PCR in ORF1ab gene (left) and N gene(right). Box plots indicate the median and interquartile range (IQR); the whiskers represent the maximum and minimum values. (D) Schematic of the relation between the viral growth rate and the relative viral loads on the day viruses were first detected (Day 0). The viral load of 19A/19B strains and the Delta variant infections on Day 0 were calculated. The horizontal dashed line in purple represents the detection threshold of RT-PCR testing; the dashed line in red represents the lower limit above which infectious viruses could be potentially isolated.
Minor iSNVs transmitted between hosts and fixed in the virus population
The non-pharmaceutical interventions in Guangdong mainly focus on the epidemiological investigation, contact tracing and mass testing. Approximately 30 million PCR tests have been performed from May 26, 2021, to June 8, 2021. The intense testing and screening of high-risk population make cryptic transmissions unlikely and all identified infections could be directly (via direct contact) or indirectly (staying in or visiting the same area) connected. In addition, all sequences could be genetically traced back to the first index case. This provided an unique opportunity for us to characterize the viral transmission at a finer scale, particularly the extent of virus genetic diversity transmitted among hosts. Whole-genome deep sequencing was performed on all identified infections by using the Artic primer set with Illumina platform, and 126 high-quality viral genomes (coverage>95%) were obtained, covering 75% of all identified infections (Figure 1A).
Phylogenetic analysis performed by including 346 sequences of imported cases who travelled from 66 countries to Guangdong between March 2020 and June 2021. For reference sequences, 50 genomes sequences were randomly selected from each defined clades (13 clades) based on the nextstrain classification (https://nextstrain.org/) and notified VOC (Alpha, Beta, Gamma, Delta). The dynamic of viral lineage distribution in these imported cases roughly revealed the circulation of SARS-CoV-2 genetic lineages at the global level and also highlighted the challenges for diseases control and prevention in Guangdong, China (Figure 2A).
Viral phylogenies of the Guangzhou outbreak were constructed based on the consensus sequence of each sample, with branches indicating the number of mutations in the consensus sequence among samples and the x-axis indicated the total mutations from the reference sequence (Wuhan-Hu-1, MN908947). The consensus sequence for each sample was generated based on majority variance (>50%) on each position. All Guangzhou outbreak sequences segregated into a single cluster (Figure 2A). Compared with the first index case (XG5137_GZ_2021/5/21), 31 substitutions were identified from 126 cases during the 26-days outbreak (Figure 2B). The most distant sequence presented only four nucleotides’ difference from the index case sample. This suggests, during an outbreak, the relatively low substitution rate of SARS-CoV-2 presents challenges to infer transmission chains purely base on consensus sequences11–13. To infer the minor sequence variations along with the viral spreading, we estimated within-host virus diversity for each sample by mapping polymorphic sites onto the consensus genome of the index case (XG5137_GZ_2021/5/21) to generate a list of intra-host single-nucleotide variants (iSNVs). Minor iSNVs were called by setting 3% as the threshold of minor allele frequency to exclude the potential PCR and sequencing errors 12,14,15. There were sequences having minor intra-host single nucleotide variants (iSNVs) in 10 of 31 substituted positions which may shed lights on how variants have emerged, grew and finally fixed during the epidemic. We listed out sequences with these minor iSNVs and the sequences have the corresponding variants fixed (Figure 2B). The core question we would like to answer is that the accumulated genetic variations observed in the SARS-CoV-2 epidemic were dominant by de-novo mutations in an individual or the iSNVs transmission followed by the fixation in the new host. Contact tracing and epidemiological investigation enabled us to assign the epidemiological relation of these sequences with a high confidence. As shown in Figure 2C, at least some minor iSNVs could successfully transmitted from the donor to the recipient(s). The minor iSNVs C27086T could be transmitted from the index case to 2 of 3 recipients. With the spread of the viruses, this substitution was fixed in virus population in the outbreak (Figure 2B). The substitutions C925T, T21673C, and G27265T found in 6191, 5371 and 6486 cases could have the corresponding iSNVs been traced back to the possible donors (Figure 3C). However, we also noticed that some minor iSNVs including G11083T in samples 5851 and 5859, G21137A and T25082G in sample 5851 which could not be called out (threshold as 3%) due to low frequency but could be observed in the reads mapped to the reference genome (Figure S1). The high-density sampling and sequencing indicate the genetic variation generated during the epidemic was at least partly due to the iSNVs transmission between donor-recipient, although the successive iSNVs transmissions were not observed possibly due to the interventions on the virus transmission. More importantly, this transmission could be repeatedly observed when one donor had multiple recipients (Figure 2C, site 27086). In this circumstance, some transmission-enhancing or immune-escape SARS-CoV-2 iSNVs may be more likely to arise and reach fixation when the virus spread rapidly.
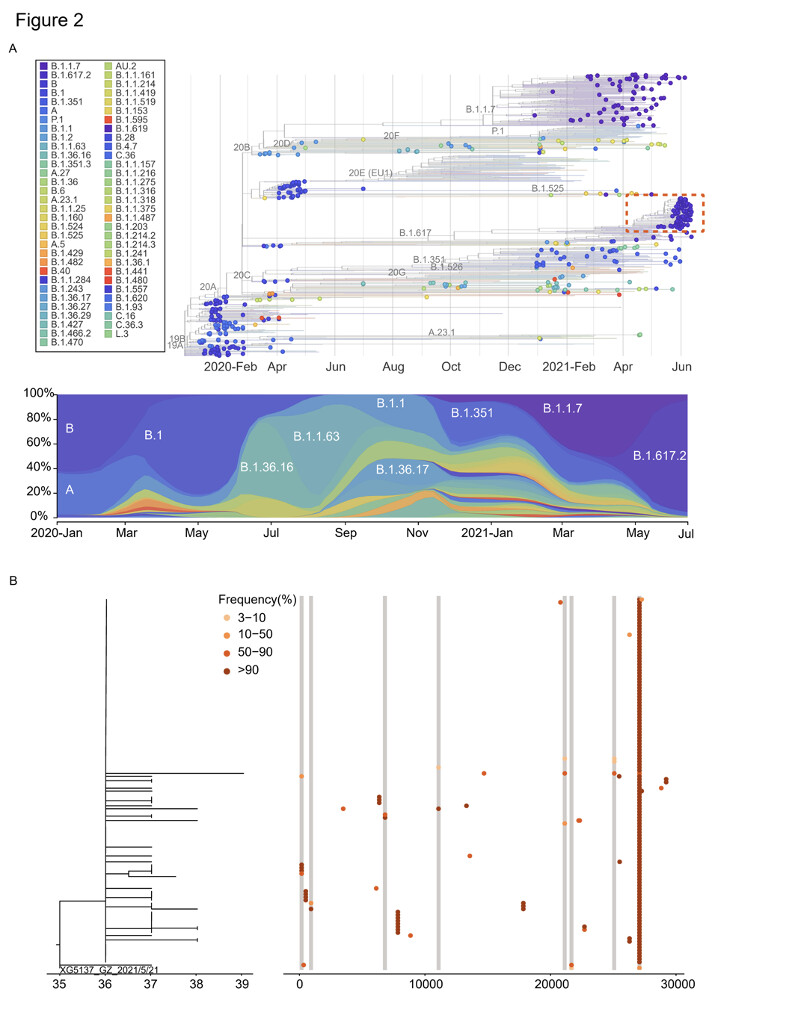
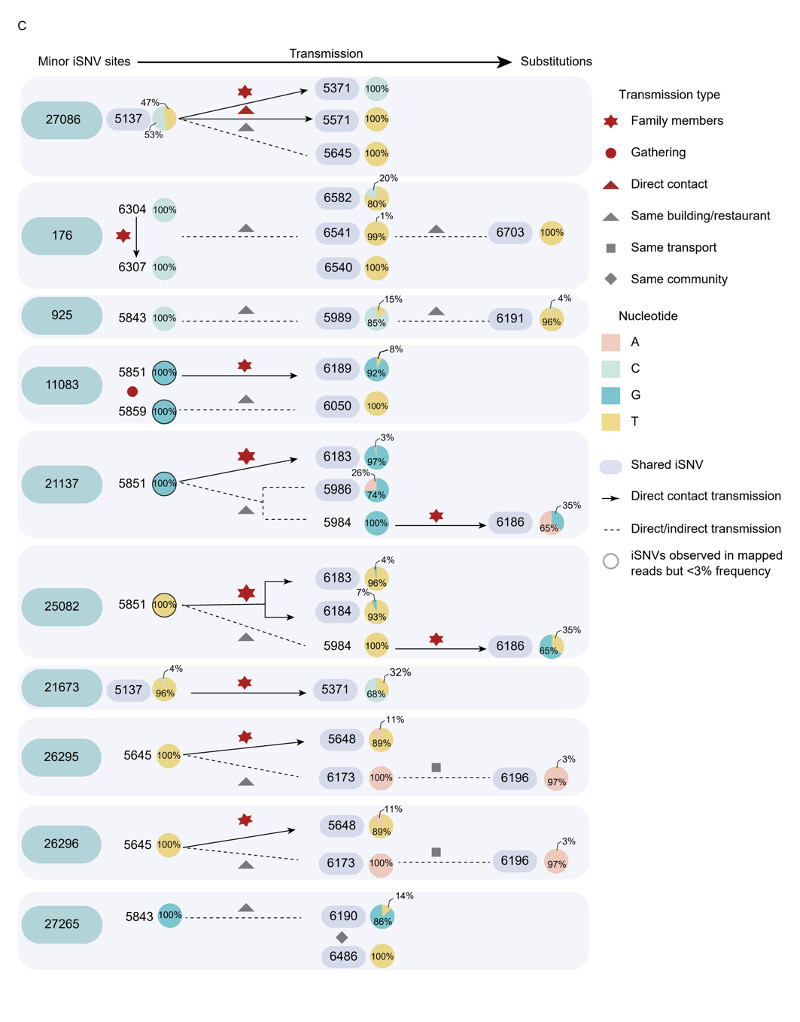
Figure 2: Viral phylogenies and transmission dynamics of the Guangzhou outbreak. (A)
The time resolved phylogenetic tree was constructed with the nextstrain pipeline by including randomly selected sequences from different genetic lineages, VOCs and Guangdong sequences collected from local infections and imported cases, January 2020 – June 2021. The sequences from the outbreak of the Delta variant between May 21,2021 – June 18, 2021 were highlighted with a red box. The dynamic of SARS-CoV-2 lineages identified in Guangdong was shown in the down panel (B) Maximum likelihood tree of 126 sampled sequences of the Guangzhou outbreak. The SNV frequency (%) was also marked with colored dots neighboring the tree. (C) Transmission relationship among sequences with the minor iSNVs in (B) and sequences having these variances fixed (alter frequency >50%). The pie chart represented the frequency of iSNVs. The arrow showed the direct contact transmission with high confidence. The dash line indicated both the direct or indirect transmission may occurred between two sampled sequences.
In this study, we characterize a large transmission chain originated from the first local infection of the SARS-CoV-2 Delta variant in mainland China. A potential higher viral replication rate of the Delta variant is proposed, which leads the viral loads in Delta infections to be ~1000 times higher than the 19A/19B strains infections on the day when the testing turns to be positive. This highlights more infectiousness of Delta variant during the early stage of infection is very likely, and the frequency of the population screening should be optimized for the intervention16. The more infectiousness of the Delta variant infections in pre-symptomatic phase highlights the need of timely quarantine for the suspicious infection cases or closely contacts before the clinical onset or the PCR screening. Although the intra-host SNVs are at a low level, the minor iSNV transmission is observed resulting a part of fixed substitutions in the virus population during the outbreak. These data indicate some advantage or neutral mutations even at a low frequency could potentially rise and be fixed in the one generation of transmission, and further reach predominant in virus population if the epidemic could not be well contained.
Acknowledgements
We gratefully acknowledge the efforts of China national CDC, Guangdong local CDCs, hospitals, and the third-party detection institutions in epidemiological investigations, sample collection, and detection. This work was supported by grants from Science and Technology Planning Project of Guangdong (2018B020207006), the Key Research and Development Program of Guangdong Province (2019B111103001), and Guangdong Workstation for Emerging infectious Disease Control and Prevention, Chinese Academy of Medical Sciences (2020-PT330-004).
Competing interests
The views expressed in this article are those of the authors and not necessarily those of the Guangdong Provincial Center for Diseases Control and Prevention, or the Guangdong Provincial Institute of Public Health.
Reference
- Faria, N. R. et al. Genomics and epidemiology of the P.1 SARS-CoV-2 lineage in Manaus, Brazil. Science (2021) doi:10.1126/science.abh2644.
- Davies, N. G. et al. Estimated transmissibility and impact of SARS-CoV-2 lineage B.1.1.7 in England. Science 372, (2021).
- Volz, E. et al. Assessing transmissibility of SARS-CoV-2 lineage B.1.1.7 in England. Nature 593, 266–269 (2021).
- Julia L. Mullen, Ginger Tsueng, Alaa Abdel Latif, Manar Alkuzweny, Marco Cano, Emily Haag, Jerry Zhou, Mark Zeller, Emory Hufbauer, Nate Matteson, Kristian G. Andersen, Chunlei Wu, Andrew I. Su, Karthik Gangavarapu, Laura D. Hughes, and the Center for Viral Systems Biology outbreak.info. outbreak.info. (2020).
- Lu, J. et al. Genomic Epidemiology of SARS-CoV-2 in Guangdong Province, China. Cell S0092867420304864 (2020) doi:10.1016/j.cell.2020.04.023.
- Vöhringer, H. S. et al. Genomic reconstruction of the SARS-CoV-2 epidemic across England from September 2020 to May 2021. http://medrxiv.org/lookup/doi/10.1101/2021.05.22.21257633 (2021) doi:10.1101/2021.05.22.21257633.
- Pung, R., Mak, T. M., CMMID COVID-19 working group, Kucharski, A. J. & Lee, V. J. Serial intervals observed in SARS-CoV-2 B.1.617.2 variant cases. http://medrxiv.org/lookup/doi/10.1101/2021.06.04.21258205 (2021) doi:10.1101/2021.06.04.21258205.
- Zhang, M. et al. Transmission Dynamics of an Outbreak of the COVID-19 Delta Variant B.1.617.2 — Guangdong Province, China, May–June 2021. China CDC Wkly. 3, 584–586 (2021).
- Wölfel, R. et al. Virological assessment of hospitalized patients with COVID-2019. Nature (2020) doi:10.1038/s41586-020-2196-x.
- Hu, S. et al. Infectivity, susceptibility, and risk factors associated with SARS-CoV-2 transmission under intensive contact tracing in Hunan, China. Nat. Commun. 12, 1–11 (2021).
- Sikkema, R. S. et al. COVID-19 in health-care workers in three hospitals in the south of the Netherlands: a cross-sectional study. Lancet Infect. Dis. 20, 1273–1280 (2020).
- Valesano, A. L. et al. Temporal dynamics of SARS-CoV-2 mutation accumulation within and across infected hosts. PLOS Pathog. 17, e1009499 (2021).
- Villabona-Arenas, C. J., Hanage, W. P. & Tully, D. C. Phylogenetic interpretation during outbreaks requires caution. Nat. Microbiol. 5, 876–877 (2020).
- Lythgoe, K. A. et al. SARS-CoV-2 within-host diversity and transmission. Science 372, eabg0821 (2021).
- Poon, L. L. M. et al. Quantifying influenza virus diversity and transmission in humans. Nat. Genet. 48, 195–200 (2016).
- Larremore, D. B. et al. Test sensitivity is secondary to frequency and turnaround time for COVID-19 screening. Sci. Adv. 7, eabd5393 (2021).
- Liu, T. et al. Risk factors associated with COVID-19 infection: a retrospective cohort study based on contacts tracing. Emerg. Microbes Infect. 9, 1546–1553 (2020).
- Chen, S., Zhou, Y., Chen, Y. & Gu, J. fastp: an ultra-fast all-in-one FASTQ preprocessor. Bioinformatics 34, i884–i890 (2018).
- Martin, M. Cutadapt removes adapter sequences from high-throughput sequencing reads. EMBnet.journal 17, 10–12 (2011).
- Itokawa, K., Sekizuka, T., Hashino, M., Tanaka, R. & Kuroda, M. Disentangling primer interactions improves SARS-CoV-2 genome sequencing by multiplex tiling PCR. PLOS ONE 15, e0239403 (2020).
- Li, H. & Durbin, R. Fast and accurate short read alignment with Burrows-Wheeler transform. Bioinforma. Oxf. Engl. 25, 1754–1760 (2009).
- Grubaugh, N. D. et al. An amplicon-based sequencing framework for accurately measuring intrahost virus diversity using PrimalSeq and iVar. Genome Biol. 20, 8 (2019).
- Hadfield, J. et al. Nextstrain: real-time tracking of pathogen evolution. Bioinformatics 34, 4121–4123 (2018).
- Guindon, S. et al. New algorithms and methods to estimate maximum-likelihood phylogenies: assessing the performance of PhyML 3.0. Syst. Biol. 59, 307–321 (2010).
- Yang, Z. Maximum likelihood phylogenetic estimation from DNA sequences with variable rates over sites: approximate methods. J. Mol. Evol. 39, 306–314 (1994).
- Yu, G., Smith, D. K., Zhu, H., Guan, Y. & Lam, T. T.-Y. ggtree: an r package for visualization and annotation of phylogenetic trees with their covariates and other associated data. Methods Ecol. Evol. 8, 28–36 (2017).
Methods
Ethics
This study was approved by the institutional ethics com¬mittee of the Guangdong Provincial Center for Disease Control and Prevention (GDCDC). Written consent was obtained from patients or their guardian(s) when samples were collected. Patients were informed about the surveillance before providing written consent, and data directly related to disease control were collected and anonymized for analysis.
Sample collection, clinical surveillance and epidemiological data
Since the first local SARS-CoV-2 infection reported on May 21 in the capital city of Guangdong, the enhanced surveillance was performed by Guangdong CDC and local CDCs to detect suspected infections. Epidemiological investigations had been done on all confirmed cases. Population screening were performed by third-party detection institutions. Once virus positive samples were confirmed by local CDCs or other institutions, the samples were required to send to Guangdong CDC immediately. To make the results comparable, in Guangdong CDC, the real-time reverse transcription PCR (RT-PCR) were performed by using the same commercial kit (DaAn Gene) and RT-PCR machine (CFX96) as the previous studies5,17. The exposure history for positive cases and their close contacts were obtained through an interview, public video monitoring systems and cell phone apps, etc. Information regarding the demographic and geographic distribution of SARS-CoV-2 cases can be found at the website of Health Commission of Guangdong Province (http://wsjkw.gd.gov.cn/xxgzbdfk/yqtb/). The surge population screening test ensure all possible infections were identified and the donor-recipient transmission pairs were assigned with high confidence.
Virus amplification and sequencing
Virus genomes were generated by two different approaches, (i) using commercial sequencing kit of BGI (ATOPlex 1000021625) and sequencing on the BGI MGISEQ-2000 (n=25), and (ii) using version 3 of the ARTIC COVID-19 multiplex PCR primers (Artic Network) for genome amplification, followed by library construction with Illumina Nextera XT DNA Library Preparation Kit and sequencing with PE150 (n=63) or SE100 (n=38) on Illumina Miniseq. We report only high-quality genome sequences for which we were able to generate >95% genome coverage.
Total RNAs were extracted from oropharyngeal swab samples by using QIAamp Viral RNA Mini Kit (Qiagen, Cat. No. 52904). The multiplex PCR amplification were performed by using the commercial kit of BGI or following the general method of multiplex PCR as described in (Artic Network). The bioinformatics pipeline for BGI platform (GitHub - MGI-tech-bioinformatics/SARS-CoV-2_Multi-PCR_v1.0: SARS-CoV-2 analysis pipeline for multiplex-PCR MPS(Massive Parrallel Sequencing) data) was used to generate consensus sequences and call single nucleotide variants relative to the reference sequence. For sequence data from Miniseq, the raw data were first quality controlled (QC) using fastp18 to trim artificial sequences (adapters), to cut low-quality bases (quality scores < 20). PCR primers were trimmed by using cutadapt version 3.119 or other published method20. The mapping of cleaned reads was performed against the genome of the first index case (5137_GZ_2021/5/21) using BWA 0.7.1721. The consensus sequences were determined with iVar 1.2.122, taking the most common base as the consensus (>50% frequency). An N was placed at positions along the reference with the sequencing depth fewer ≤ 10. We identified intrahost single nucleotide variants relative to the reference genome (5137_GZ_2021/5/21) with iVar 1.2.1 using the following parameters: alternated frequency at SNV site ≥ 3%; alternated depth at SNV site ≥ 30; iVar p-value of < 0.0001. The nextstrain pipeline23 was used to analyze and visualize the genetic distribution of SARS-CoV-2 infections and its dynamic changes in Guangdong between January 2020 and June 2021. Maximum likelihood (ML) tree was estimated with phyml24 using the HKY+Q4 substitution model with gamma-distributed rate variation25. The branch length was recalculated as the number of mutations to the reference sequence of the first index case. The tree was visualized with R package of ggtree26.
Data availability
All sequencing reads after primer trimming and mapped to the reference sequence (the sequence of the first index case, XG5137_GZ_2021/5/21) have been submitted to the National Genomics Data Center (https://bigd.big.ac.cn/) with submission number CRA004484. The generated consensus sequences were submitted with accession number GWHBDIM01000000 – GWHBDNH01000000.