Jonathan E. Pekar, Institute of Ecology and Evolution, University of Edinburgh, Edinburgh, UK
Thomas P. Peacock, The Pirbright Institute, Woking, UK, GU24 0NF; Department of Infectious Disease, Imperial College London, UK, W2 1PG
Louise Moncla, University of Pennsylvania, PA 19104, USA
Praneeth Gangavarapu, Department of Immunology and Microbiology, The Scripps Research Institute, La Jolla, CA, USA
Divya Venkatesh, Department of Biology, University of Oxford, Oxford OX1 3SY, UK
Daniel H. Goldhill, Department of Pathobiology and Population Sciences, Royal Veterinary College, London, UK.
Karthik Gangavarapu, Department of Immunology and Microbiology, The Scripps Research Institute, La Jolla, CA, USA
Moritz U. G. Kraemer, Department of Biology & Pandemic Sciences Institute, University of Oxford, Oxford, UK
Gytis Dudas, Institute of Biotechnology, Life Sciences Center, Vilnius University, Vilnius, Lithuania
Jeffrey B. Joy, British Columbia Centre for Excellence in HIV/AIDS; Bioinformatics, University of British Columbia; Department of Medicine, University of British Columbia, Vancouver, BC, Canada
Christopher Ruis, VPD Heart & Lung Research Institute, Department of Medicine, University of Cambridge, Cambridge, UK
Xiang Ji, Department of Mathematics, Tulane University, New Orleans, LA 70118, USA
Meera Chand, UK Health Security Agency, London UK
Natalie Groves, UK Health Security Agency, London UK
Oliver G. Pybus, (1) Department of Pathobiology and Population Sciences, Royal Veterinary College, London, UK (2) Department of Biology & Pandemic Sciences Institute, University of Oxford, Oxford, UK
Angela L. Rasmussen, Vaccine and Infectious Disease Organization, University of Saskatchewan, Saskatoon, SK, Canada S7N 5E3
Joel O. Wertheim, Department of Medicine, University of California San Diego, La Jolla, CA, 92093, USA
Marc A Suchard, Department of Biostatistics, University of California, Los Angeles, Los Angeles, CA 90095, USA
Andrew Rambaut, Institute of Ecology and Evolution, University of Edinburgh, Edinburgh, UK
Kristian G. Andersen, Department of Immunology and Microbiology, The Scripps Research Institute, La Jolla, CA, USA
Philippe Lemey, Department of Microbiology, Immunology and Transplantation, Rega Institute, KU Leuven, Leuven, Belgium
Michael Worobey, Department of Ecology and Evolutionary Biology, University of Arizona, Tucson, AZ 85705, USA
Abstract
On January 31st, 2025, the United States Department of Agriculture’s (USDA) National Veterinary Services Laboratories identified a new genotype of highly pathogenic avian influenza virus in dairy cattle in Churchill County, Nevada, the second known introduction of clade 2.3.4.4b H5N1 into cattle. Here, we estimate when this virus jumped from the avian reservoir into dairy cattle, using raw sequence reads from four D1.1 bovine H5N1 influenza cases. These data were shared by Animal and Plant Health Inspection Service/USDA on Friday, 7 February 2025. We also characterize mutations in the cattle D1.1 virus sequences and provide a list and brief discussion of mutations that may be of interest or concern. We find that the virus jumped from birds into cattle between late October 2024 and December or early January. Tentative approximations suggest the jump may have happened around the first week of December. This suggests that the origin of this cattle outbreak occurred more than a month before the first quarantines were imposed on two affected farms on January 24th, which had been instituted after the sampling of a local dairy processing plant’s milk silos (January 6th/7th), the testing of these samples (January 10th), and follow-up sample collection (January 17th) and highly pathogenic avian influenza (HPAI) testing (January 24th) at twelve individual farms supplying the silos. Since then, at least four additional infected herds in the area have been identified. Hence, while the discovery of this outbreak illustrates the impressive utility of the National Silo Monitoring Program in detecting outbreaks, our findings suggest that for this program to be most effective in outbreak control, immediate quarantine of all possibly-contributing herds to influenza virus-positive silos might be necessary. Considering the currently widespread nature of H5N1 in the United States, frequent on-site testing, including of individual herds, may be necessary for timely and maximally effective control measures for bovine H5N1 outbreaks.
Background
The second H5N1 influenza A virus (IAV) genotype detected in United States (US) cattle is a clade 2.3.4.4b, genotype D1.1 virus (IAV) that was discovered recently through the National Milk Testing Strategy’s (NMTS) testing program (1). Genotype D1.1 is a 4:4 reassortant that retained PB1, HA, MP, and NS segments from the Eurasian avian lineage and acquired PB2, PA, NP, and, most notably, N1 from low-pathogenicity avian influenza viruses (LPAIV) circulating in the Americas. The D1.1 genotype has become widespread in North American wild birds and is a major source of poultry outbreaks, along with severe zoonotic infections in Louisiana (2) and British Columbia (3). On January 6, 2025, the patient in Louisiana became the first US fatality from H5N1.
In early January 2025, HPAI was detected in bulk milk samples collected from dairy processing plant silos storing milk sourced from multiple local dairies in Churchill County, Nevada, as part of routine surveillance conducted by the National Silo Monitoring Program (NSMP) (4). This program, which screens milk from silos at dairy processing plants, is one part of the National Milk Testing Strategy (NMTS) (1). Nevada was one of the first states to participate in NSMP, which actively monitors for HPAI in bulk milk samples from dairy processing plant silos to fulfill the requirements of US Department of Agriculture’s (USDA) Federal Order issued on December 6, 2024. Figure 1 depicts the reported timeline of key events in the discovery and response to D1.1 H5N1 in cattle. Samples from three of eleven silos in Churchill County, Nevada, collected on the 6th and 7th of January 2025, tested positive for HPAI via polymerase chain reaction (PCR) at the National Veterinary Services Laboratories (NVSL) on January 10 (4). The finding was confirmed using whole genome sequencing after Nevada State officials conducted tracing and investigative work (5).
This detection triggered an investigation of 12 dairies in the area that may have contributed milk to the positive silos. On-farm bulk milk samples were collected from these farms on the 17th of January. NVSL confirmed the presence of HPAI in samples from two of the 12 dairies on the 24th of January. Whole genome sequencing completed on the 31st of January identified HPAI H5N1, clade 2.3.4.4b, genotype D1.1 in four bulk tanks from one herd/farm, with a partial D1.1 sequence being identified from a second herd/farm. Initially cattle reportedly showed no clinical signs, but mild clinical signs appeared later (6). Large wild bird die-offs were reported near the affected dairies (7), but we currently do not know exactly when these die-offs occurred, nor do we know whether any of the dead birds were collected for potential screening for IAV. On February 10, 2025, Nevada’s first zoonotic case of H5N1 was reported in a human who was exposed to infected dairy cattle (8).
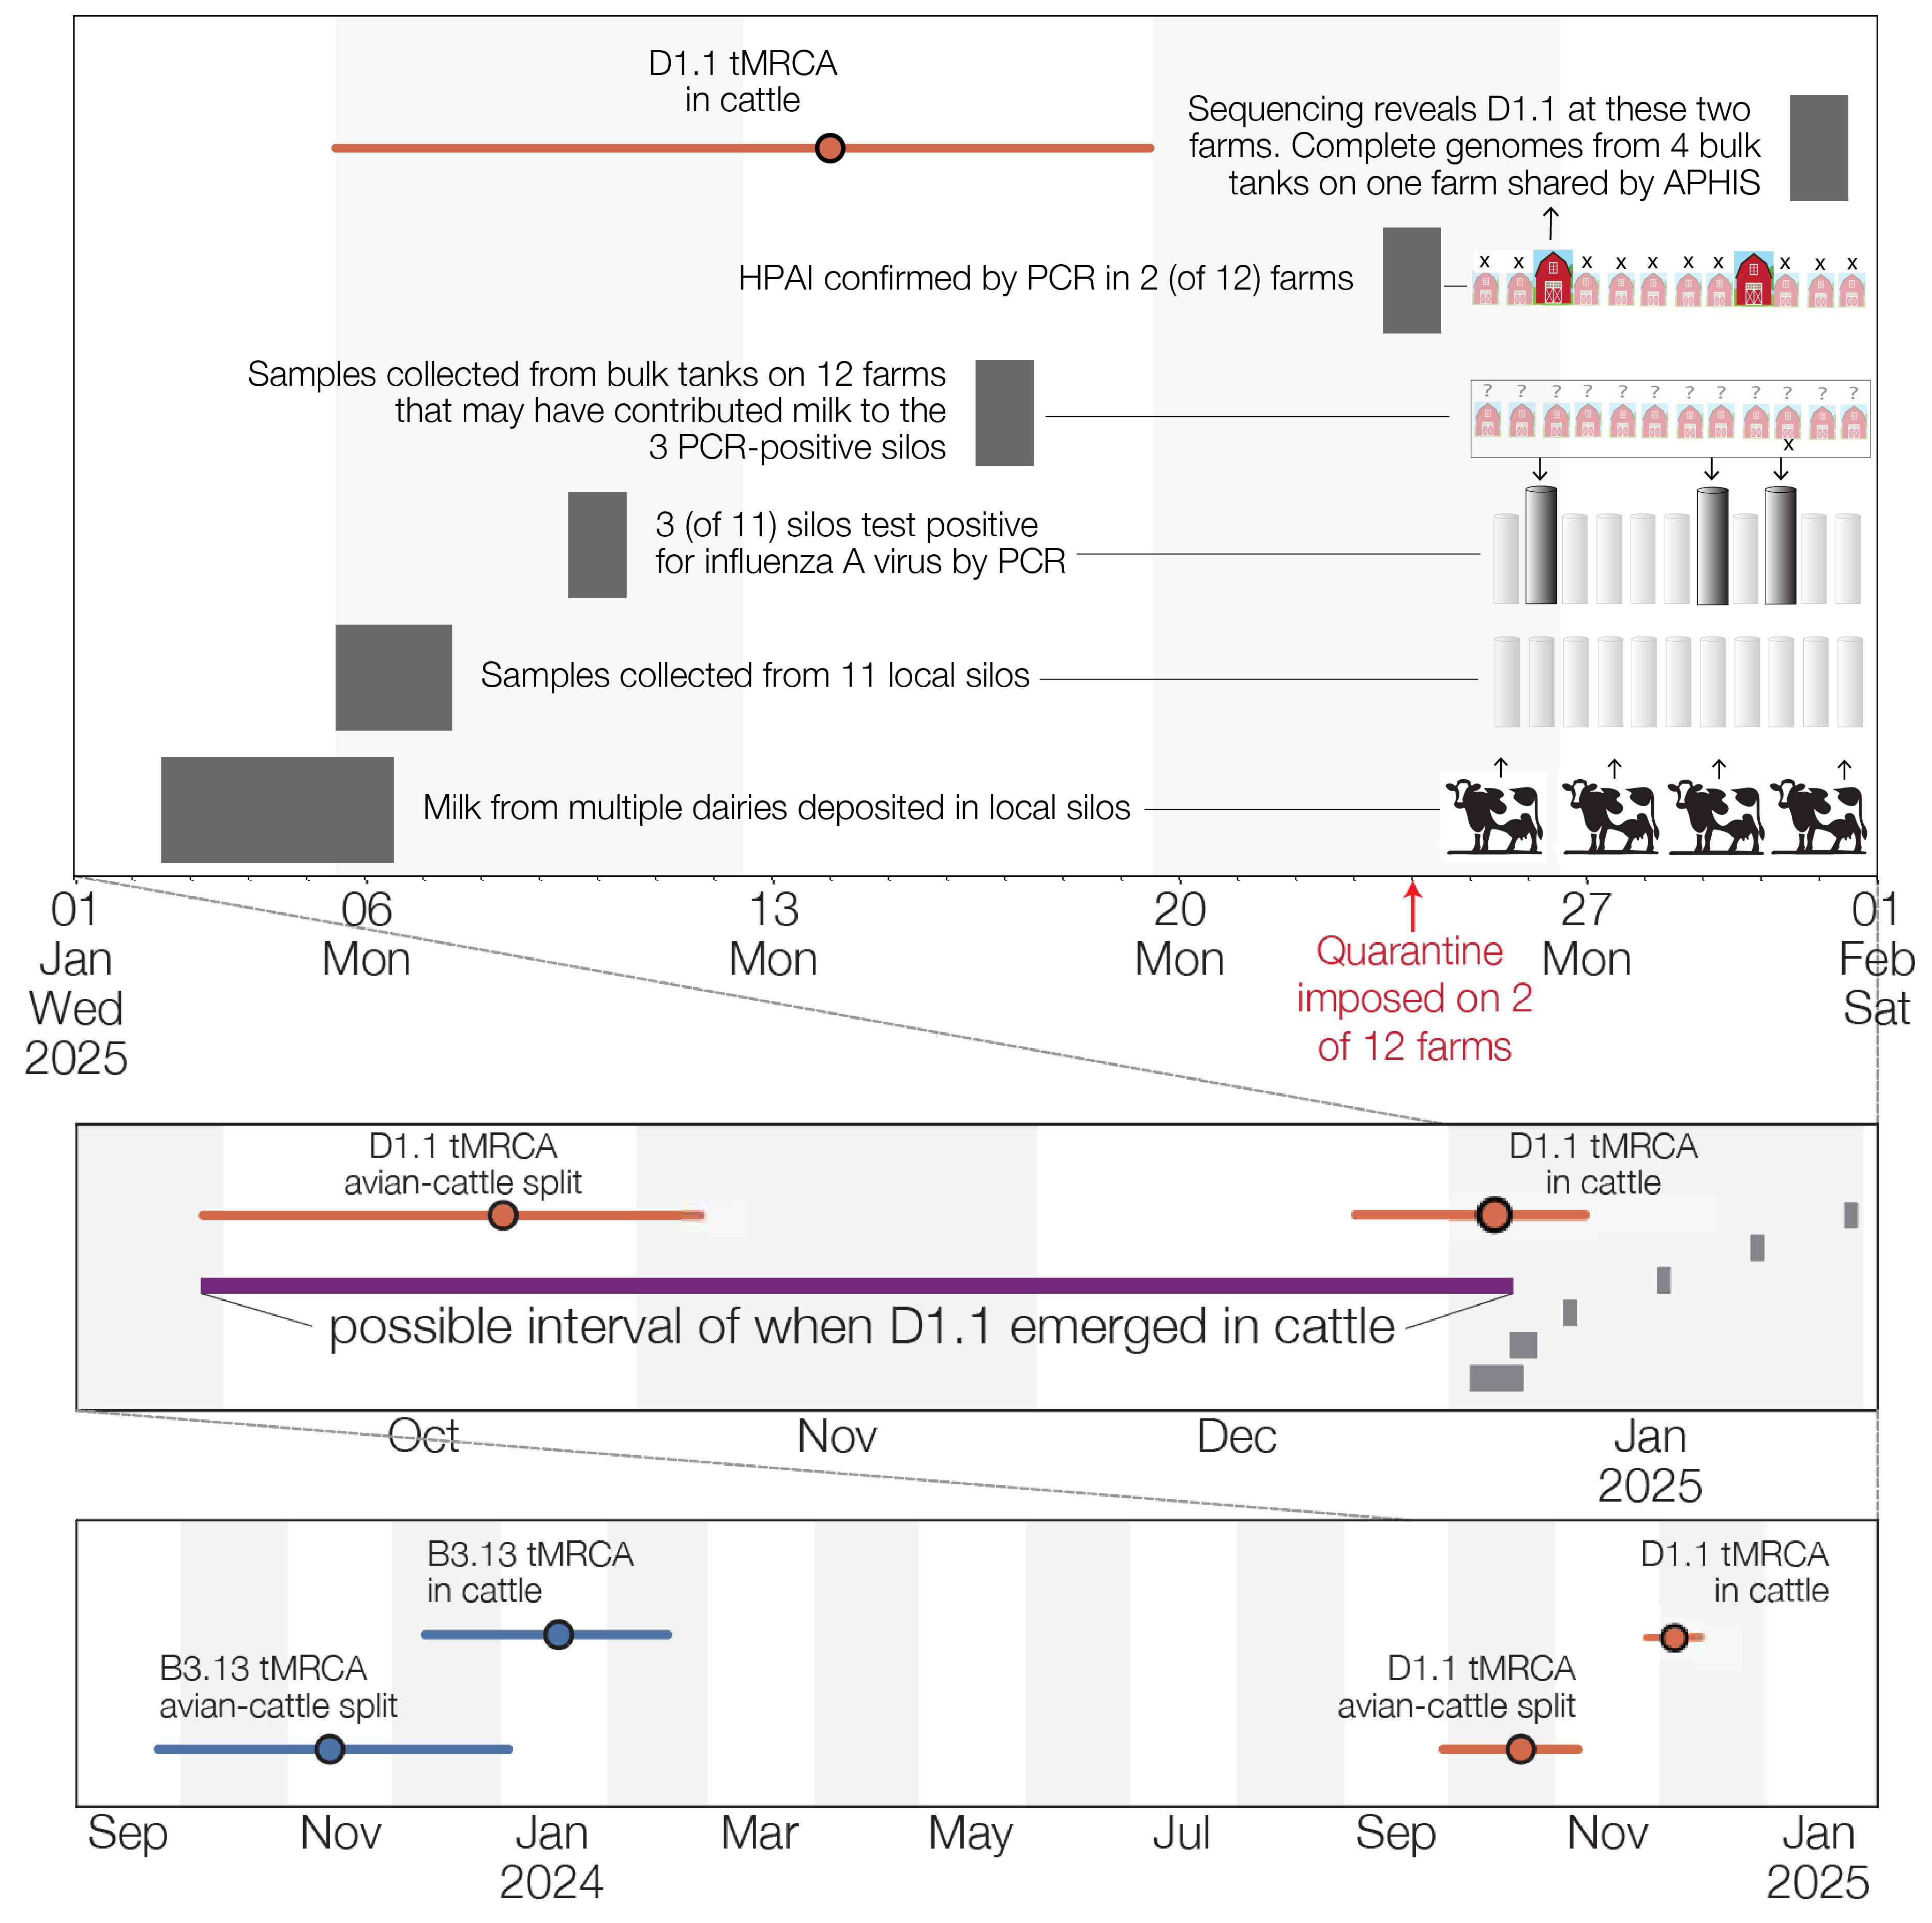
Figure 1 - Timeline of D1.1 emergence in cattle in Northern Nevada. Top plot shows the timing of key events in milk sampling/testing and epidemiological investigations into dairy farms in Churchill County. Because milk in silos can be stored for up to 72 hours (9), we assume that milk collected on the 6th and 7th of January may have been deposited as early as the 3rd of January. Middle plot condenses (at right) the events depicted in top plot and displays (at left) inferences from molecular clock analyses described below. The red intervals correspond to the 95% highest posterior density intervals (HPDs) of the inferred date of when the D1.1 lineage in cattle split from its closest relatives in birds and when the four cattle D1.1 sequences shared a common ancestor. These dates, along with the dates on which the PCR-positive milk samples were collected from silos, constrain the possible dates of D1.1 emergence in cattle. Bottom plot includes, for comparison, the corresponding intervals (in blue) that together constrain the date of B3.13 emergence in cattle that now circulates more widely in US cattle.
Dating the emergence of D1.1 in cattle
Methods
We assembled consensus genomes for all eight segments using data that had been released by Animal and Plant Health Inspection Service (APHIS) through the NCBI BioProject PRJNA1219588 on Friday, February 7th, 2025. We assembled the genomes using iVar v1.4.210 using A/cattle/Texas/24-008749-003/2024 as a reference. Minimum depth was set at 1, minimum quality at 20, and the consensus threshold at 50%. All assembled genomes along with metadata are available at GitHub - andersen-lab/avian-influenza: Consensus sequences for U.S. H5N1 clade 2.3.4.4b.
Figure 2 depicts the maximum likelihood phylogeny of all the D1.1 complete (concatenated) genomic sequences available to us at the time of writing, including the cattle D1.1 sequences (highlighted in purple), avian D1.1 sequences, and D1.1 sequences from non-cattle mammals. The eight genomic segments were concatenated in both this analysis and the root-to-tip and molecular analyses described below. The “stem” branch – between the most recent common ancestor (MRCA) of the cattle viruses and the MRCA of the cattle viruses and their closest relatives on the tree – is shown in purple. The two closest relatives are D1.1 sequences from a duck and a chicken in Idaho. (The stem branch to the cattle clade is sufficiently long that one cannot draw any conclusions about its geographical origin based on these avian sequences.)
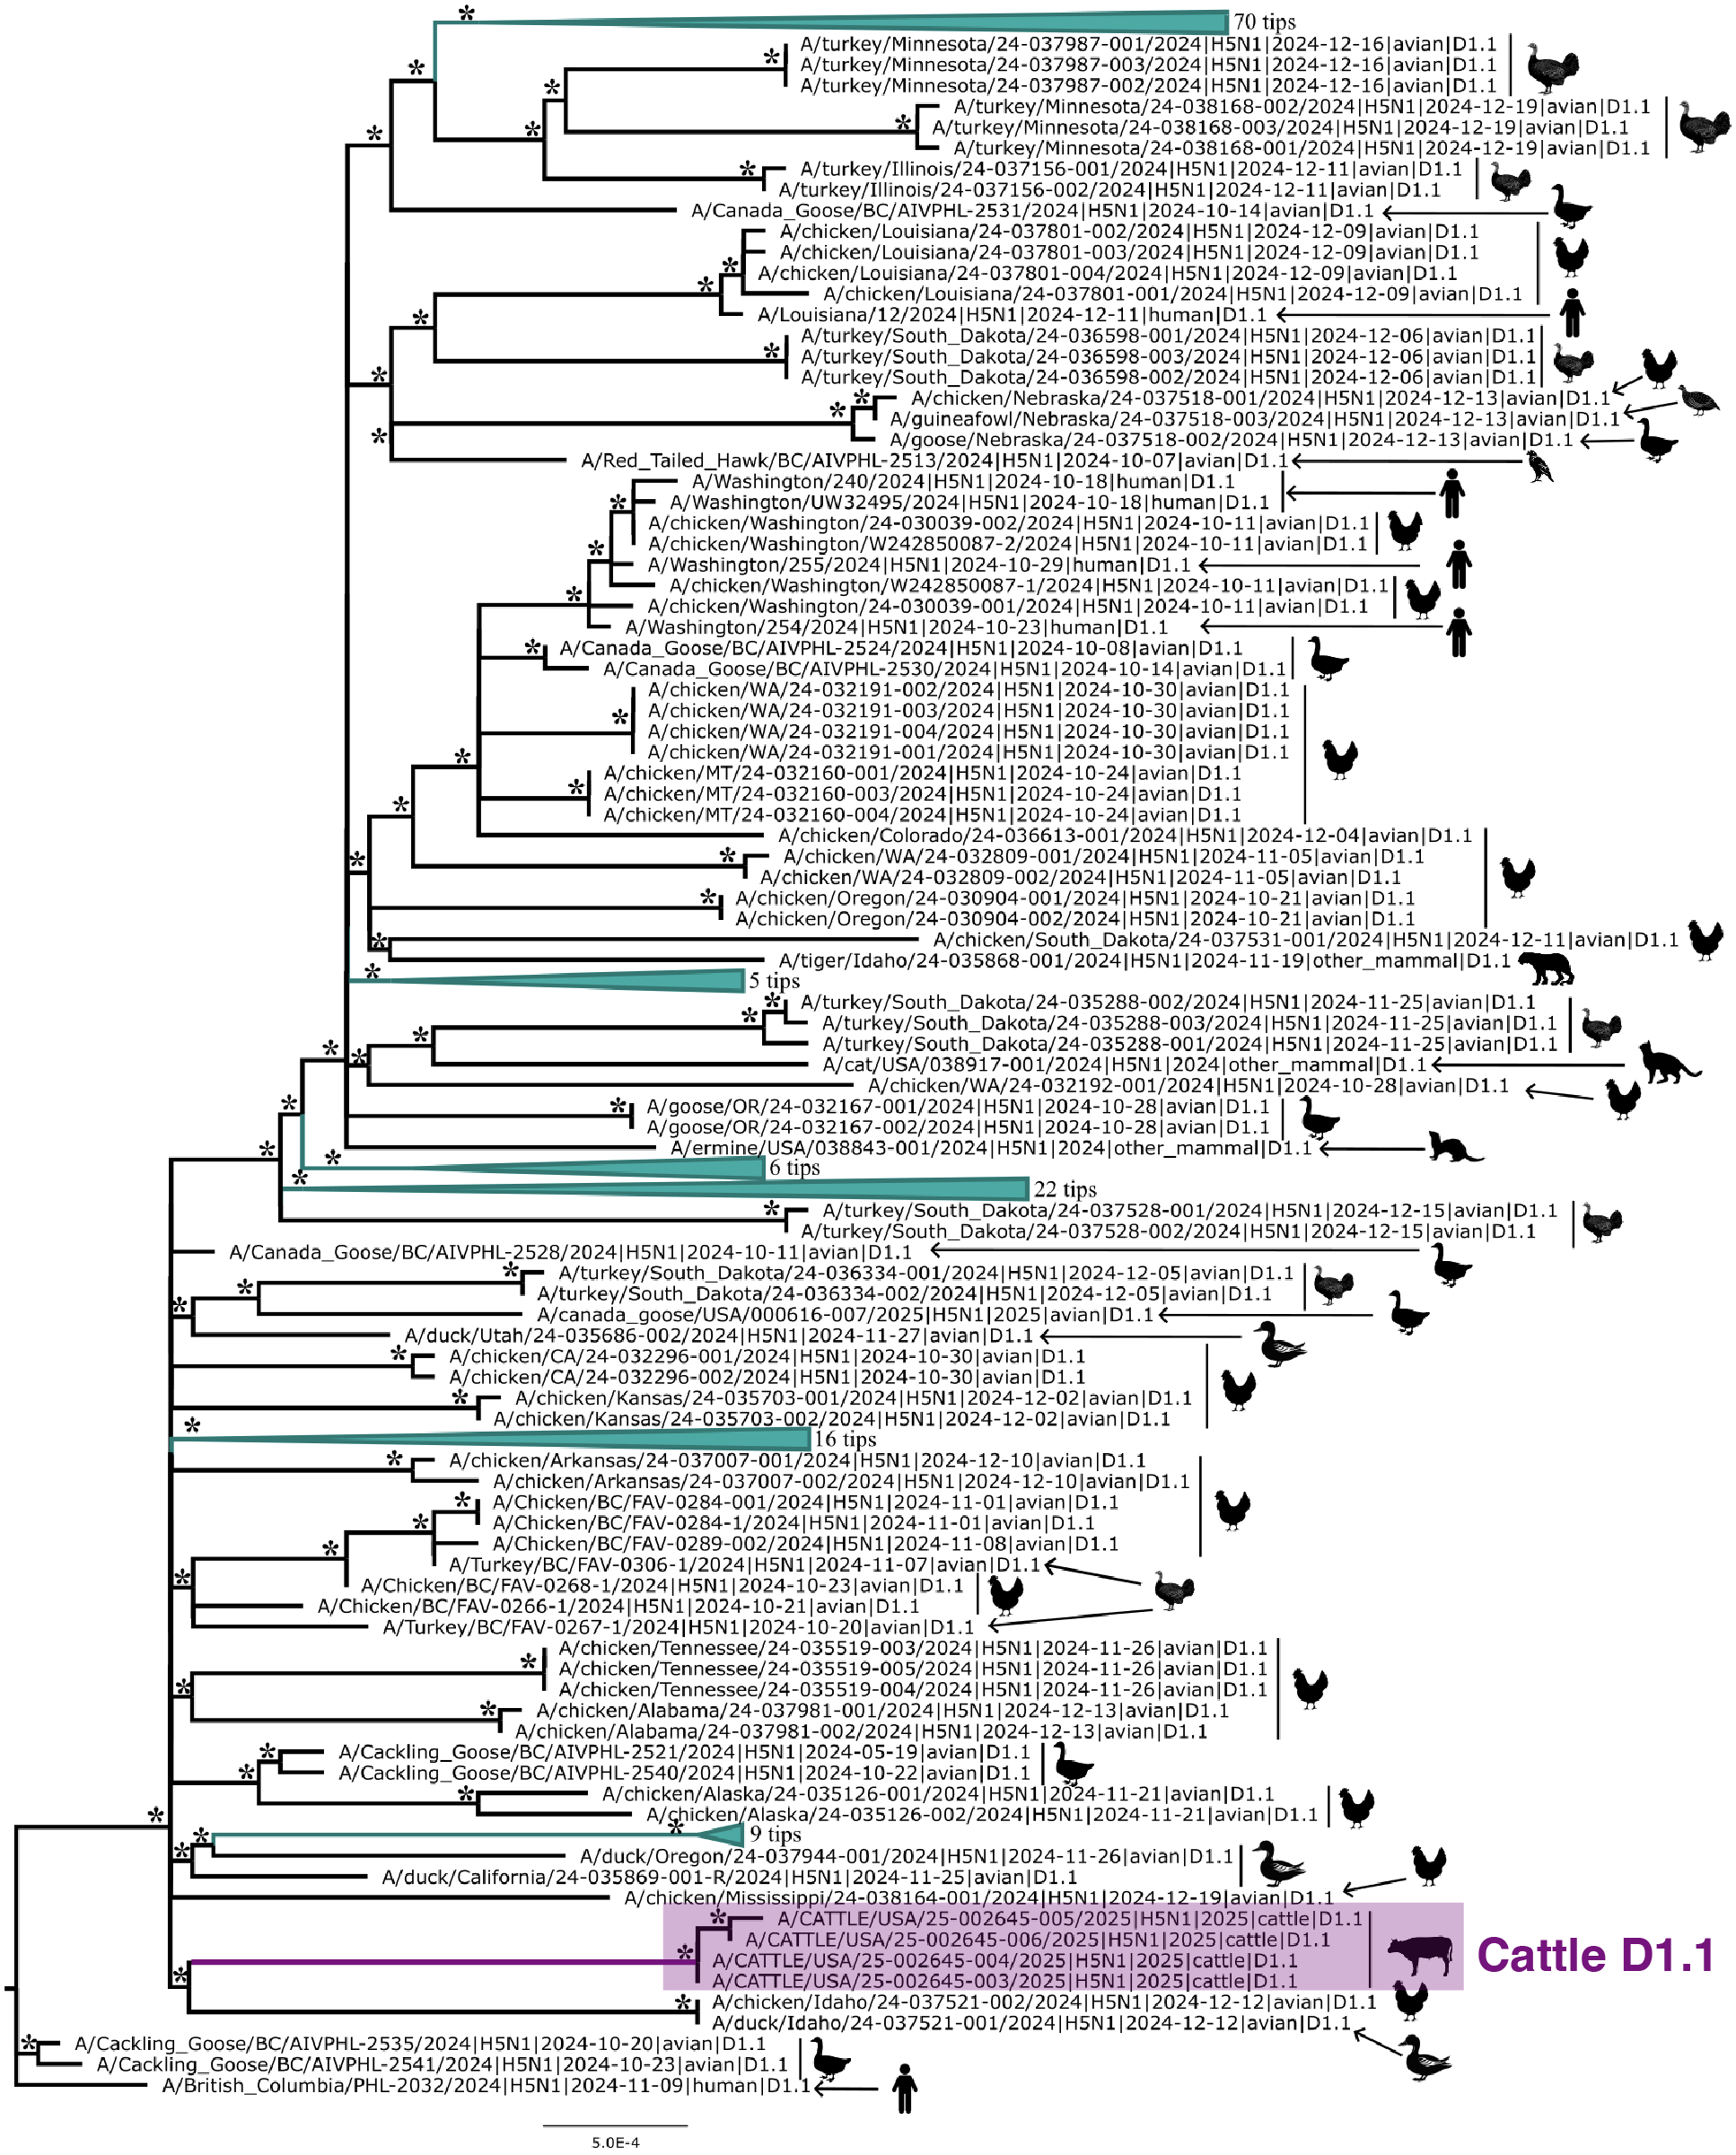
Figure 2 - Maximum likelihood (ML) phylogeny of 222 North American H5N1 D1.1 sequences. Asterisks denote nodes with ML bootstrap support greater than 80. Host taxa are depicted for each tip. To better visualize the context of human cases 6 clades of domestic birds, wild birds, and non-bovine mammals were collapsed. The cattle D1.1 clade is highlighted in purple.
The jump of H5N1 IAV from the avian reservoir to dairy cattle must have occurred at some date between the time of the most recent common ancestor (tMRCA) of the cattle D1.1 viruses and the tMRCA of the cattle viruses and their closest avian relatives (purple line in Figure 1 and purple branches in Figures 2-3).
An important consideration when using molecular clock methods to estimate these tMRCAs is that the evolutionary rate of IAV might not be the same in birds and cattle. Worobey et al. (11) showed rates can vary substantially across hosts and accommodating such rate differences is necessary for accurate estimates not only of tMRCAs but also of the topology of influenza A virus phylogenetic trees that encompass viruses from different animal host lineages. They used a host-specific local molecular clock model to account for these rate differences.
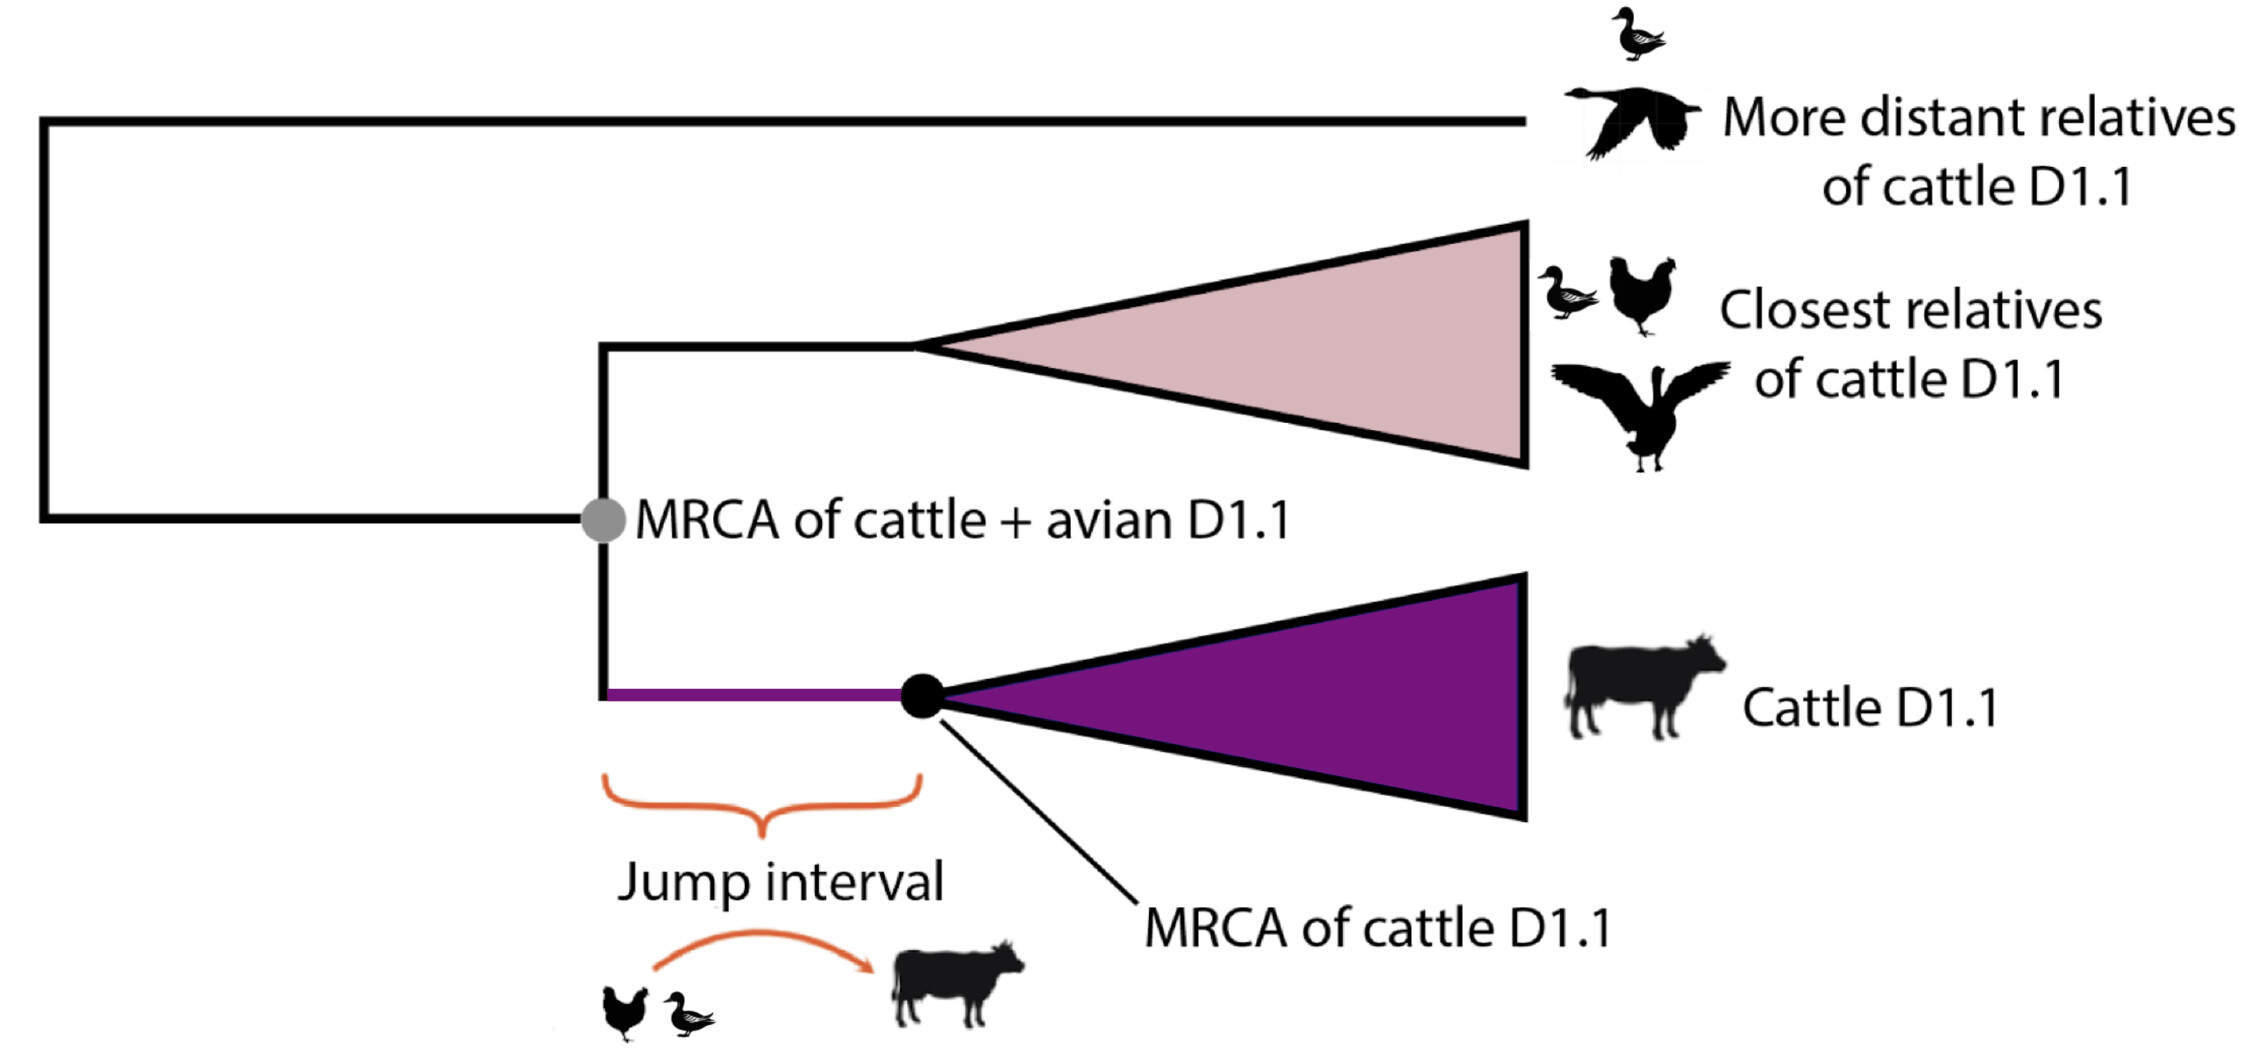
Figure 3 - Schematic representation of the evolutionary tree of cattle D1.1 IAV and its relatives circulating in birds. The most recent common ancestor (MRCA) of the four bovine D1.1 2.3.4.4b H5N1 viruses currently available for analysis is represented by the black dot. The MRCA of the cattle D1.1 viruses and their closest relatives in the avian reservoir is represented by the grey dot.
We therefore began by determining whether or not a local molecular clock approach is necessary for accurate dating of the jump of D1.1 into cattle, using concatenated complete genome sequences. While there were not enough bovine D1.1 sequences to calibrate the evolutionary rate of this lineage in cattle, we took advantage of the large number of bovine IAV sequences available from the B3.13 lineage, and used this to determine whether the D1.1 lineage as a whole (including avian and bovine D1.1) was evolving at a substantively different rate than that of the B3.13 genotype in cattle. It is important to note, however, that although we suspect that these two bovine IAV lineages may have similar evolutionary rates because they are close relatives within clade 2.3.4.4b, this remains an assumption and time may show that D1.1 and B3.13 evolve at different paces in dairy cattle.
We also explored the possibility that D1.1 may have experienced a burst of substitutions upon introduction into mammals, followed by a return to a typical evolutionary rate (see Figure 4). This hypothesis was explored by examining a regression of sequence sampling dates against phylogenetic divergence (a “root-to-tip” plot). D1.1 genomes from cattle fall slightly above the regression line (i.e., they contain more substitutions than expected given their sample collection date). However, the tree includes many poorly sampled sub-lineages often separated by tens of substitutions, making the analysis inherently noisy, and cattle D1.1 sequences do not fall any higher above the regression line than some sequences from birds. An additional complication is that some of the avian D1.1 genomes which are analyzed as a concatenated genome may be reassortants (i.e. effectively recombinants in the concatenated genomes), introducing repeat mutations (homoplasies) into the strictly clonal phylogenetic tree model, possibly resulting in inflated evolutionary rate estimates.
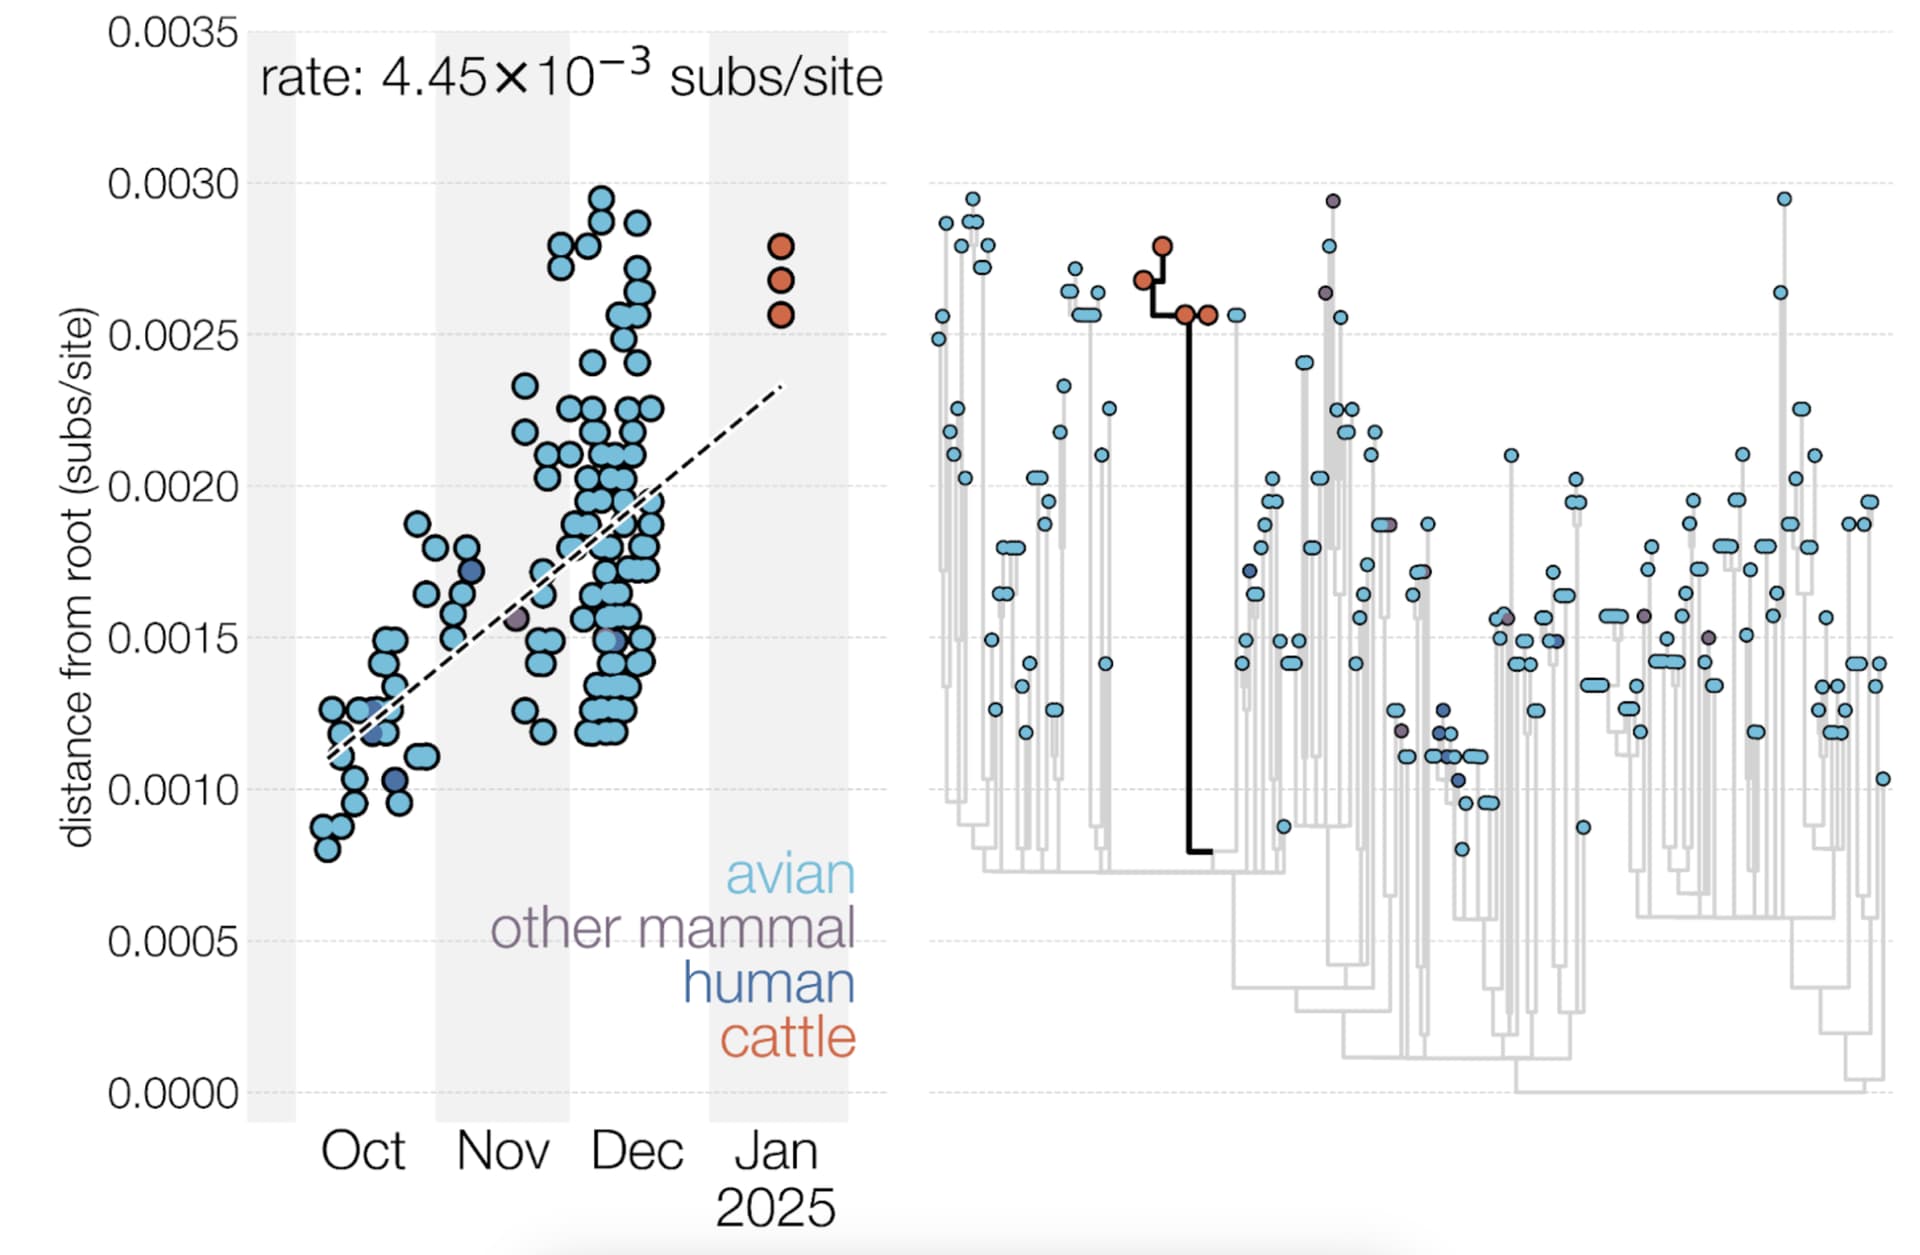
Figure 4 - Root-to-tip plot and maximum likelihood phylogeny of D1.1 genomes. The midpoint-rooted maximum likelihood phylogeny (right) includes all 222 D1.1 genomes. The root-to-tip plot (left) includes only genomes with complete sampling dates and the four cattle virus genomes, which were evidently sampled on 17 January 202512.
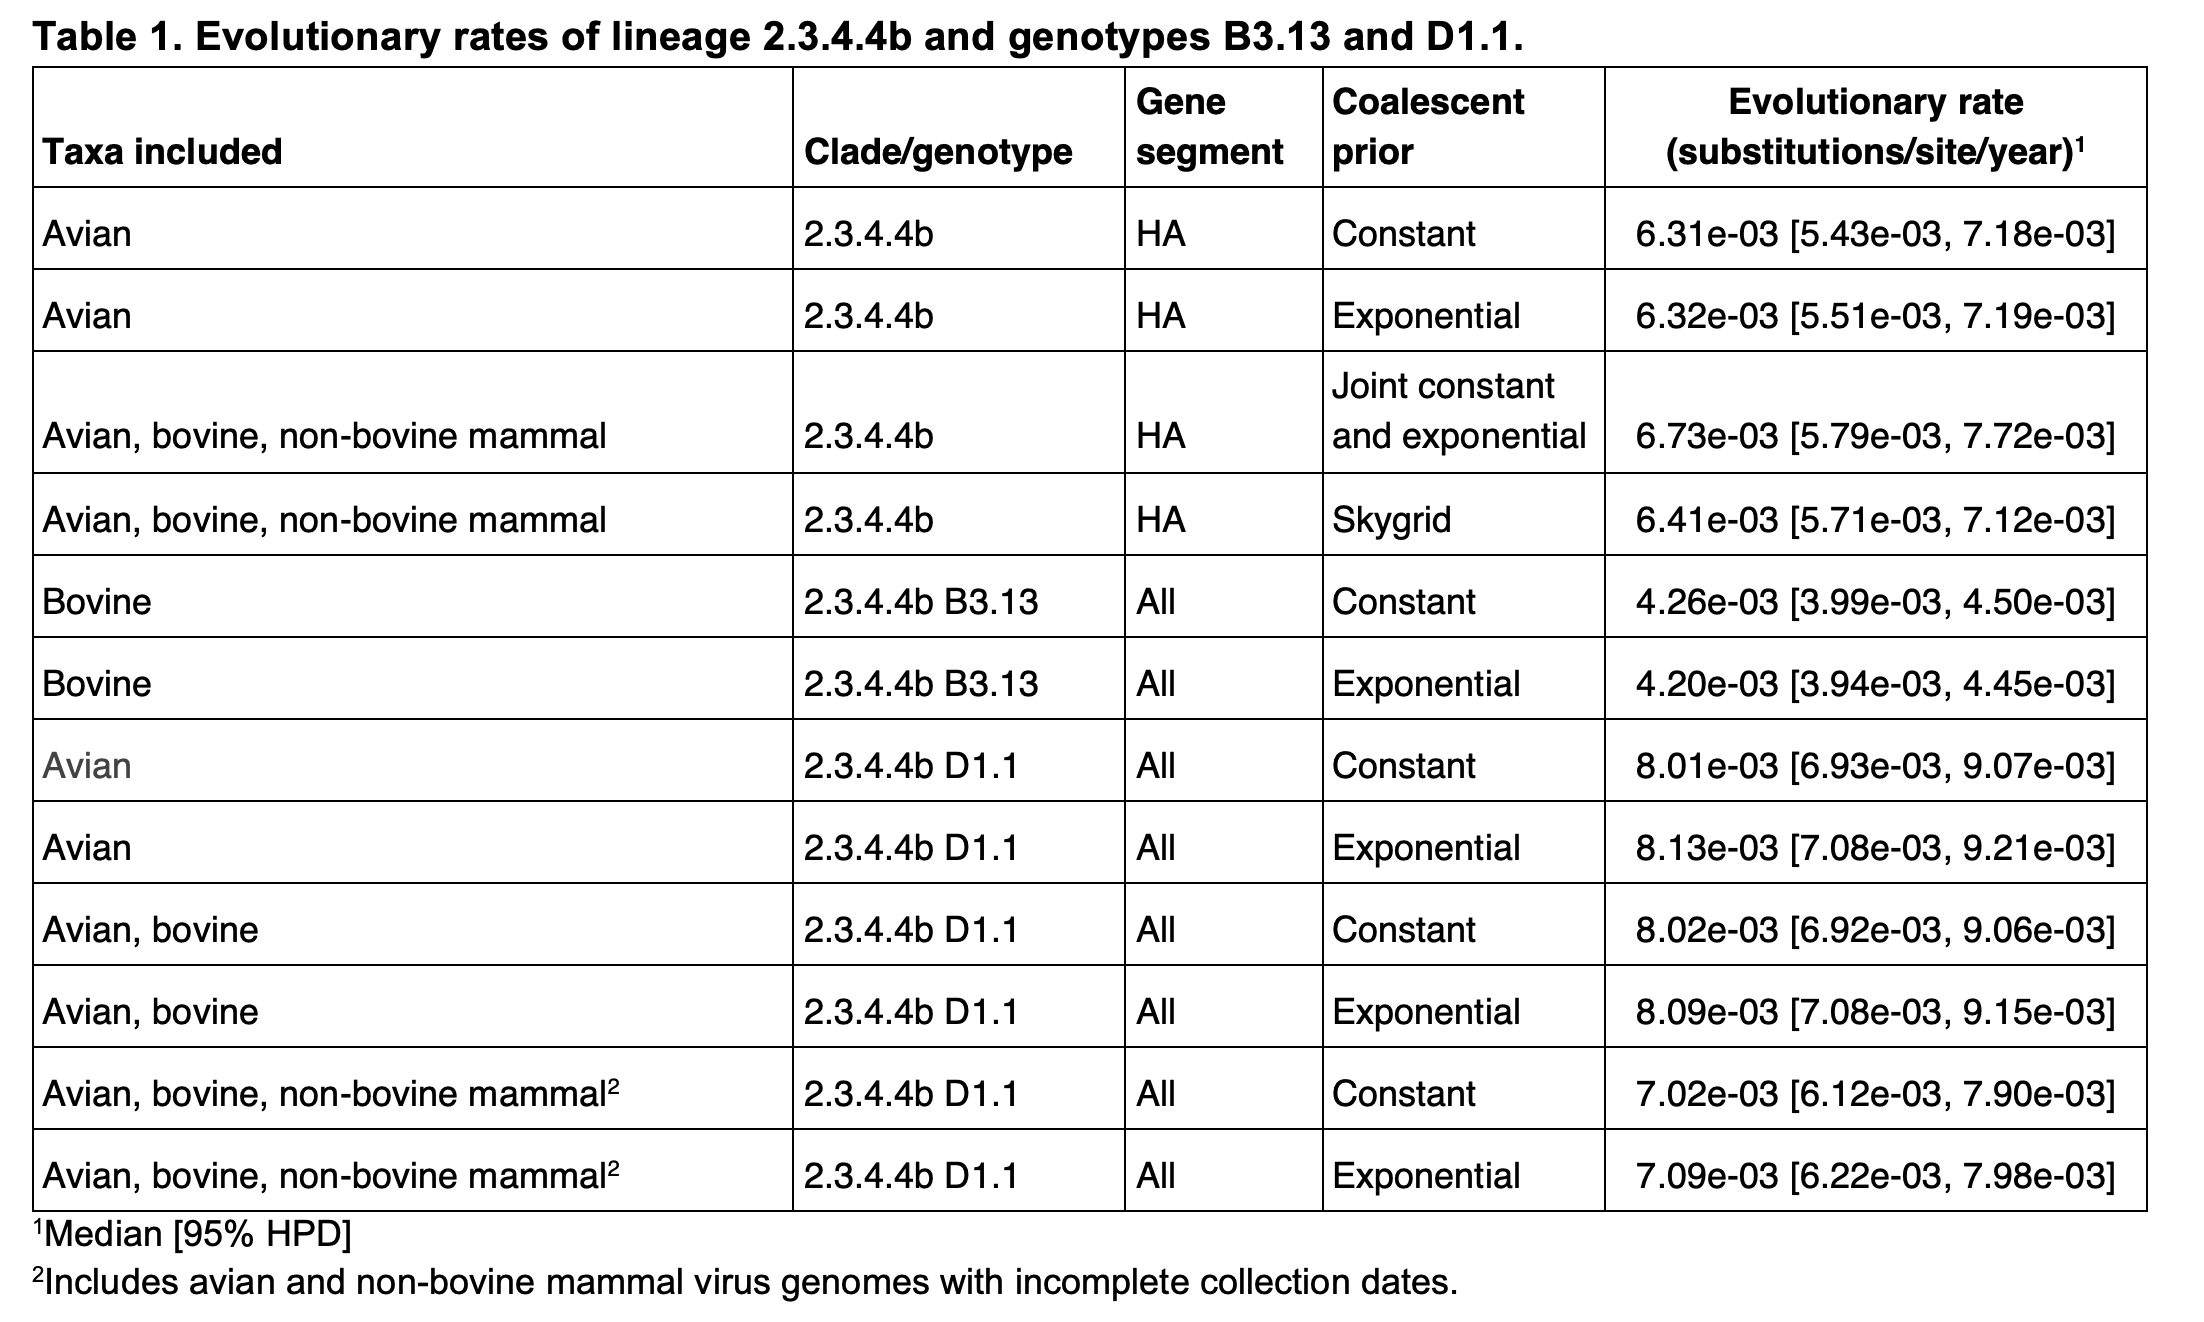
We previously estimated the evolutionary rate of 2.3.4.4b viruses, including those from the B3.13 lineage, sampled from avian, bovine, and non-bovine animals (13). To estimate the 2.3.4.4b clock rate without either B3.13 or D1.1 viruses, we performed phylogenetic inference on 554 2.3.4.4b HA genomes with complete collection dates sampled in birds in 2023 and 2024. Rates were inferred using the Bayesian MCMC approach implemented in BEAST v1.1014, under a strict molecular clock model, an HKY substitution model, and a constant population size coalescent prior. We ran one MCMC chain of 100 million generations, sub-sampling every thousand states to parameter log files and every 10,000 states for the tree file; the first 10% of the MCMC chains were discarded as burn-in. Convergence and mixing were assessed in Tracer v1.7.1; all relevant effective sample size (ESS) values were >150. We repeated this analysis using an exponential population size prior.
To estimate B3.13 rate in cattle, we performed phylogenetic inference on 1,350 concatenated complete B3.13 viral genomes sampled from cattle. We used the same approach as above, with both an exponential population size prior and coalescent prior. To estimate the evolutionary rate of D1.1 viruses circulating among birds, we used 187 D1.1 viruses that had complete collection dates (to a specific day); these were sampled from birds from October through December of 2024. We again employed a strict molecular clock model, an HKY substitution model, and a constant population size coalescent prior, and the approach described above. We additionally performed an analysis using an exponential population size prior.
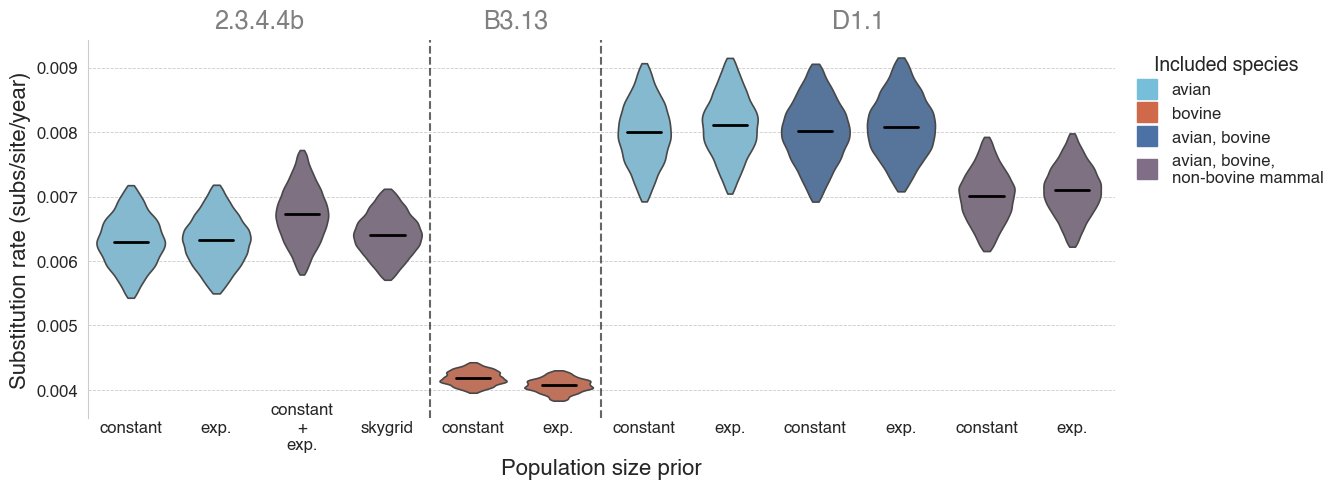
Figure 5 - Substitution rates of lineage 2.3.4.4b and its sublineages. Violins represent 95% highest posterior density (HPD) of the substitution rate, with black lines representing the median rate. Lineages are separated by dashed lines and indicated by grey text at the top. Violins are colored by the species from which the analyzed genomes were sampled. Refer to Table 1 for numerical values. A B3.13 “avian only” analysis is not possible because there are not enough B3.13 sequences available from birds (almost all B3.13 sequences are from cattle).
We next performed phylogenetic inference using these 187 viruses together with the four viruses sampled from Nevada dairy cattle. While specific sampling dates have not yet been released for these four viruses, a report from APHIS suggests they were sampled on January 17th, 2025. The remaining parameterizations were identical to those described above, and we again performed two analyses, one with a constant population size prior and another with an exponential population size prior.
We then inferred phylogenies using all available D1.1 viruses, which resulted in an additional 31 viruses sampled from both birds and mammals in 2024 and 2025, a subset of which lacked complete collection dates. For the viruses that were sampled in 2024 but do not have complete collection dates, we sampled uniformly from a 3-month window, representing the last 3 months of 2024, as D1.1 was first detected in October 2024. For the non-bovine viruses that were sampled in 2025 but do not have complete collection dates, we sampled uniformly from a 5-week window, starting from 1 January 2025. The remainder of the parameterizations were the same as those described above.
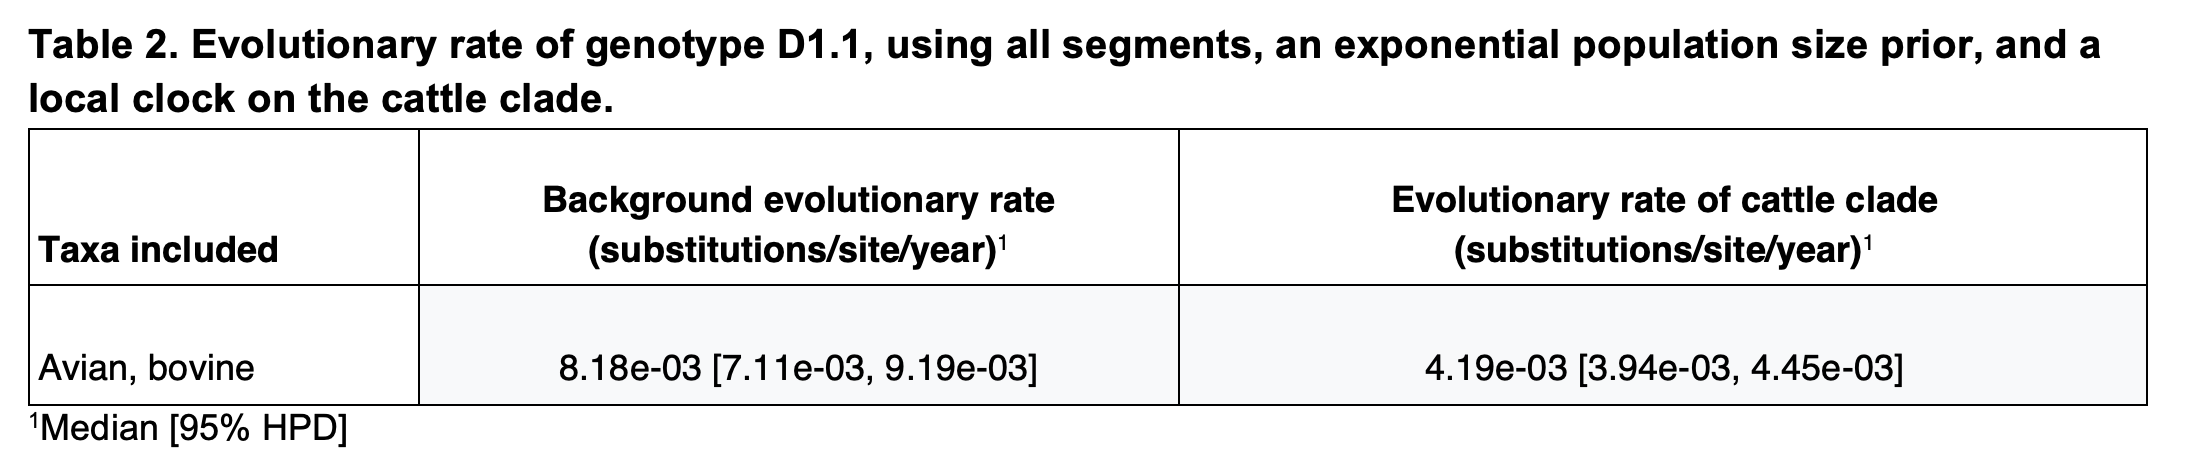
Next, as Worobey et al. (11) demonstrated, in a study of the deep evolutionary history of all influenza A viruses, there could be rate differences across hosts, we again performed phylogenetic inference on the 187 avian D1.1 viruses with complete sampling dates with the four bovine D1.1 viruses, except using a local clock on the cattle clade. We specified a fixed local clock that allows for a different rate on the cattle clade, with a normal prior based on the inferred evolutionary rate of the B3.13 lineage in cattle from the B3.13 analysis that used an exponential population size prior. For the rest of the tree, minus the branch leading to the cattle clade, we assumed a background evolutionary rate that would represent the evolution of D1.1 in birds. We then modelled, as an estimable parameter, the assignment of the stem branch to either the avian or the cattle rate, using Bayesian search variable selection. As the molecular clock and tMRCA inferences were consistent when using a constant or exponential population size coalescent prior (Tables 1 and 3), here we only performed an analysis using an exponential population size prior.
We used the results of the analysis that used a fixed local clock and the Bayesian search variable selection to perform a rough estimate of when D1.1 spilled over from birds to cattle along the cattle clade stem branch. We assumed that the probability of the stem branch being assigned the avian evolutionary rate was roughly equivalent to the proportion of substitutions along that branch that would have occurred in avian hosts. Similarly, we assumed the probability of the stem branch being assigned the cattle rate corresponds to the proportion of substitutions that would have occurred in cattle hosts. We make this assumption to provide a reasonable approximation of the spillover date. The number of substitutions in each host can be estimated as the product of the evolutionary rate of the D1.1 lineage in that host and the time spent in that host. Using the avian and cattle D1.1 evolutionary rates, the probabilities of each rate assignment, and the total stem branch length, we solved for the time spent in birds and cattle, which allowed us to estimate the spillover date. This approximation was performed using median evolutionary rates, the tMRCA of the cattle clade, and the tMRCA of the cattle clade and its most closely related avian viruses.
Results
We found that the evolutionary rates of 2.3.4.4b were similar when focusing on only avian viruses and when including a small number of mammal viruses (Table 1, Figure 5). However, our estimate of the B3.13 cattle-only substitution rate was substantially lower, consistent with host-dependent substitution rates. As most B3.13 virus genomes are isolated from cattle, we are unable to estimate the rate of B3.13 evolution in birds alone; however, we assume similar host-specific differences among closely related viral lineages. We found that the avian D1.1 lineage appeared to evolve faster than B3.13 in cattle or 2.3.4.4 more broadly. The inclusion of D1.1 cattle viruses in the inference of evolutionary rate did not have a substantive effect on the estimation, but this could be due to there only being four D1.1 virus genomes from cattle; we therefore could not estimate the rate of D1.1 evolution in cattle alone. However, the inference of the D1.1 evolutionary rate when including both bovine and non-bovine mammal viruses did appear to result in a slight decrease of the rate, suggesting that the virus could be evolving more slowly in mammals. The evolutionary rates were consistent when using either a constant or exponential population size prior. These results are consistent with the findings in the 2.3.4.4b B3.2 outbreak in elephant seals in Argentina, where the viral evolutionary rate in mammals was estimated to be 2-fold lower than in the avian viruses (15).
We first analyzed D1.1 viruses sampled from birds and cattle using an exponential population size coalescent prior and a single molecular clock, and estimated the tMRCA of the cattle D1.1 clade to be 9 January 2025 (95% highest posterior density [HPD]: 2 January 2025 – 15 January 2025) and that of the cattle and closest avian D1.1 viruses to be 21 October 2025 (95% HPD: 29 September 2025 – 7 November 2025). Expanding this dataset to include D1.1 viruses sampled from non-bovine mammals and without complete collection dates resulted in a similar tMRCA of the cattle clade, but a slightly earlier tMRCA of the cattle clade and the closest avian D1.1 viruses (Table 3; Figure 6A). Like the evolutionary rates (Table 1), the tMRCAs were consistent when using either a constant or exponential population size prior (Table 3).
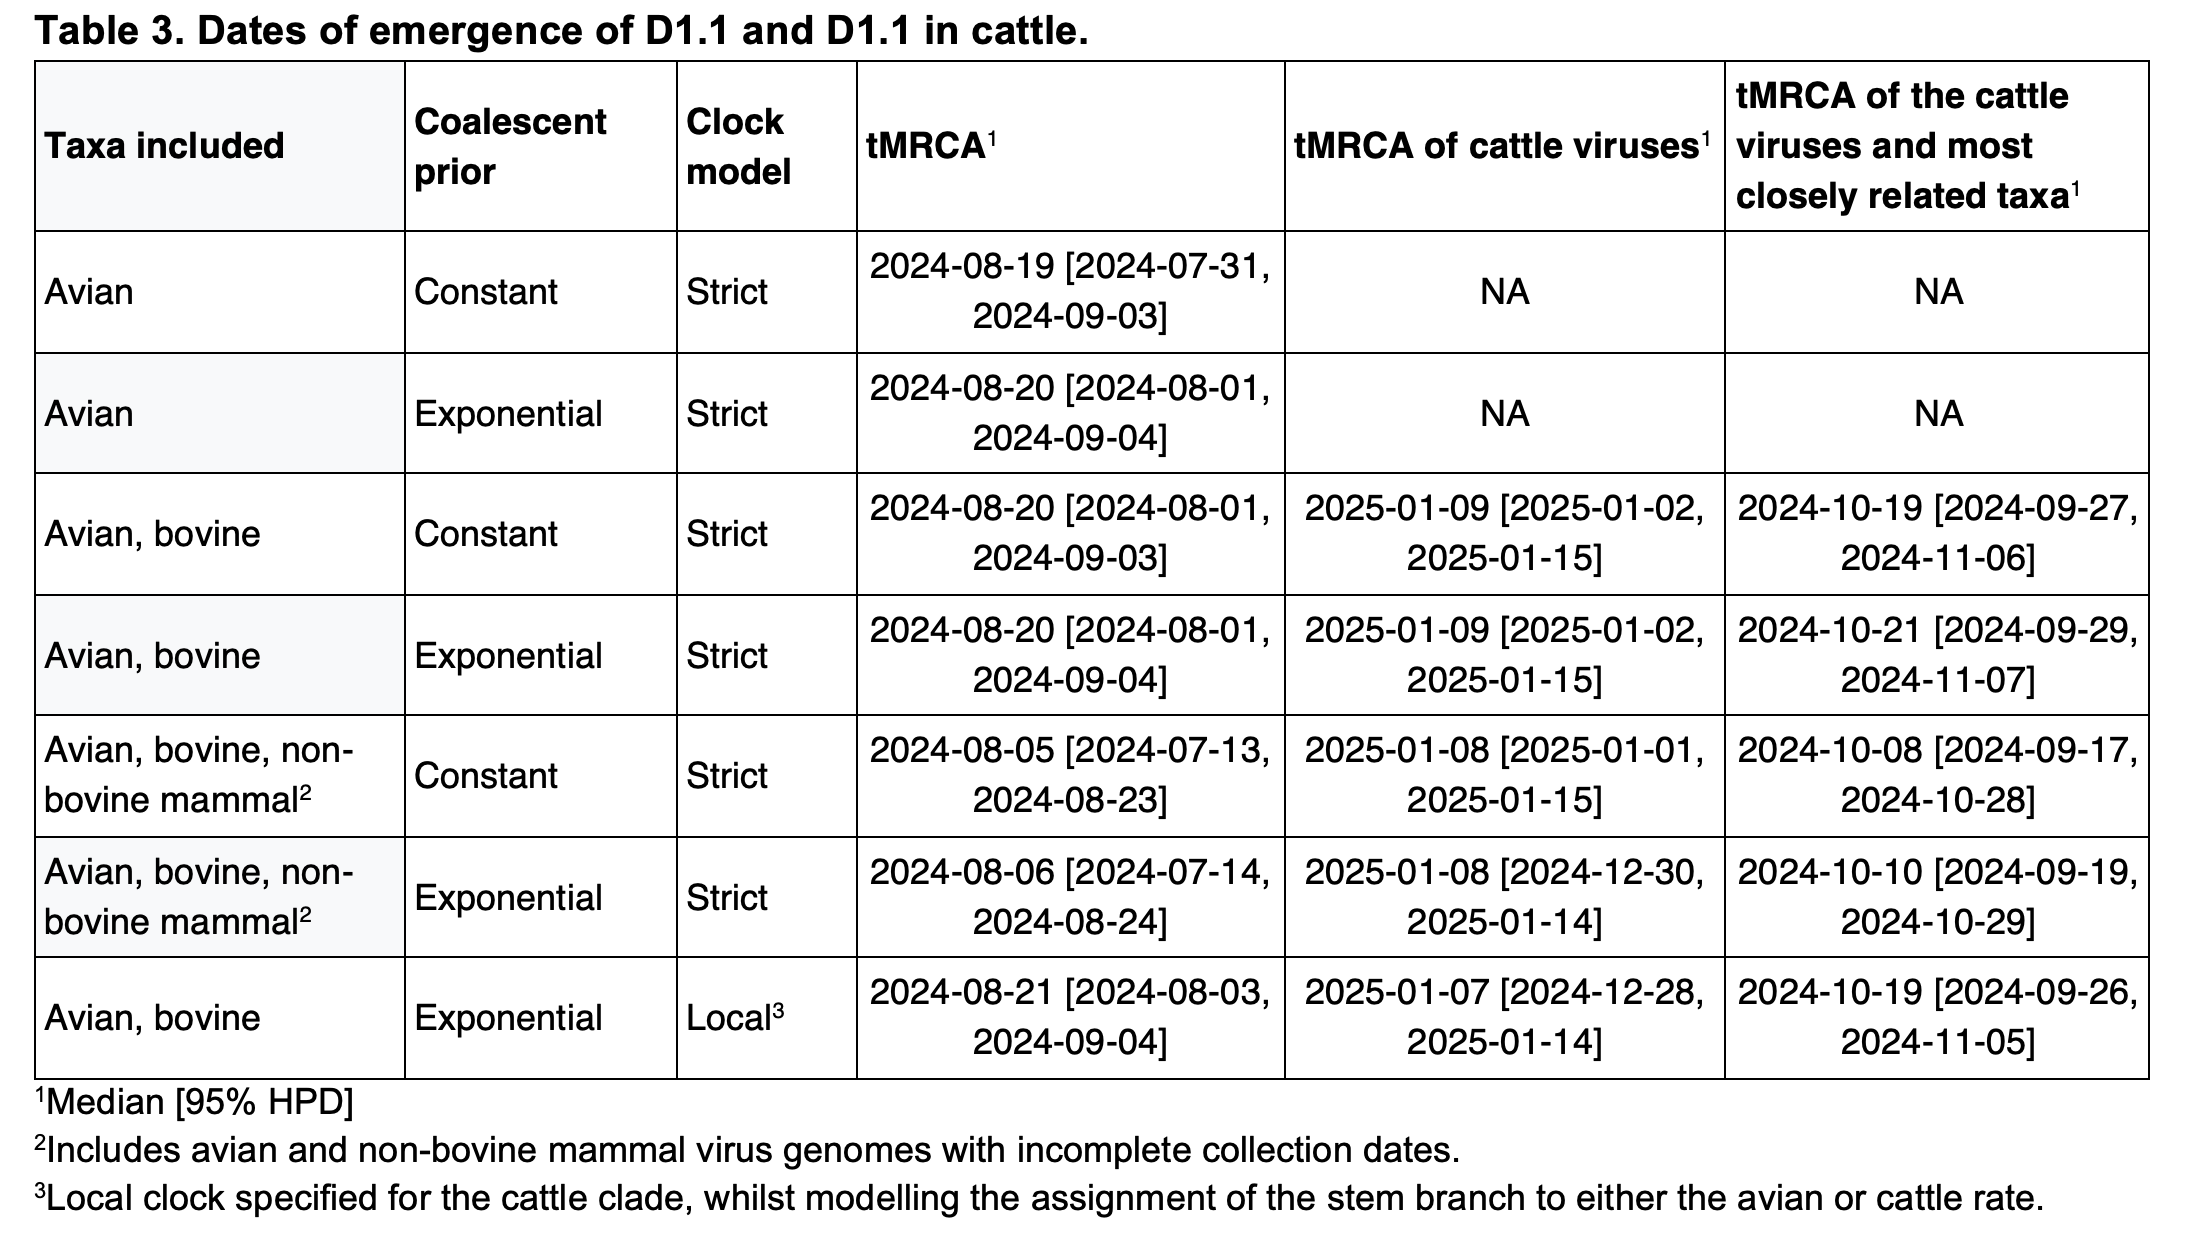
However, considering that the B3.13 cattle viruses appeared to be evolving at a slower rate than either the 2.3.4.4b avian lineage (excluding B3.13 and D1.1) or the D1.1 avian lineage (Figure 5, Table 1), we assumed that the cattle D1.1 lineage evolves at a slower rate as well. There are currently only four published cattle D1.1 genome sequences, all of which were sampled on the same date, which means they cannot be used to calibrate the cattle D1.1 lineage evolutionary rate. We therefore employed a fixed local clock in our inference, utilizing the rate of the cattle B3.13 lineage as a prior for the cattle D1.1 evolutionary rate. For the rest of the tree, minus the branch leading to the cattle clade, we inferred a single, background evolutionary rate, representing the avian lineage D1.1 rate. The evolutionary rate of the cattle clade recapitulated that of the cattle B3.13 lineage rate, and the background evolutionary rate was concordant with the avian D1.1 lineage rate (Table 2). The slower evolutionary rate for the cattle clade – only about half that in birds – resulted in the tMRCA of the cattle clade being slightly earlier, at 7 January 2025 (95% HPD: 28 December 2024 – 14 January 2025), but the tMRCA of the cattle clade and the most closely related avian D1.1 viruses was consistent (mid-late October; Figure 6B; Table 3).
The large difference in the evolutionary rates of clade 2.3.4.4b H5N1 in avian and cattle hosts presents an opportunity to investigate whether the branch leading to the cattle clade represents evolution in birds or cattle, and to estimate when the transition from birds to cattle along this branch might have occurred: in a nutshell, if most of the stem branch evolution too place at the faster, avian rate, we expect and larger “avian” number of substitutions along this branch. But is the jump from birds to cattle occurred just shortly after the MRCA of the cattle clade and the closest avian sequences, we would expect a shorter in terms of substitutions) branch. The support that this stem branch evolved at the same evolutionary rate as in the cattle clade is weak (P=0.291), suggesting that it is unlikely that the spillover from birds to cattle occurred close to the tMRCA of the cattle clade and its most closely related avian viruses (Figure 7B). Rather, we have higher support that the stem branch evolved at the background, avian, D1.1 lineage evolutionary rate (P=0.709). If we assume that the posterior support for the stem branch being assigned the avian rate is proportional to the amount of evolution that occurred in avian hosts along this branch, and that the remainder occurred in cattle hosts after spillover, we approximate a spillover date of December 1st, 2024 (Figure 7C; see Methods). We note that this is an estimate based on the median values from the phylogenetic inference and additional analyses to more precisely estimate the date of D1.1 emergence in cattle are underway.
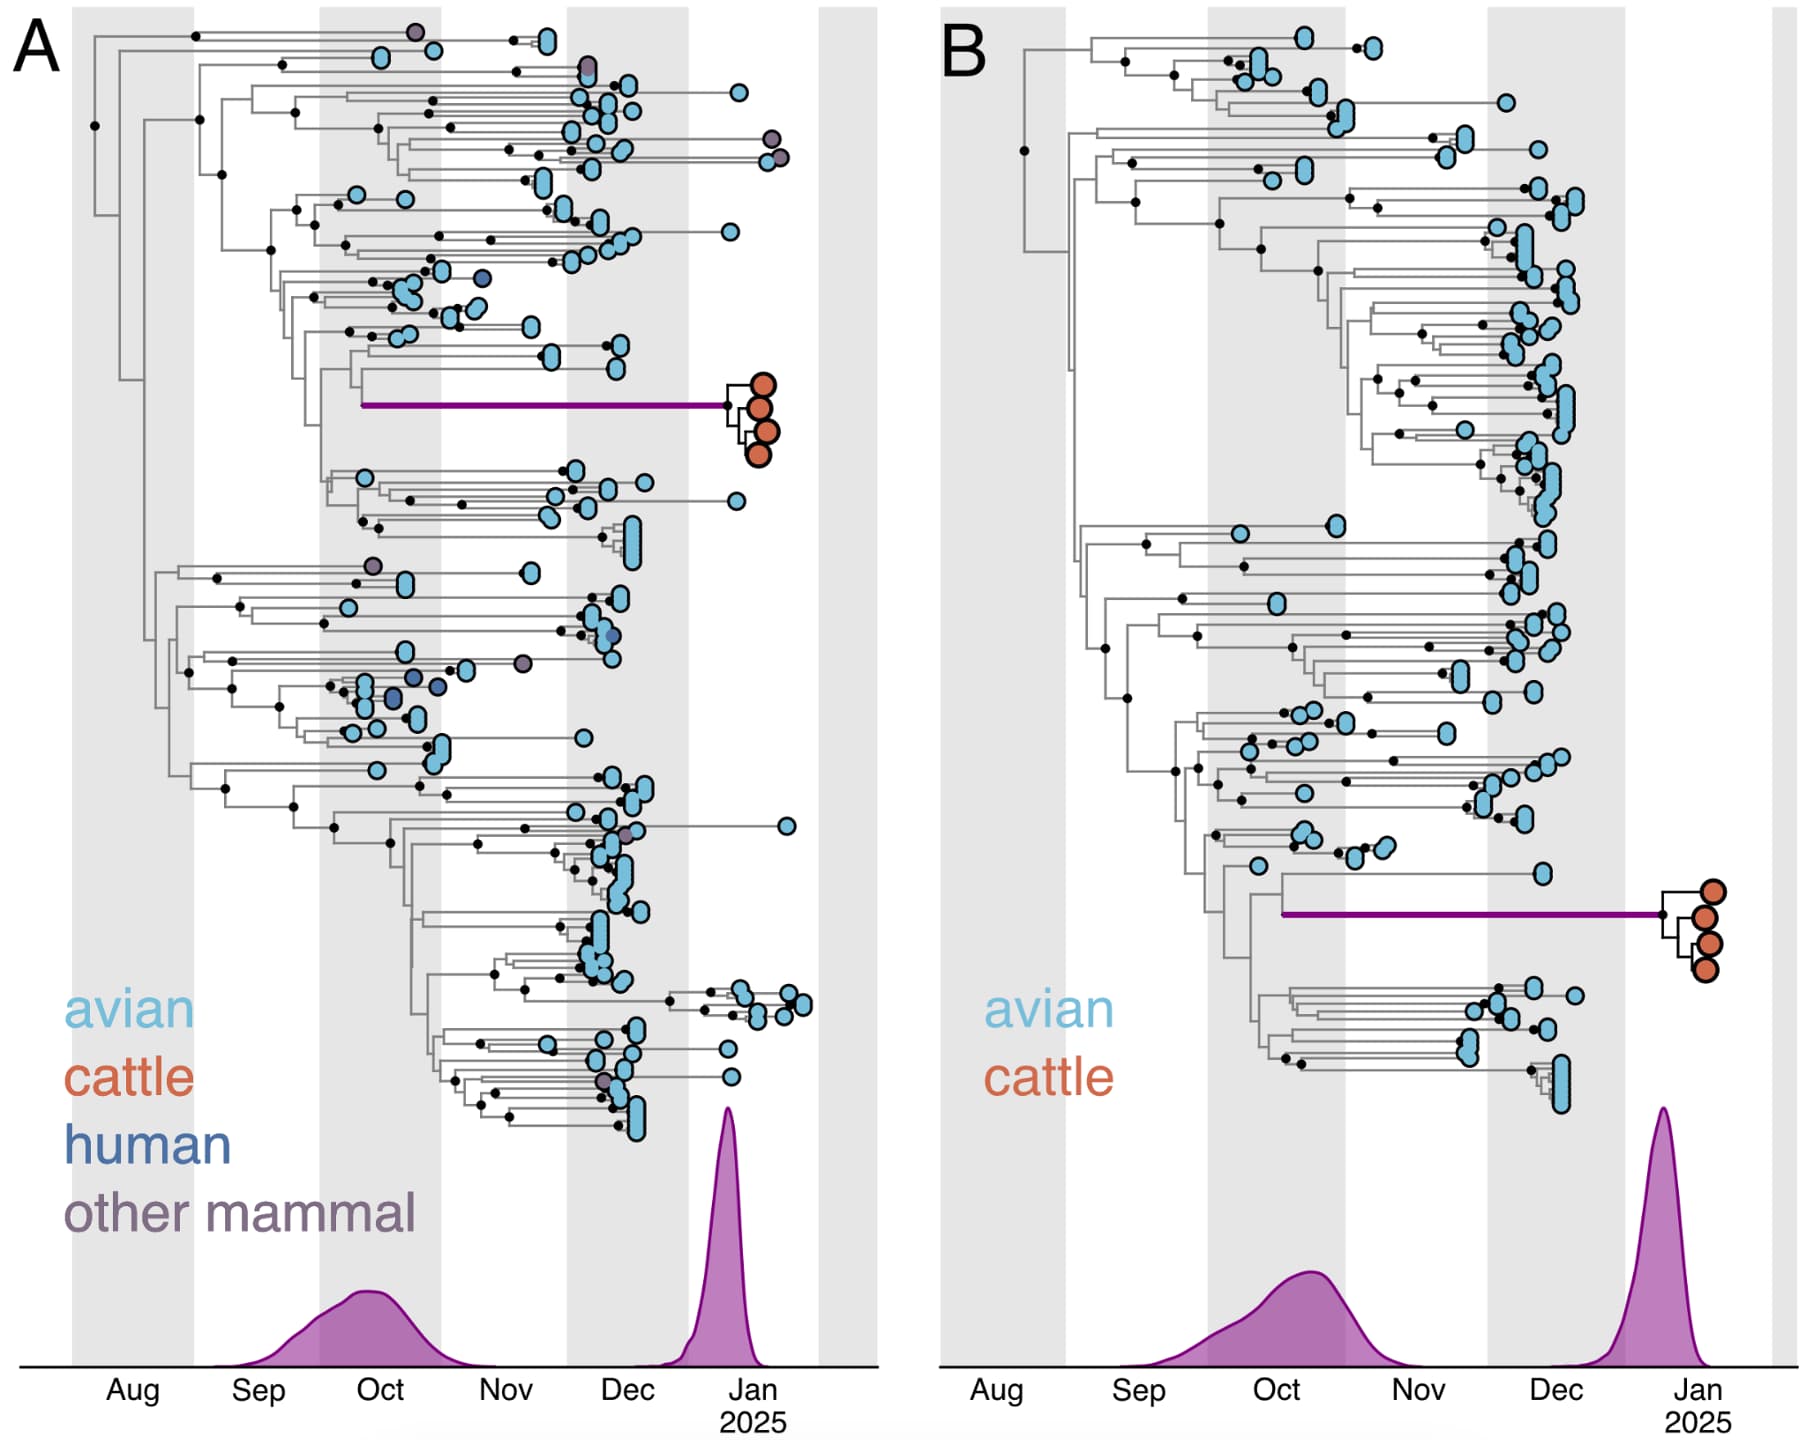
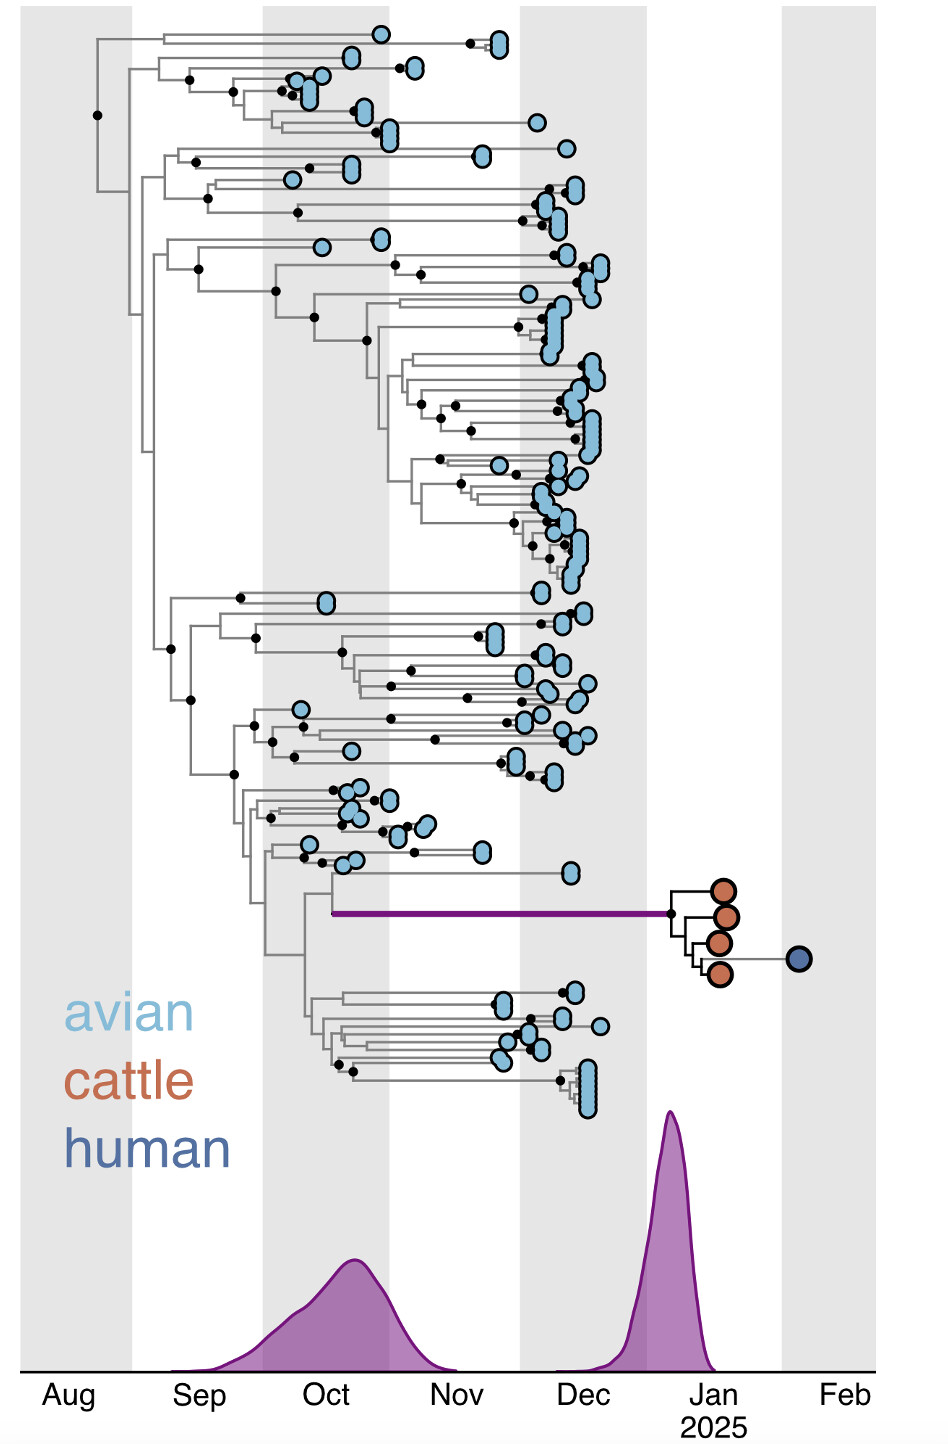
Figure 6 - Temporal phylogenies of 2.3.4.4b D1.1 genomes. A, all available D1.1 genomes from 2024 and 2025. B, all avian genomes with complete sampling dates and the four genomes sampled from cattle, with a fixed local clock specified for the cattle clade. The time during which the D1.1 lineage spilled over into cattle is represented by the thicker purple branch. The start (left) node and end (right) node of this branch represent, respectively, the MRCA of the cattle viruses and the most closely related taxa, and the MRCA of the cattle viruses. The times of these MRCAs are indicated by purple KDE plots in each panel, and the median and 95% HPD are listed in Table 3: panel A corresponds to the analysis with avian, bovine, and non-bovine mammal viruses and an exponential coalescent prior, and panel B corresponds to the analysis with avian and bovine viruses and an exponential coalescent prior.
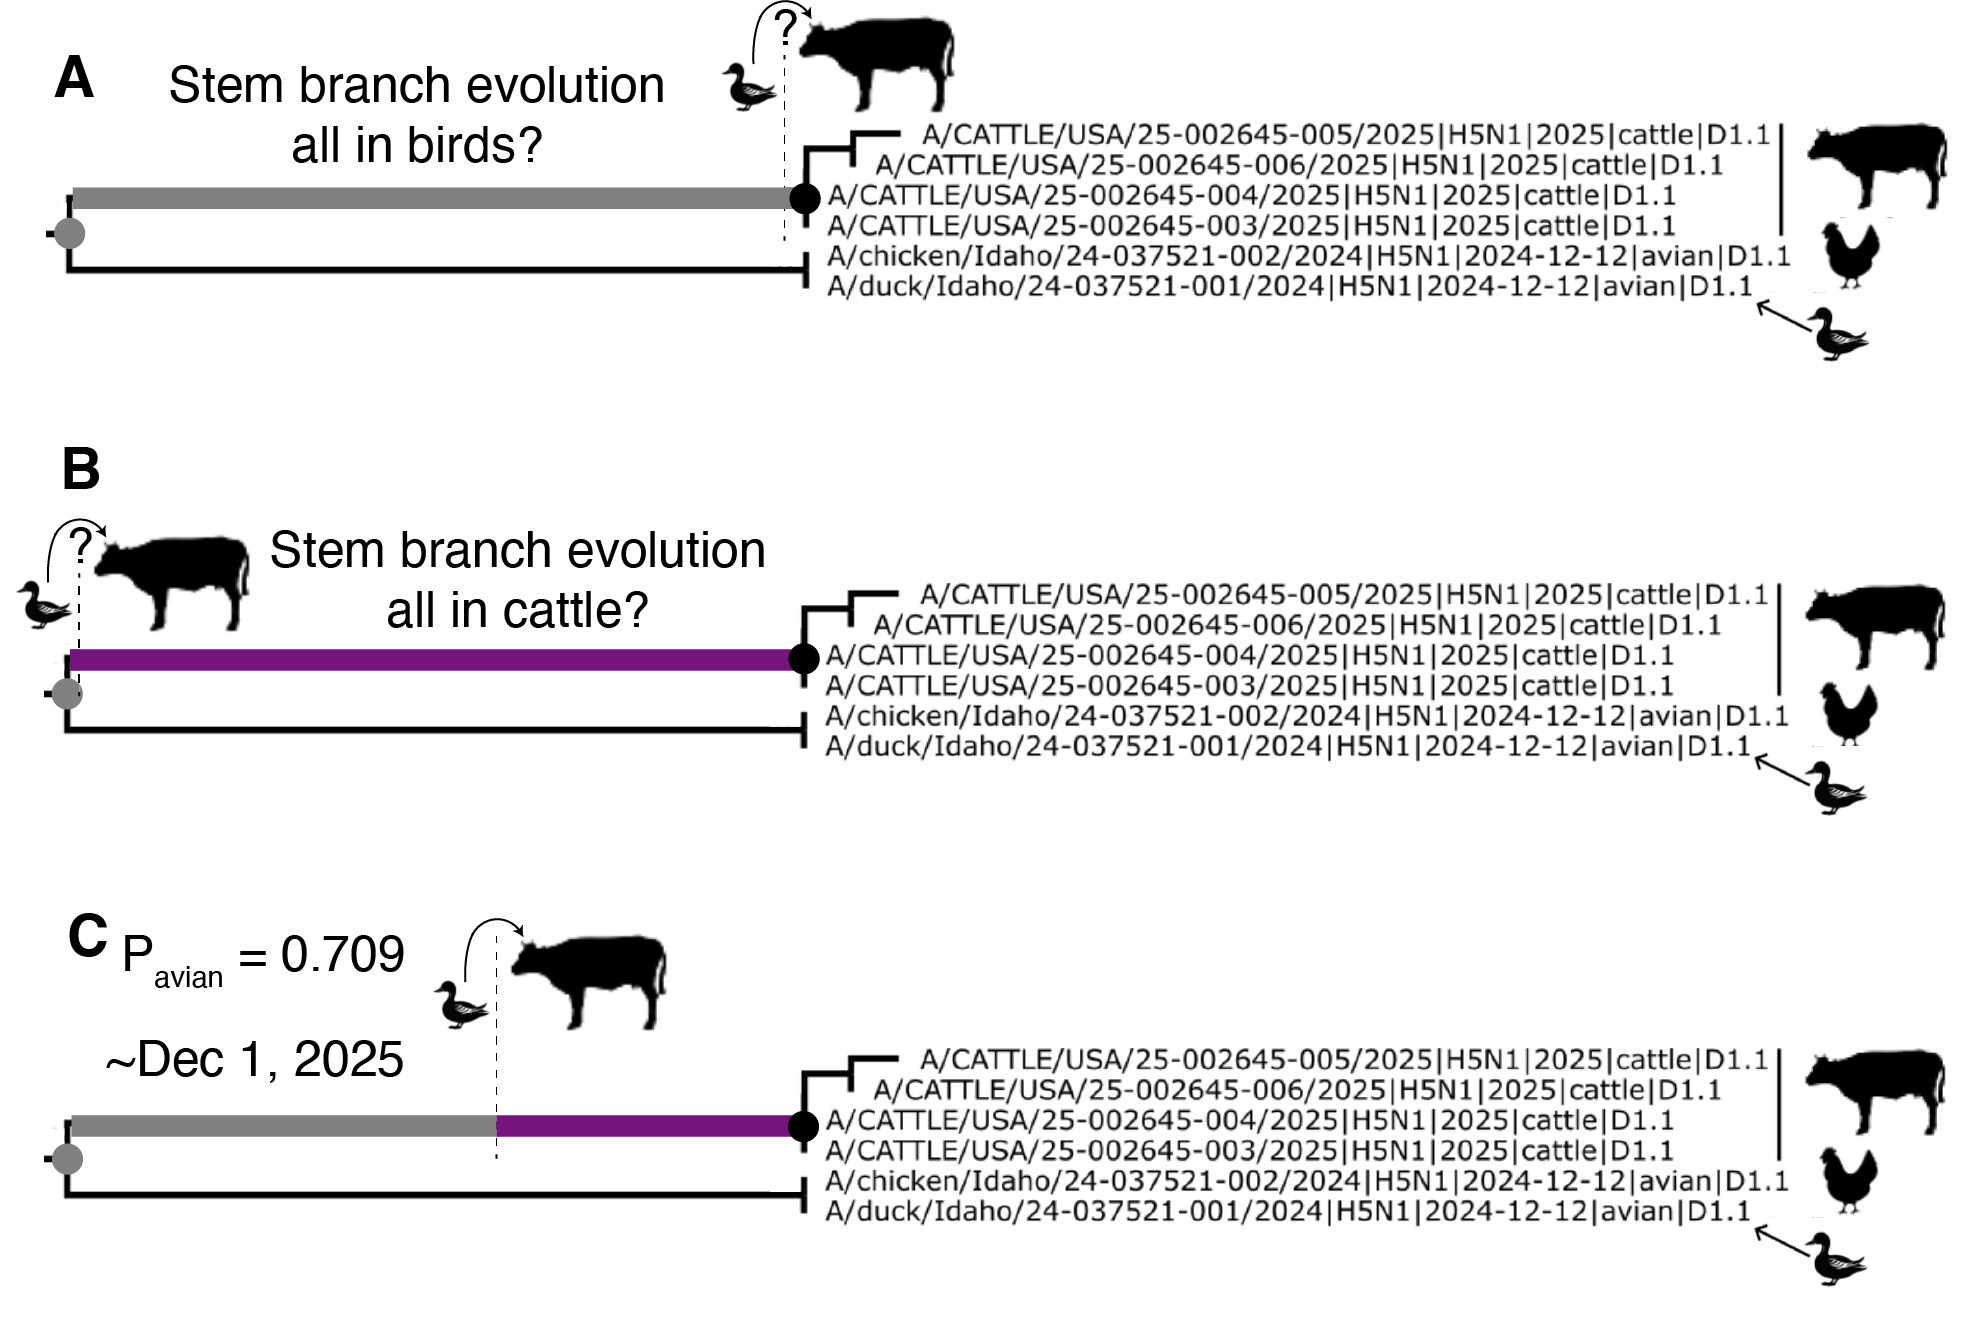
Figure 7. Schematic representation of the branch leading to the cattle clade experiencing different rates of evolution. A, the avian lineage evolutionary rate being assigned to the branch leading to the cattle clade. B, the cattle lineage evolutionary rate being assigned to the branch leading to the cattle clade. C, Time the stem branch evolved at the avian D1.1 evolutionary rate, then the cattle evolutionary rate, based on the support for assigning each of these two rates to this branch.
Noteworthy mutations and substitutions in the D1.1 cattle clade
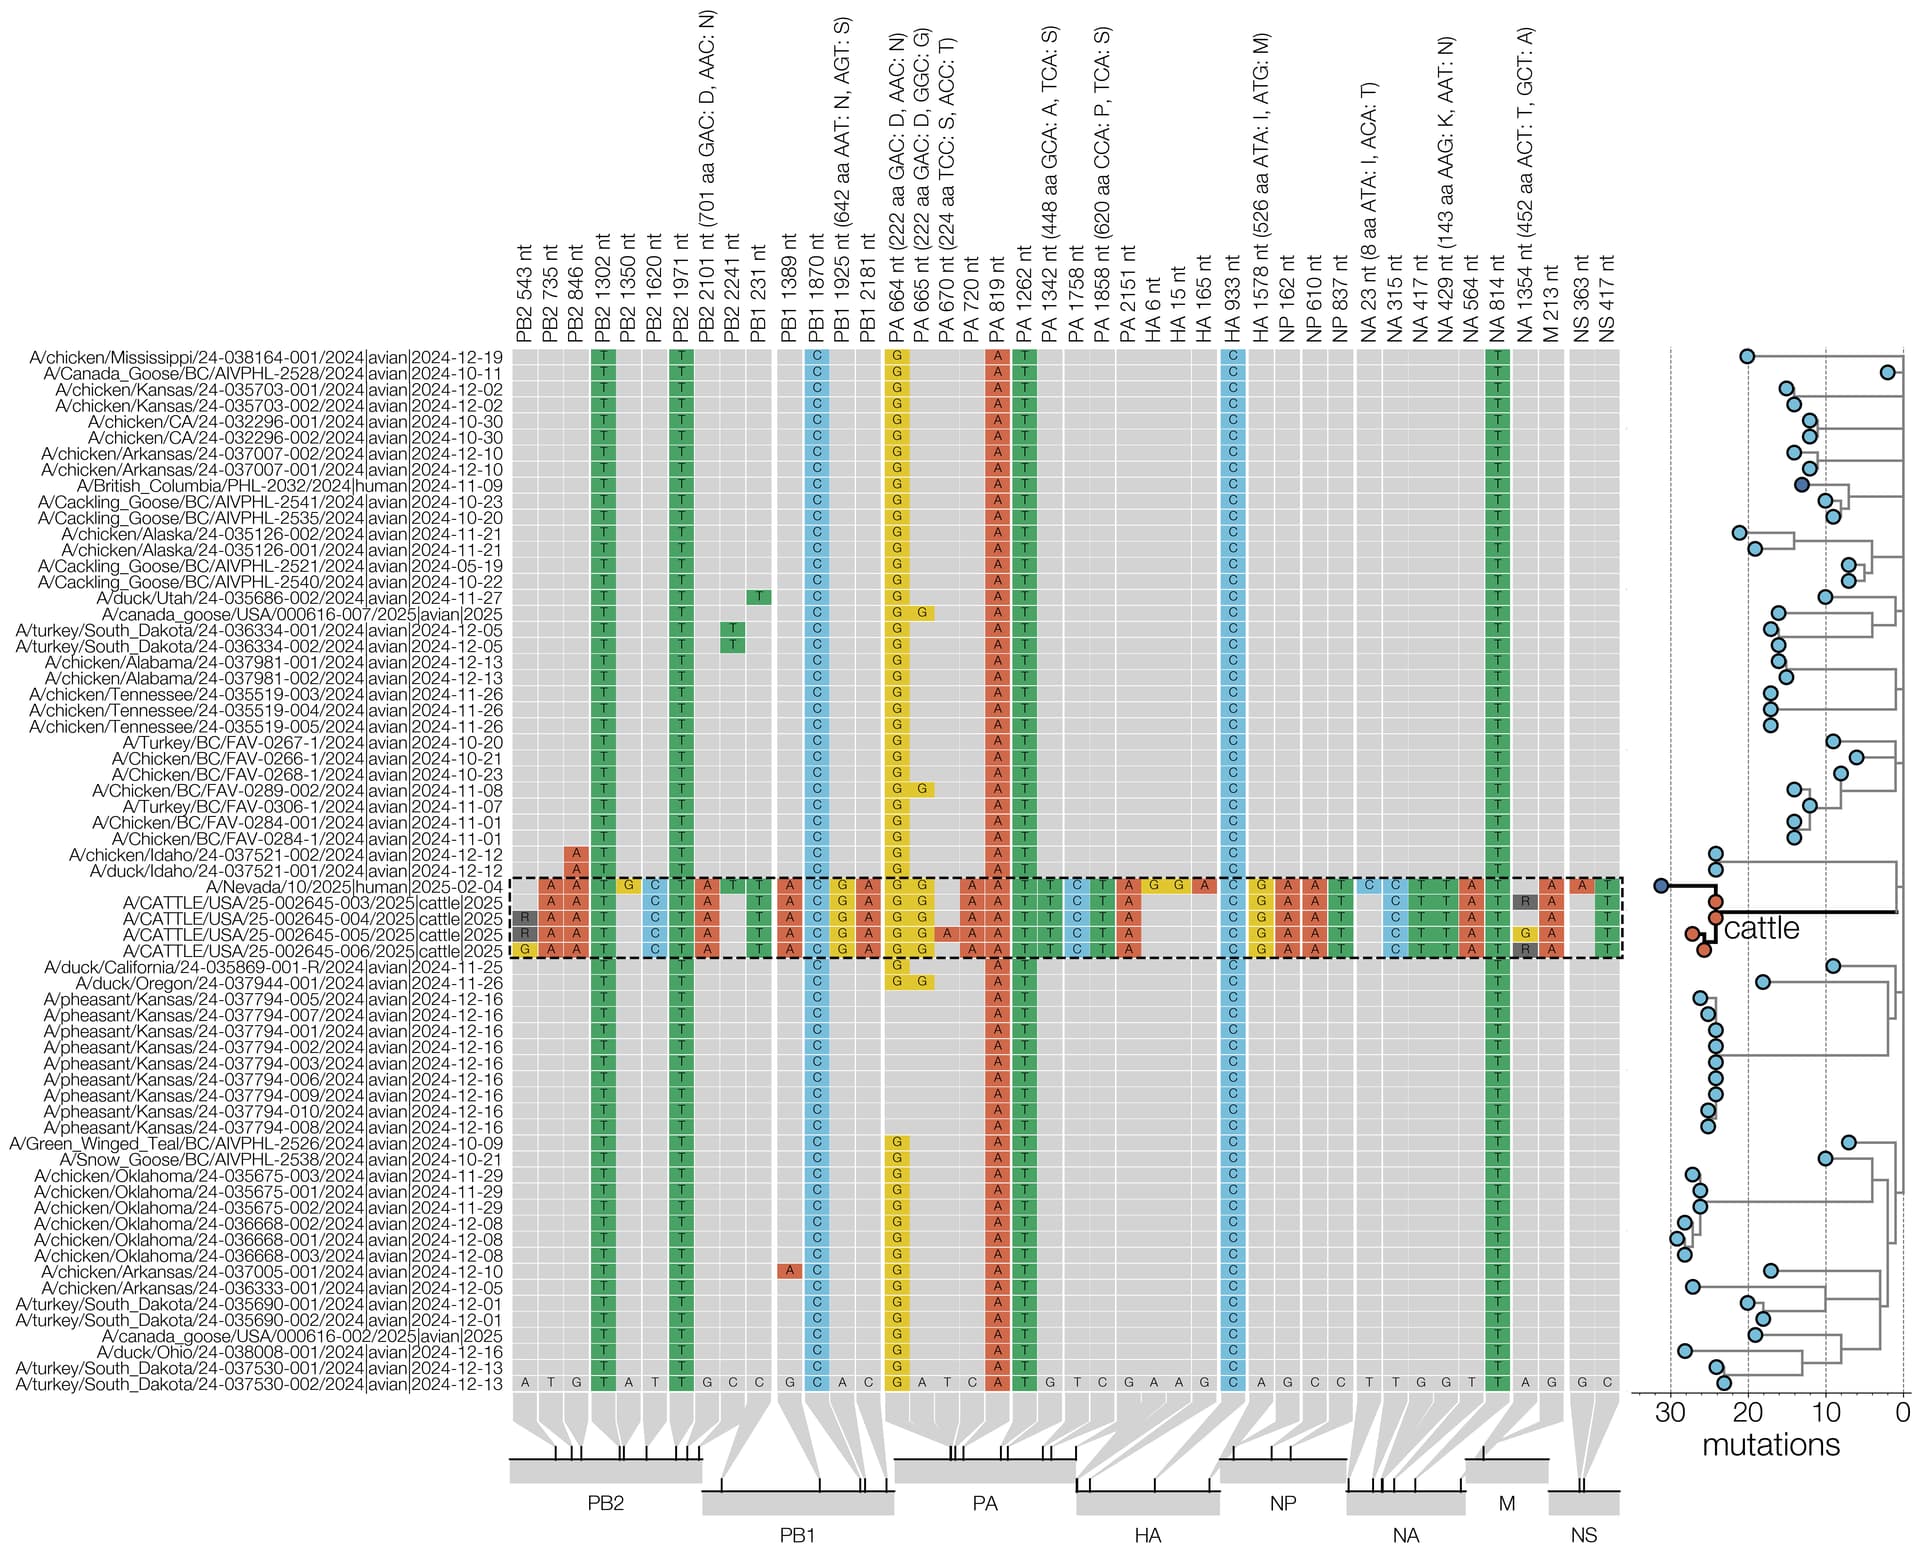
The PB2 mutation D701N is present in the D1.1 cattle cluster (16) but absent in the most-closely related IAV genomes from birds. PB2 D701N is a well characterized mammalian adaptation (17), seen in many avian-origin mammalian-adapted influenza strains, including Eurasian avian-like swine H1N1 influenza viruses, avian-origin equine (H3N8) and seal (H10N7, H3N8) viruses (18), and pinniped 2.3.4.4b genotype B3.2 H5N1 viruses from South America (19, 20, 21). PB2 D701N is also seen sporadically in human infections of avian-origin influenza viruses (22). The mechanism by which PB2 D701N acts is contested, described as either enhancing use of mammalian nuclear important machinery (23) or use of mammalian ANP32 proteins (21, 24). Beyond PB2, several other mutations in the polymerase proteins relative to the closest avian relatives can be found including PA N222G, PA A448S, PA P620S, and PB1 N642S (Table 4, Figure 8).
In the HA gene, the D1.1 cattle sequences contain only one amino acid change in comparison to the most-closely related avian IAV genomes: the V526M substitution, proximal to the transmembrane domain. However, based on deep mutational scanning (DMS) data, this substitution is not predicted to have any immunological, stability, or receptor binding impact (25).
The D1 genotype differs from other North American and European clade 2.3.4.4b H5N1 genotypes in that reassortment has led it to carry a different neuraminidase gene. While all other 2.3.4.4b H5N1 genotypes contain the same NA that was gained during the original reassortment event around 2020 (26), which led to the initial panzootic (27) clade, genotype D1 acquired a distinct N1 from North American waterfowl via reassortment. In the D1.1 cattle cluster, there is a single substitution in NA, K143N (nucleotide substitution G429T; refer to Figure 8 for all cattle clade nucleotide substitutions), which introduces a potential N-linked glycosylation site into the NA head domain. N-linked glycosylation sites in NA can influence properties such as enzymatic activity and antigenicity. It remains to be seen if this represents adaptation that occurred in cattle or if this substitution was present in an unsampled avian donor lineage. Two further amino acid changes, PA S224T and NA T452A are only found in one of the four cattle isolates (Figure 8).
At this stage of the D1.1 outbreak, we see two possible instances of convergent amino acid substitution with pinniped lineages (PB2 D701N, and a different substitution at a common residue in PA (I448V)) but no changes in common with the B3.13 viruses in cattle (Table 3). However, we do find some convergent genetic changes between B3.13 cattle viruses and IAV outbreaks/spillovers in pinnipeds (the latter driven mainly by 2.3.4.4b H5Nx viruses), such as PB1 S384P and NS1 S7L (Table 4). Monitoring further circulation of D1.1 will be important to understand whether the two cattle lineages will use differing or overlapping mutational pathways for adaptation.
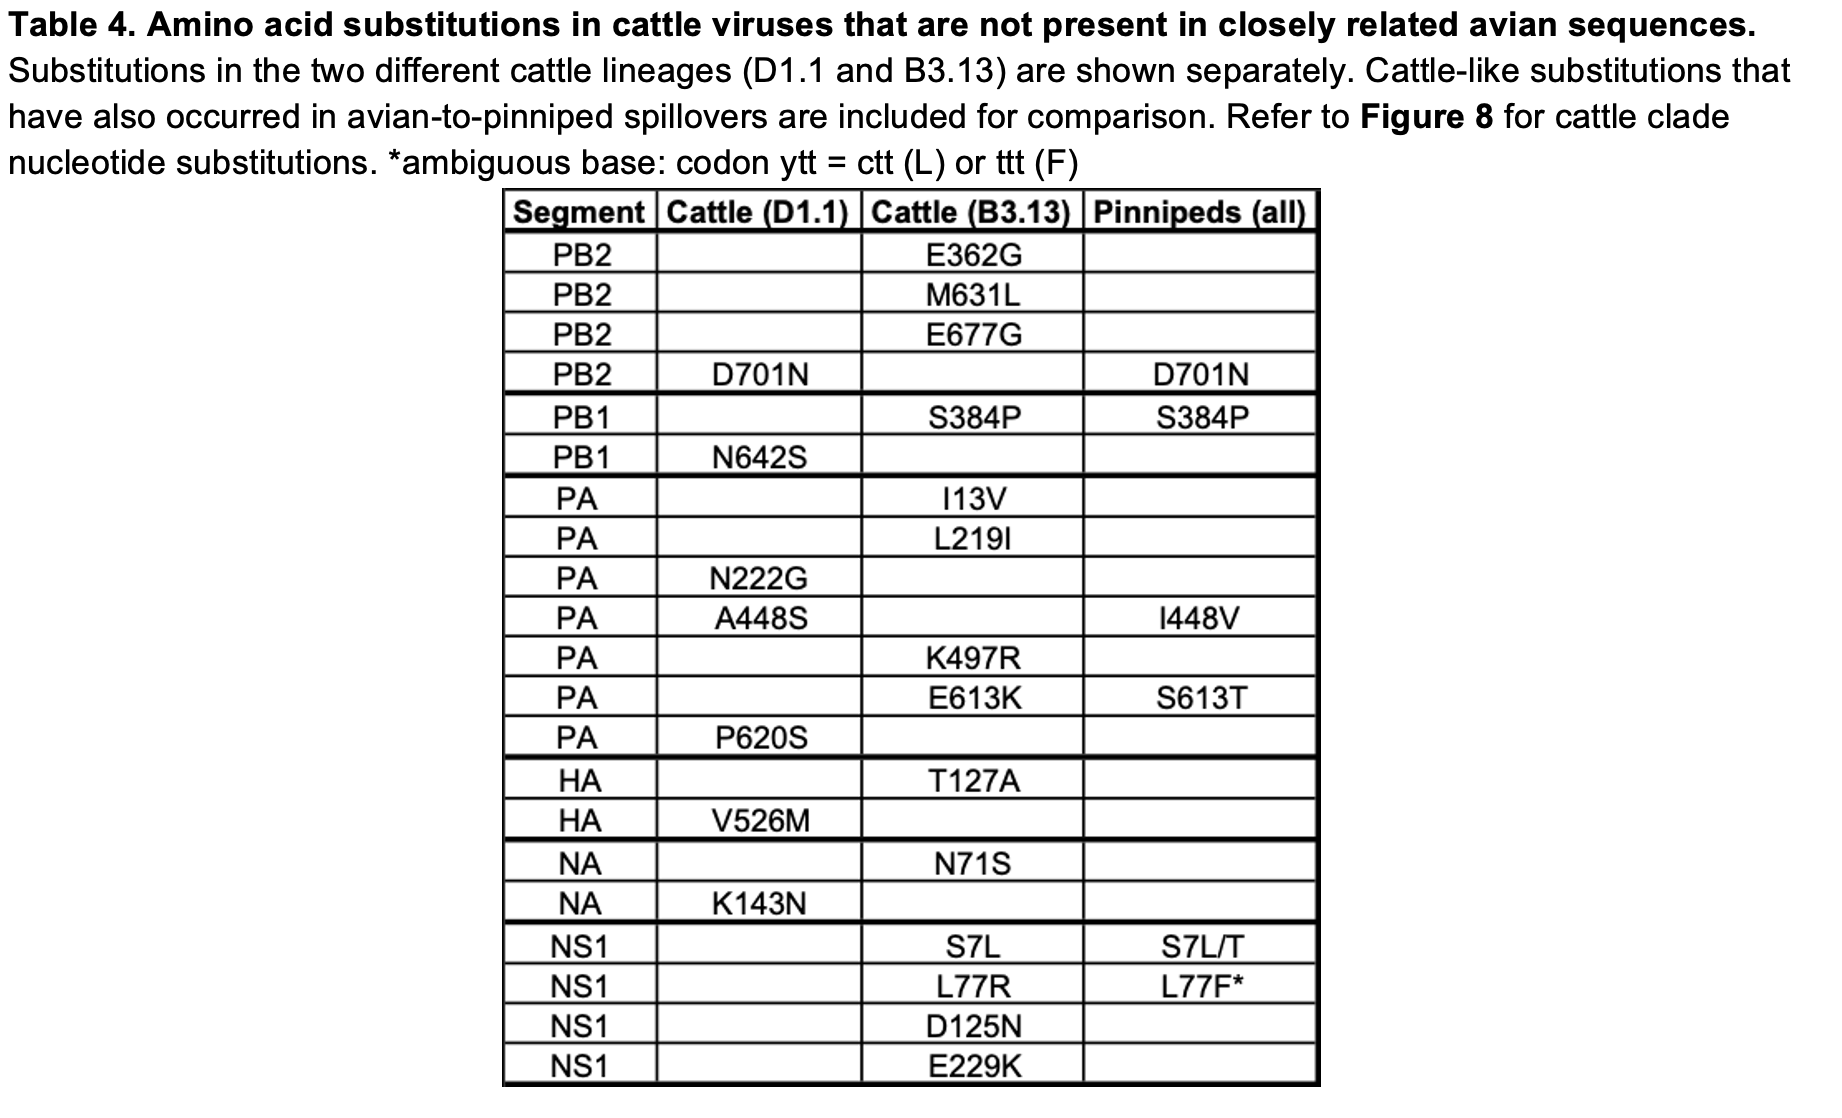
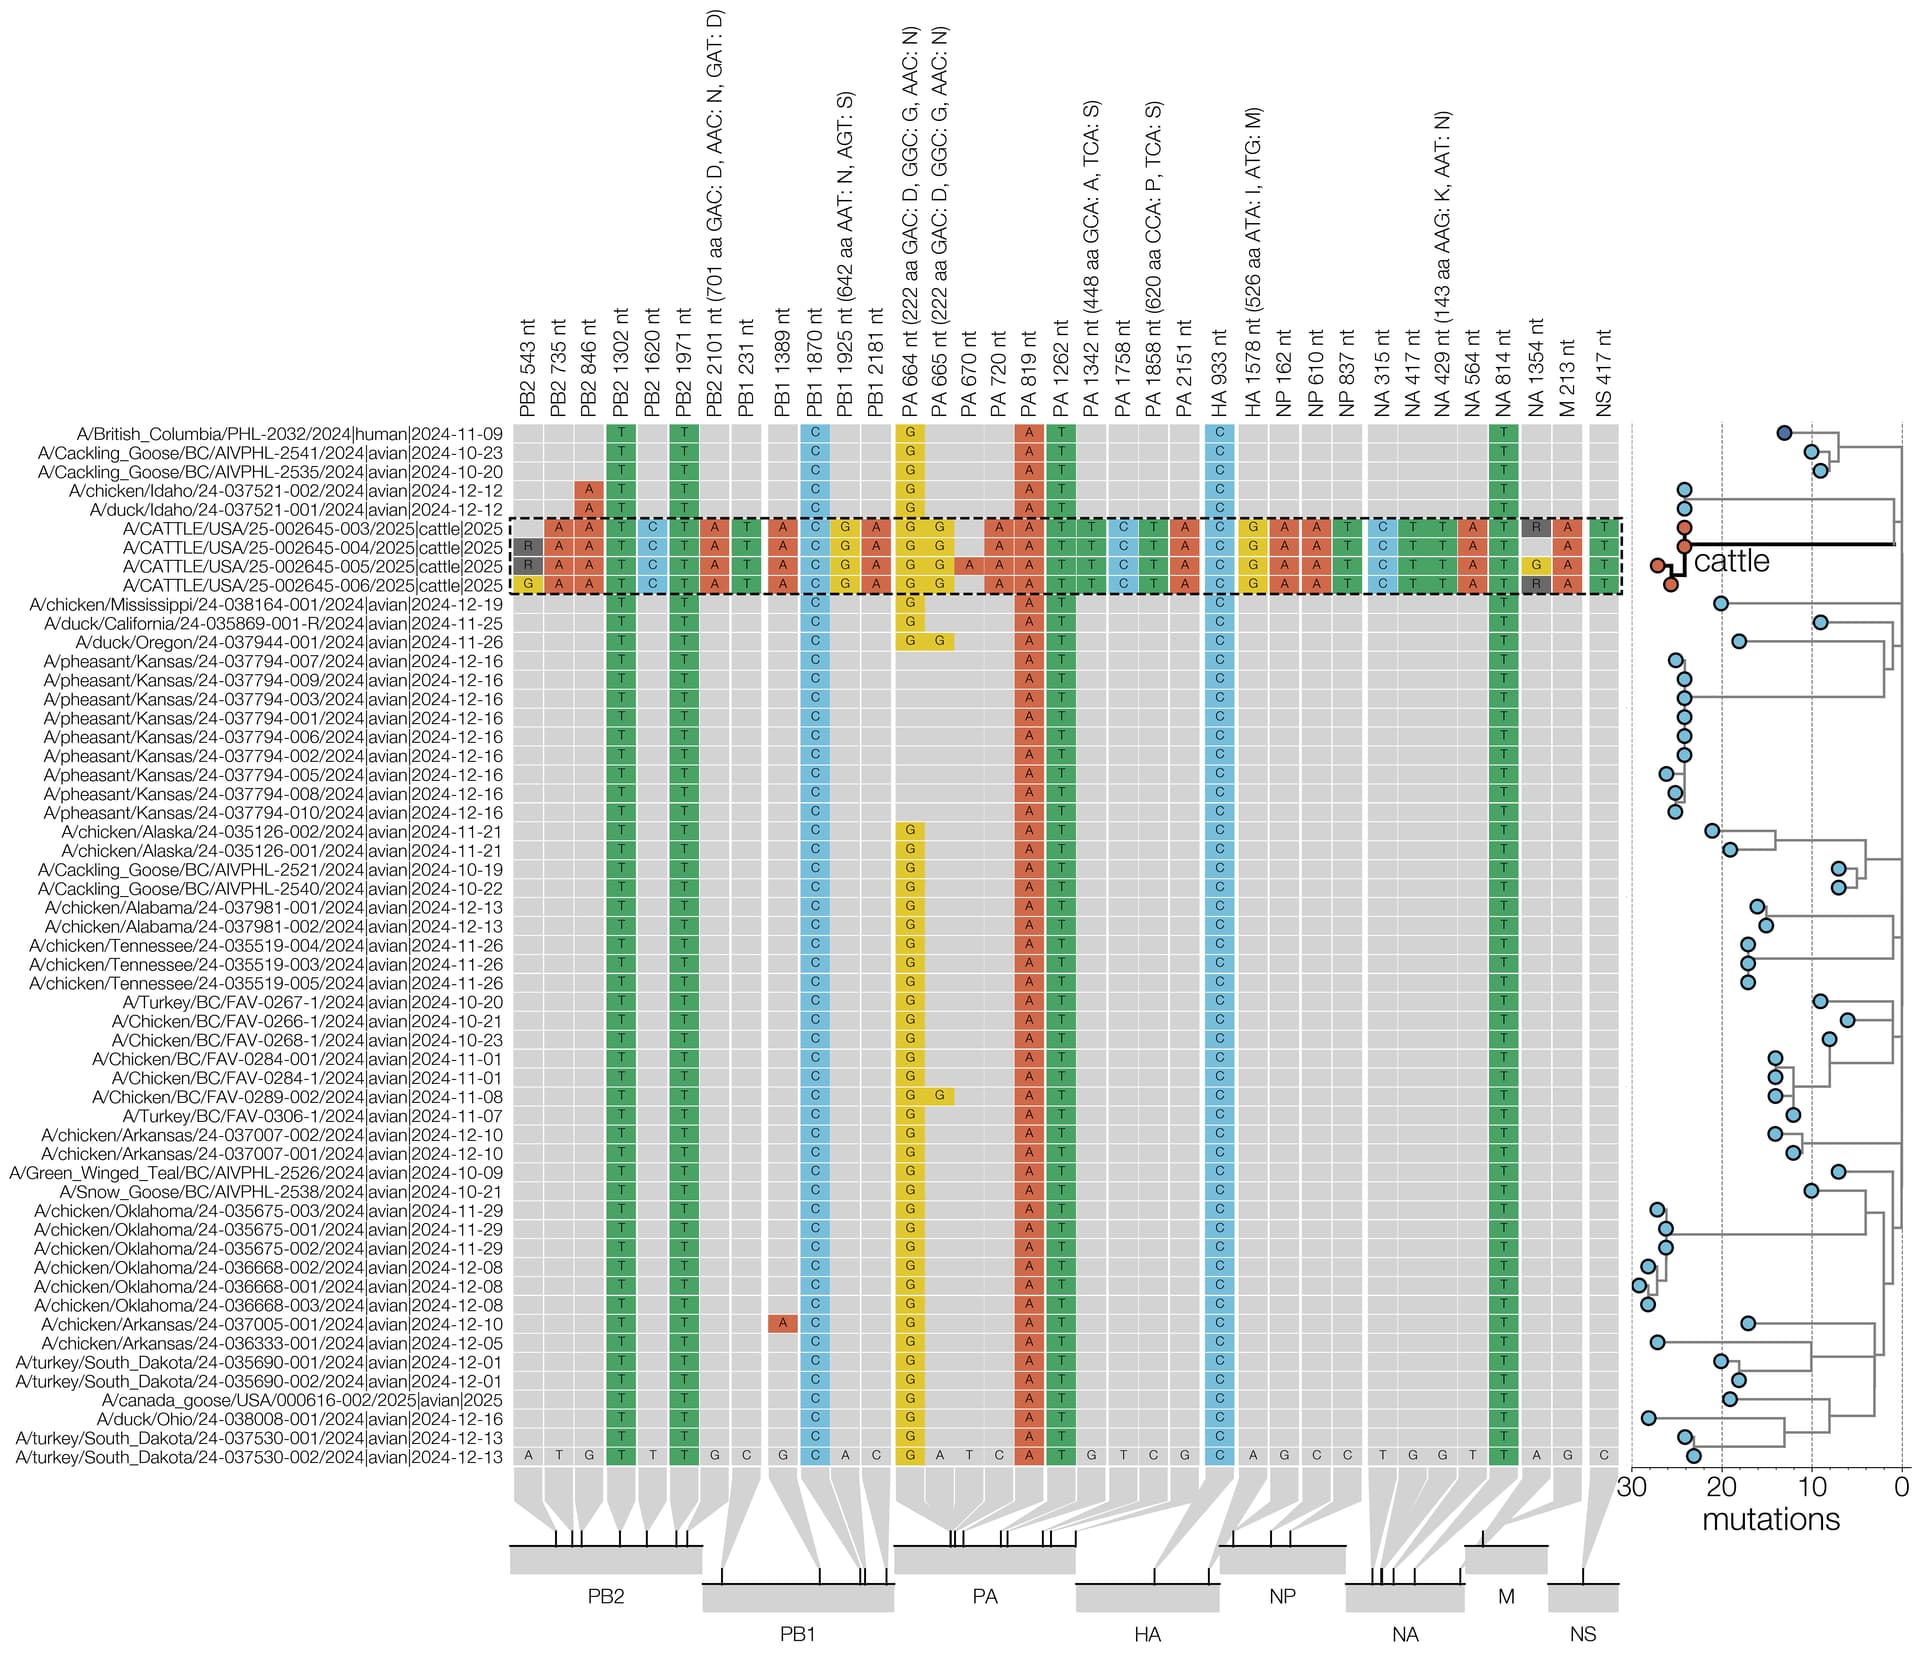
Figure 8 - Condensed alignment of genome positions variable in cattle. D1.1 sequences (outlined with a dashed line) compared to alignment consensus. For clarity only a subtree containing the cattle and human D1.1 sequences is shown here (right, branch lengths scaled to number of substitutions). Relative positions of each site variable in cattle D1.1 sequences are shown at the bottom.
Because of length restrictions, the Discussion, References, and an Addendum describing late-breaking findings can be found in the “Reply” immediately below.