The emergence of the B.1.1.7 lineage in Jordan
Edyth Parker*, Catelyn Anderson*, Mark Zeller*, Jennifer Havens*, Ahmad Tibi, Lama Hussein, Shayma Ali, Badia Saddedin, Refugio Robles-Sikisaka, Ezra Kurzban, Emily Spencer, Karthik Gangavarapu, Marc Suchard, Joel O. Wertheim, Amid Abdelnour, Kristian Andersen, Issa Abu-Dayyeh
SARS-CoV-2 lineage B.1.1.7 was first sampled in Kent, United Kingdom (UK) in September 2020, rapidly expanding to become the dominant lineage in the UK within a few months and disseminating to 83 countries as of February 2021. 1–3 B117 is distinguished by a large number of lineage-defining non-synonymous mutations and 3 deletions, including a deletion at position 69-70 in the spike (S) protein that results in a failure to detect the S gene in a commonly used RT-PCR assay (“TaqPath”, ThermoFisher).4 This so-termed S gene target failure (SGTF) has become a proxy for monitoring B.1.1.7 circulation and growth.2 The first SGTF in diagnostic PCR testing in Jordan was reported on 23 December 2020 and subsequently confirmed as B.1.1.7 by sequencing. Given the mounting evidence for the increased transmissibility and mortality of B.1.1.7 relative to other SARS-CoV-2 lineages, it is crucial to understand the growth and transmission dynamics of B1.1.7 in Jordan and actively monitor its prevalence to support public health interventions.1,2,5,6 Here we investigate the dynamics of B.1.1.7 in Jordan using two approaches: a phylogenetic investigation of the timing and number of introductions, and modeling the proportion of SGTF in diagnostic PCR tests across time as a proxy for B.1.1.7 prevalence in Jordan.
Results:
The first case of SARS-CoV-2 was detected in Jordan on the 2 March 2020, but the onset of a local epidemic wave was delayed until September with an integrated public health approach including travel restrictions, business and school closures and public gathering bans (Figure 1A, Figure 2). The epidemic peaked around November 2020, with the daily case counts declining steadily following the mid-October reintroduction of interventions such as Friday curfews and mask-wearing orders after previous relaxation of policies (Figure 2). The concurrent decline of the effective reproductive number reflects this, largely controlled at below 1 for the time period between November and mid-January (Figure 1B). The effective population, as estimated by the non-parametric coalescent Skygrid model (see methods) supports the decline of the population from November onwards, complimenting clear evidence that the non-pharmaceutical interventions in place were sufficient to reduce incidence prior to the local emergence of B.1.1.7 (Figure 1C, Figure 2).
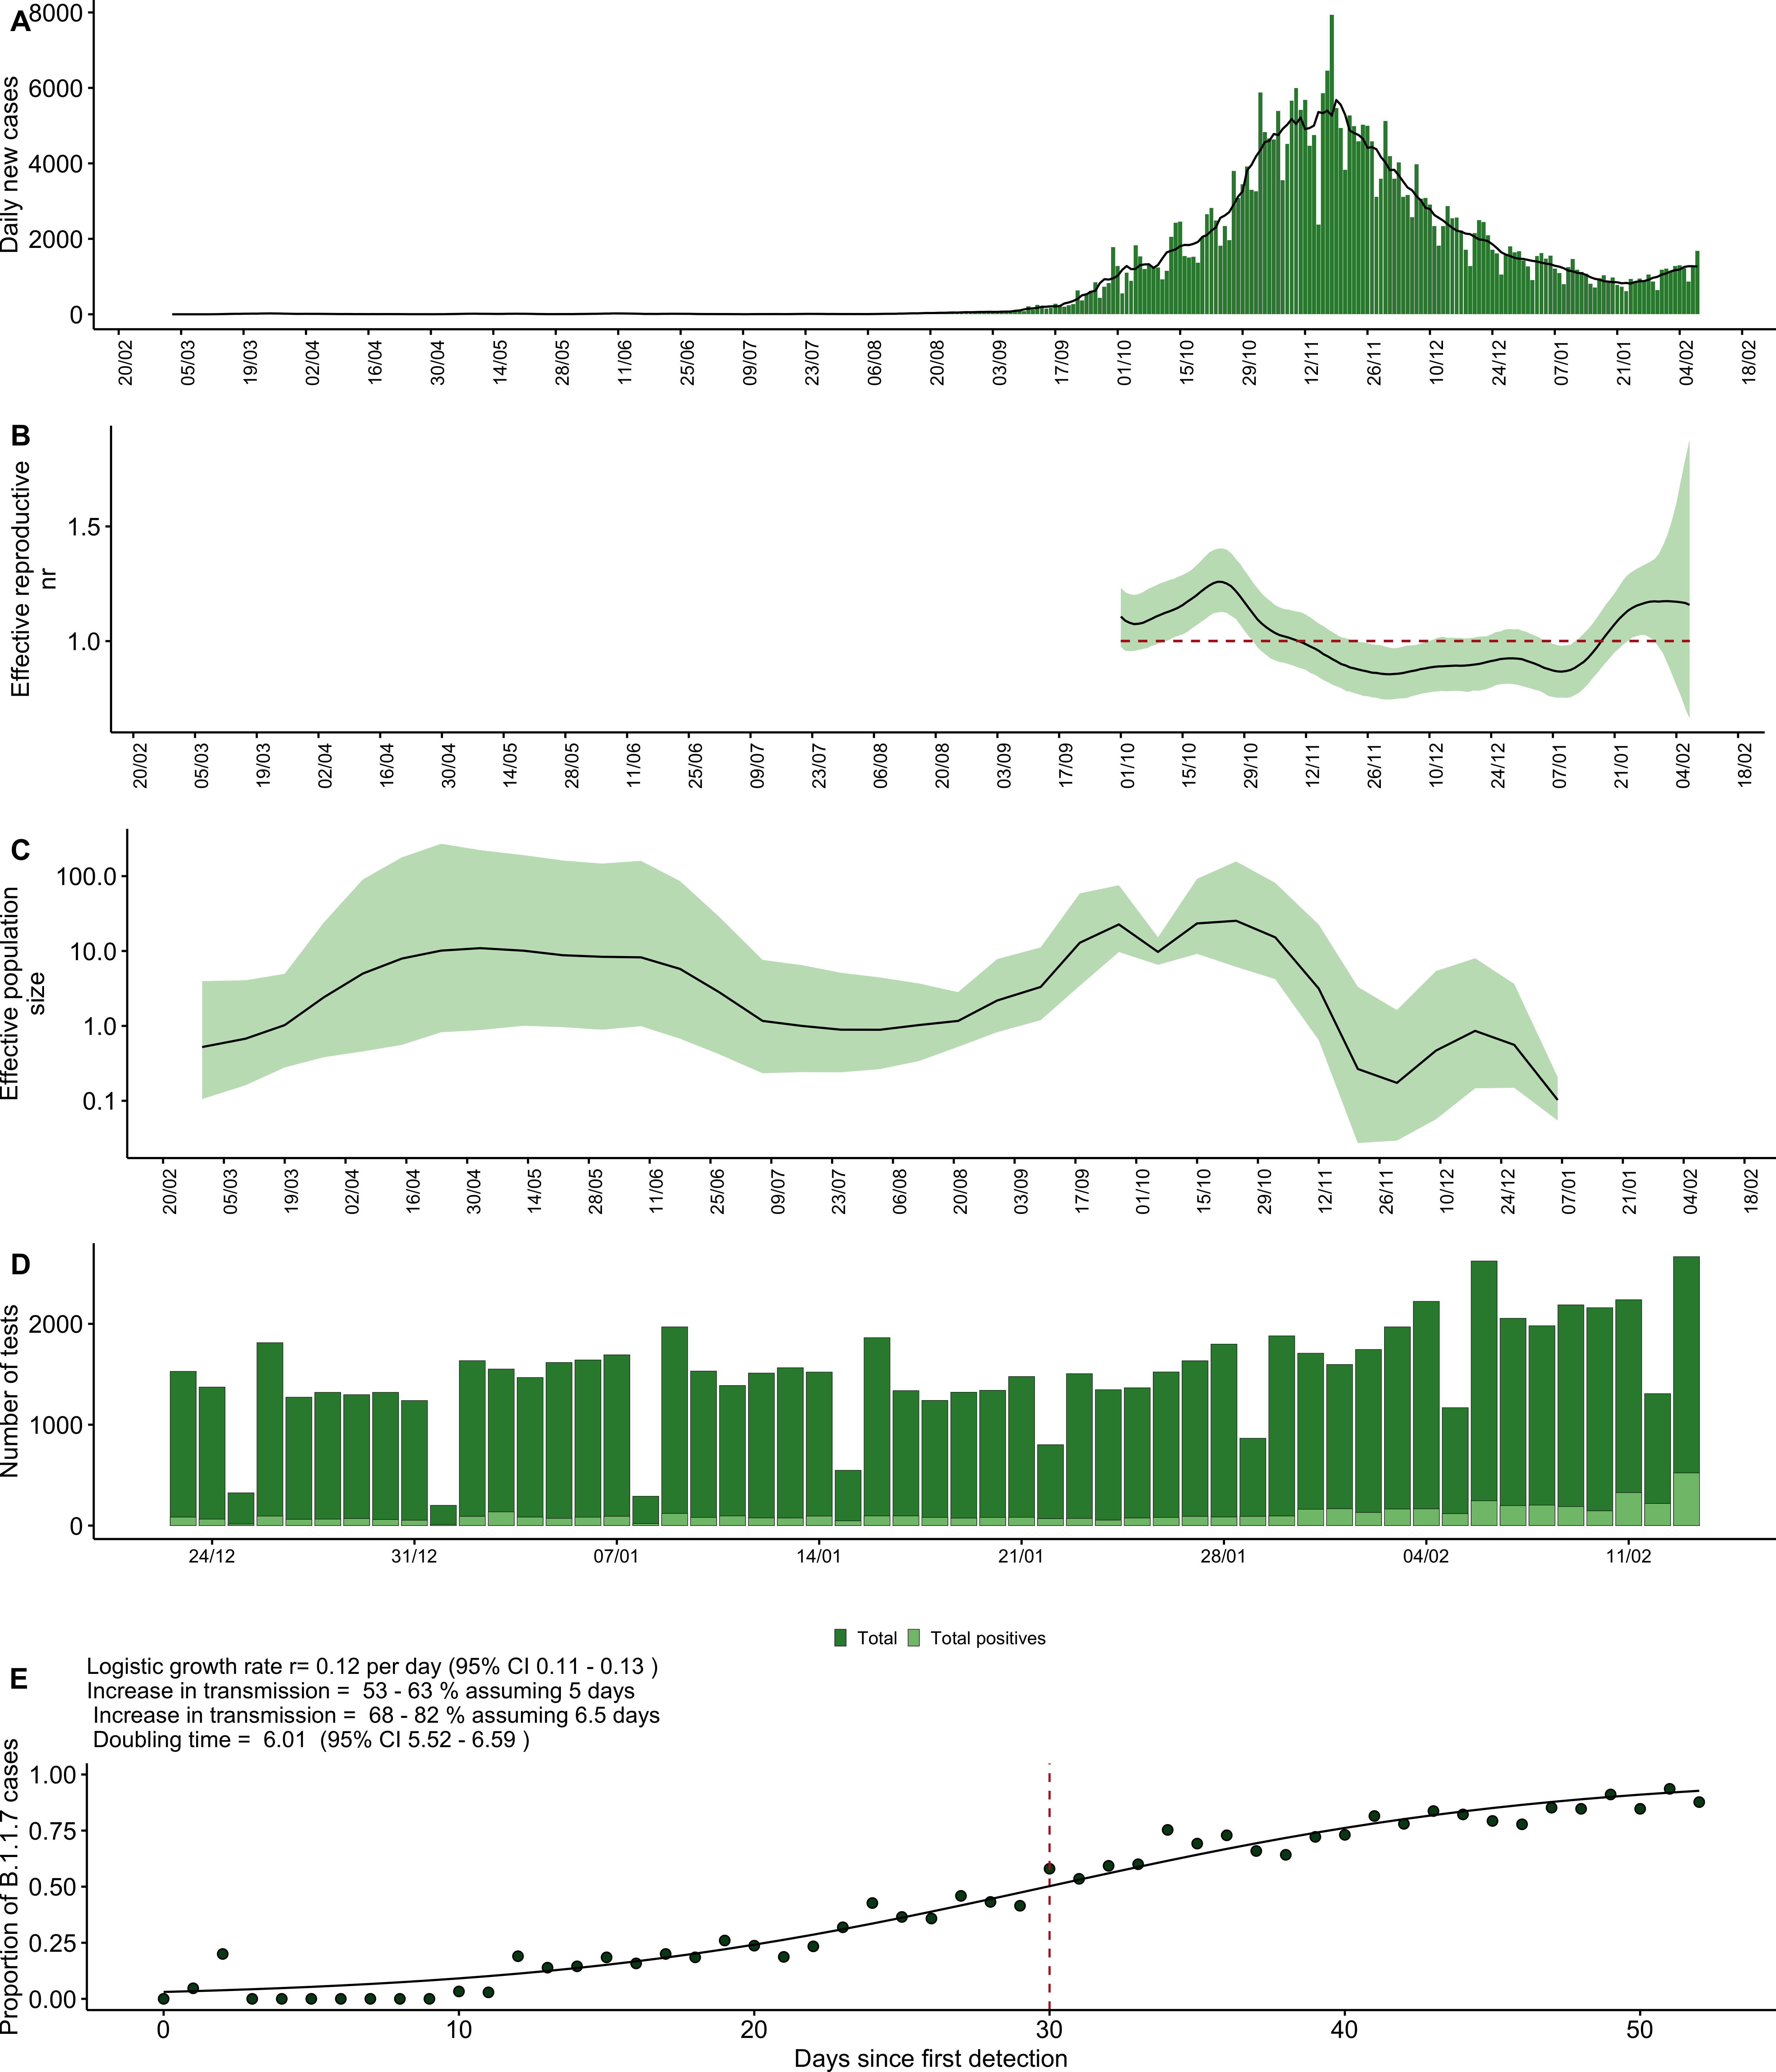
Figure 1. A) Daily new cases in Jordan over time. B) Effective reproduction number estimated from the daily new case counts. Line represents median estimate and the ribbon the 90% credible interval. Estimation was only performed for the period surrounding the epidemic peak, to limit uncertainty stemming from data sparsity. C) Effective population size estimated under the Skygrid coalescent model. D) Number of tests performed at Biolab Diagnostic Laboratories and proportion of positives tests since late December. E) Logistic growth model fit to proportion of SGTF in total positives tests performed at Biolab Diagnostic Laboratories in Jordan. Red line indicates the number of days since first detection when the proportion of B.1.1.7 cases crossed 50%.
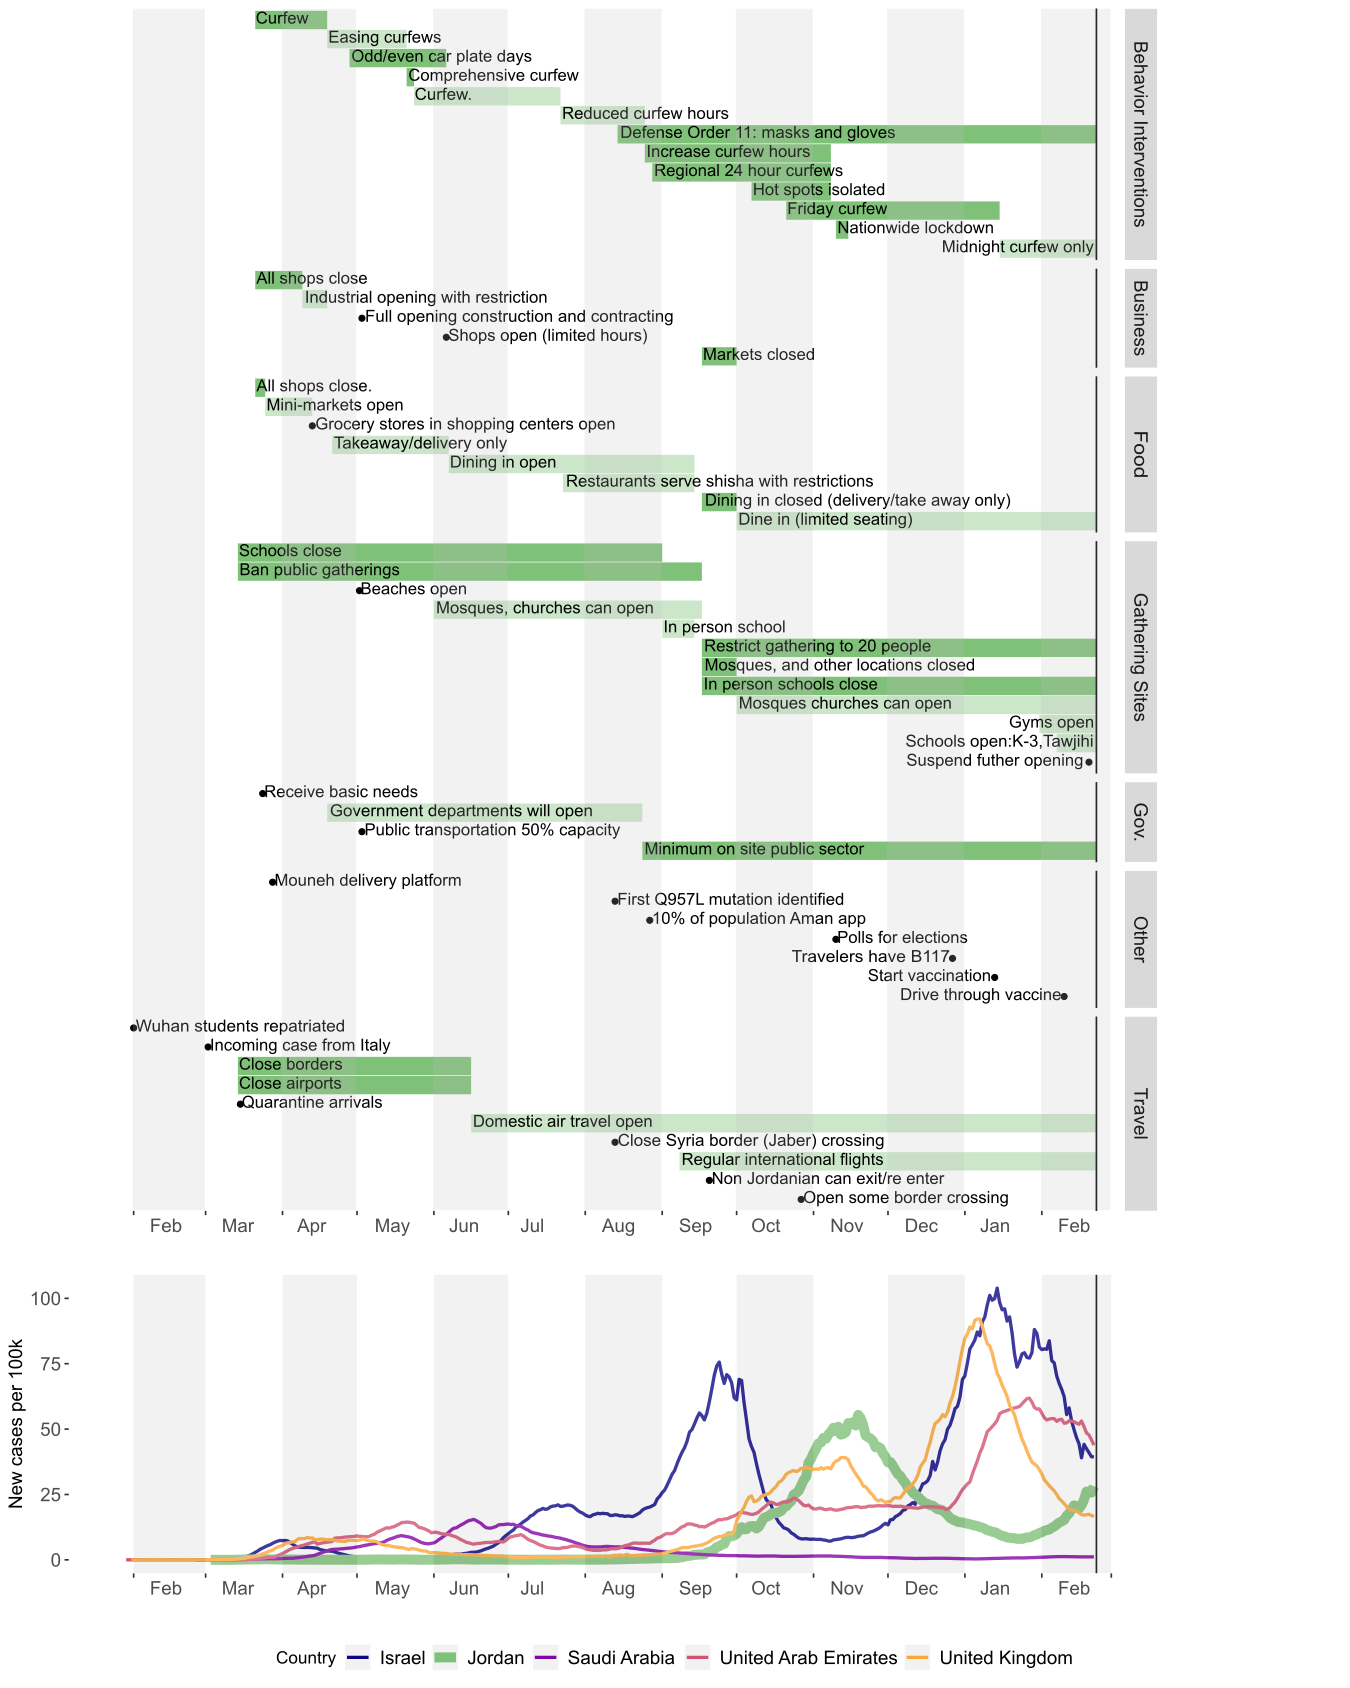
Figure 2: Timeline of non-pharmaceutical public health interventions in Jordan
Biolab Diagnostic Laboratories in collaboration with the Andersen lab at Scripps Research produced 579 whole genomes, sampled from 16 March 2020 onwards. Sampling was predominantly concentrated in Amman (n=481), Irbid (n=57), and Aqaba (n=41) and performed by Biolab medical technologists in dedicated branches, drive thru testing sites as well as with house visit services. We reconstructed a maximum-likelihood phylogeny using the Jordanian focal sequences and a downsampled set of sequences representative of global genomic diversity, available from GISAID (Figure 3A, see Methods). Before the emergence of B.1.1.7, the majority of sequences sampled in Jordan represented two major clades, with a number of singletons interspersed throughout the tree supporting multiple introductions of divergent lineages including potentially undersampled lineages contributing to community transmission (Figure 3A, D-G). The majority of sequences belonged to lineage B.1.1.312 (Clade 20B), which was largely sampled from mid-August to early-November 2020 and is predominantly unique to Jordan.7 The lineage is defined by a set of characteristic mutations that include the spike Q957L substitution, which is only found in lineage B.1.1.311 in England (n=20 sequences) with low-frequency detection otherwise. B.1.36.10 (Clade 20A) formed a minor clade co-circulating from late September onwards with limited isolation outside of Jordan.8
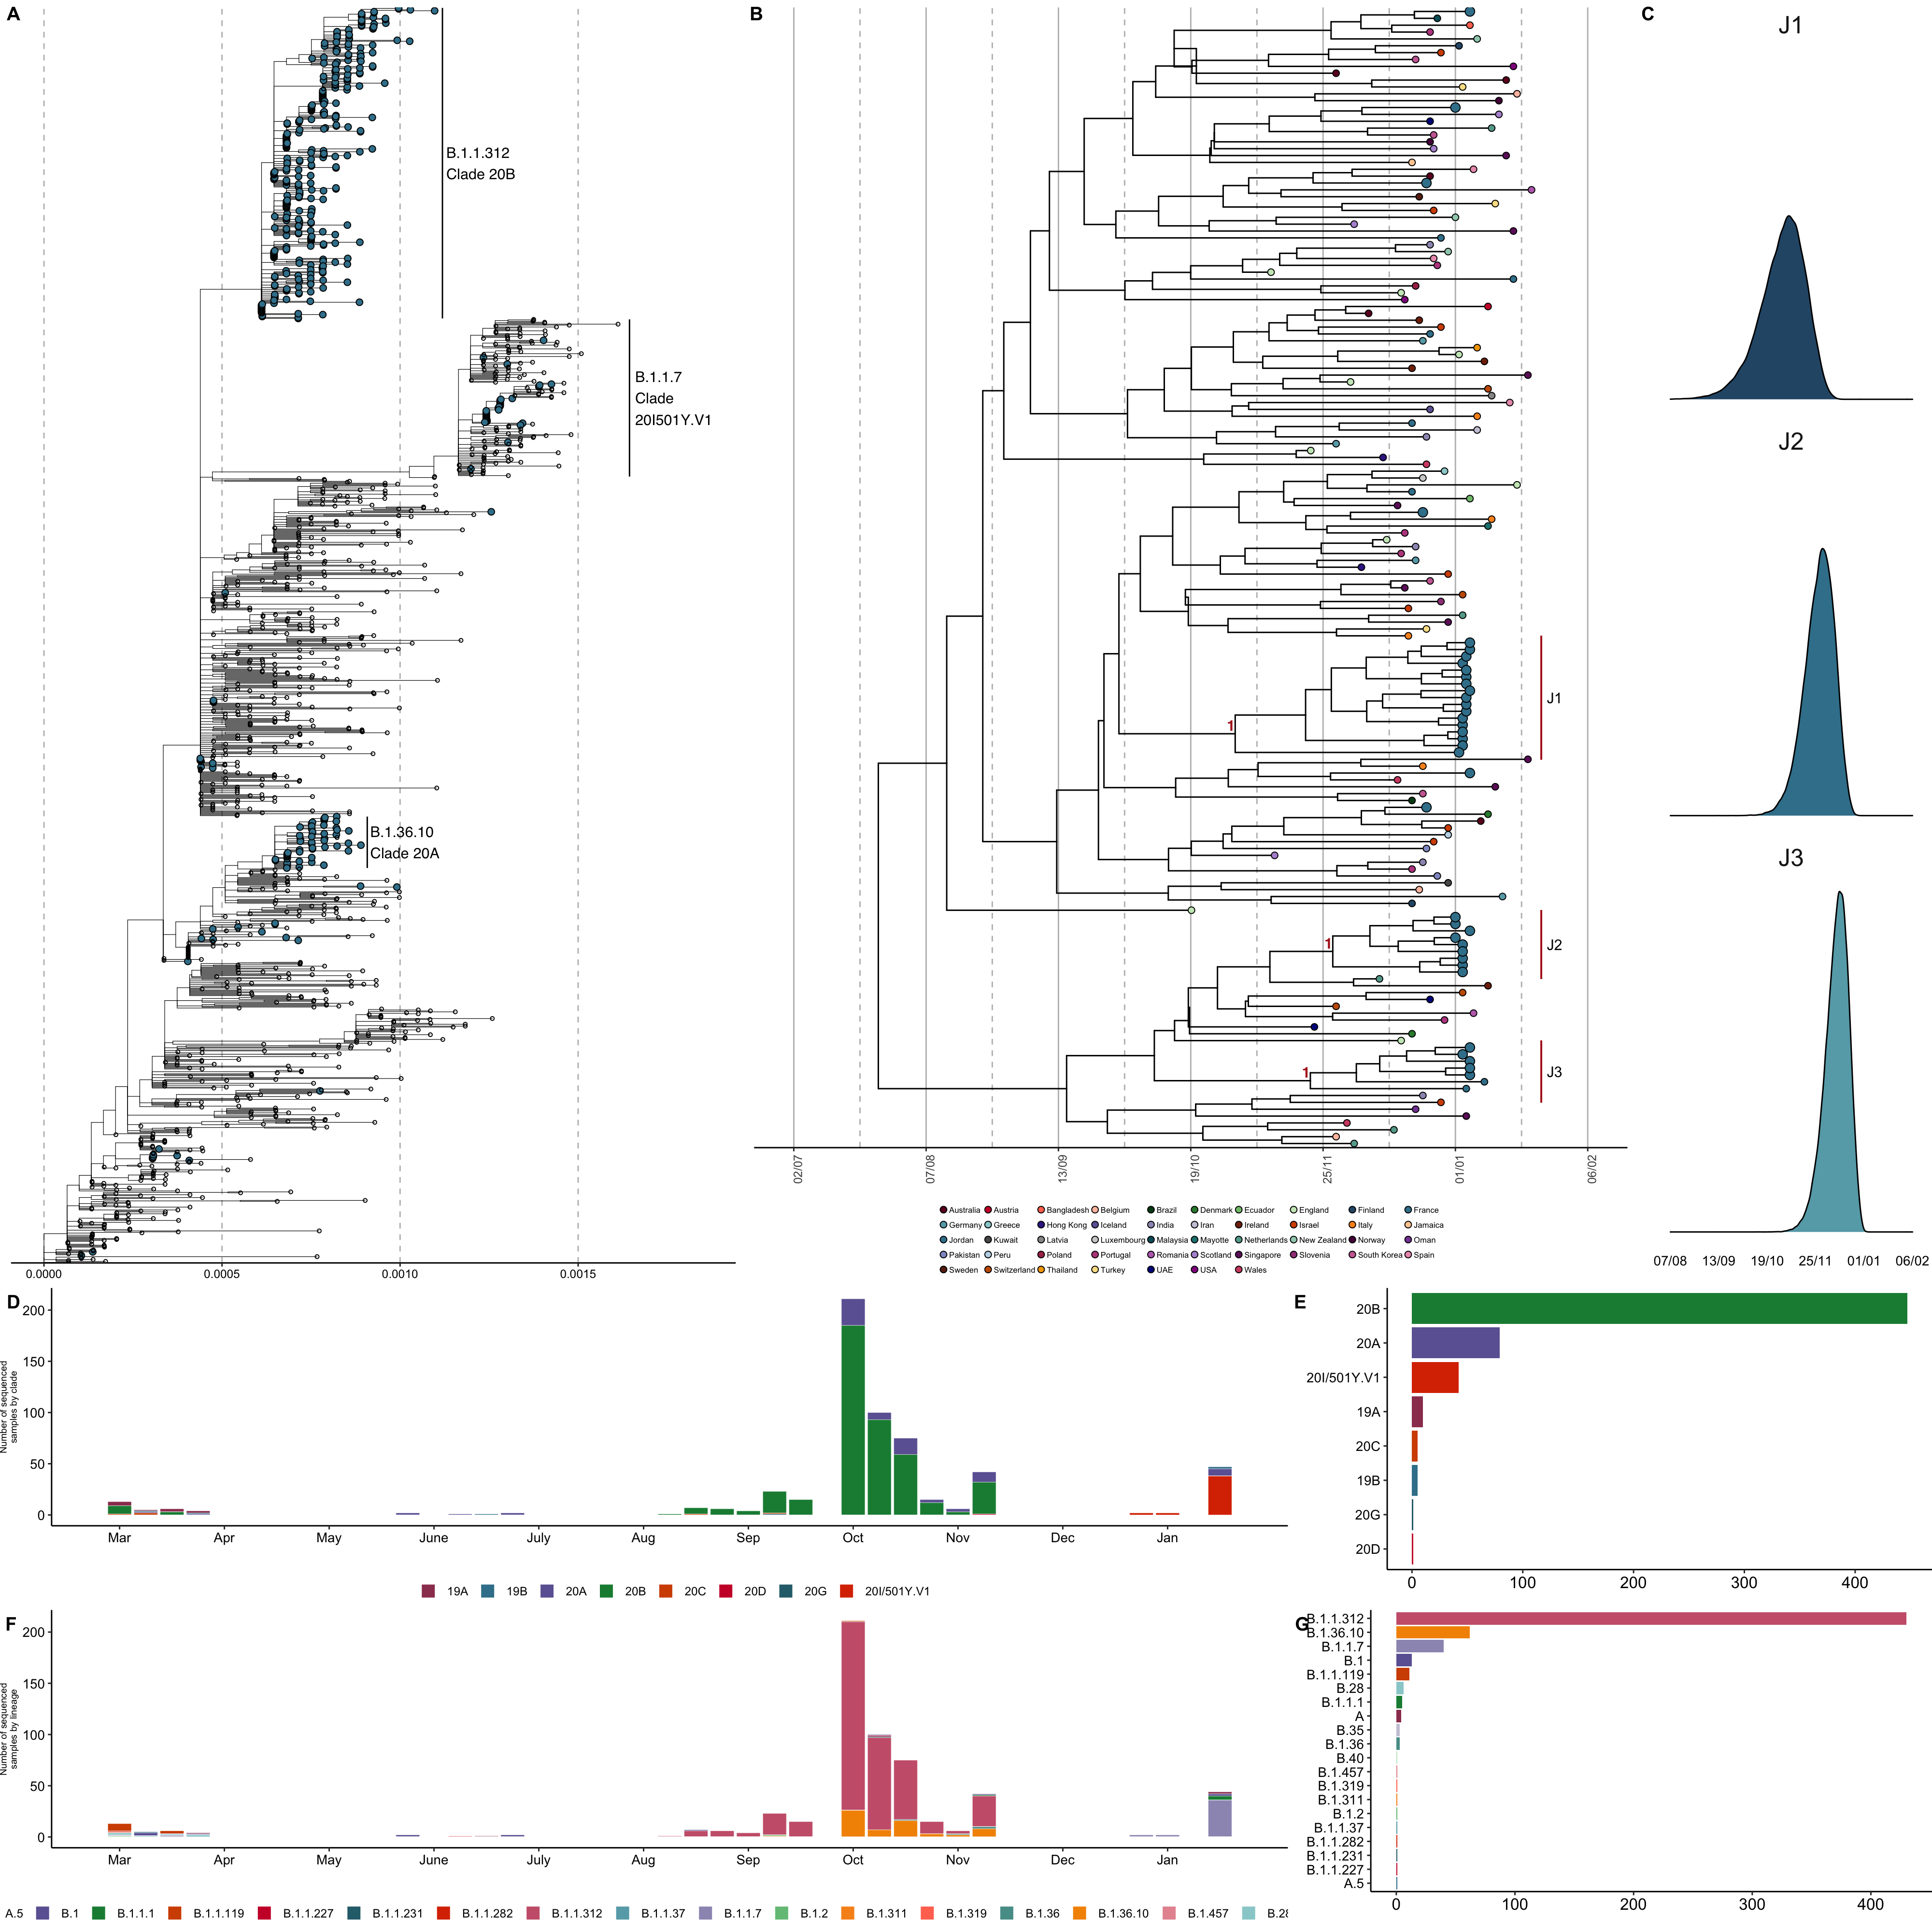
Figure 3: A) Maximum-likelihood phylogeny of the focal sequences sampled from Jordan in the context of the global circulating diversity. Sequences sampled from Jordan annotated in blue and emphasized, major circulating clades annotated in text. B) Maximum clade credibility tree of the time-resolved B.1.1.7 lineage within the context of globally representative sequences, as per the phylogeny in 1A. Tree tips annotated by country of isolation. Sequences sampled from Jordan annotated in blue and emphasized. Posterior of clades J1-3 indicated in red. C) The tMRCA of each of the Jordan clades highlighted in B. D) Number of sampled sequences per epiweek as designated by Nextstrain clade designation. E) Total number of sequences isolated in Jordan by Nextstrain clade designation8. F) Number of sampled sequences per epiweek as designated by Pangolin lineage designation.9 G) Total number of sequences isolated in Jordan by Pangolin lineage designation.
The proportion of SGTF in positive tests increased rapidly from late December onwards (Figure 1E). We investigated the growth rate of B.1.1.7 in Jordan with a logistic growth model fitted to the observed SGTF frequency sampled over time (Figure 1E). B.1.1.7 increased at a rate of 12% per day, higher than with rates estimated for other countries including the USA (approximately 7.5% per day), Portugal (10% per day), Denmark (10.3% per day) and the UK (10.4% per day).1,10–12 This rate corresponds to a doubling time of approximately 6 days (95% CI 5.5 - 6.6 days), with an estimated increased transmission rate of 53-63%, assuming a generation time of 5 days.2 B.1.1.7 became the dominant circulating lineage (proportion SGTF > 0.5 of all tests) in Jordan within 30 days of first SGTF detection, though it was circulating cryptically in the months prior to local confirmation as well as identification in the UK (see below, Figure 3B).The explosive growth of B.1.1.7 was reflected in the epidemic trajectory towards the end of January, with an increase in reported daily new cases and a concurrent increase of the effective reproductive number to above 1 towards late January (Figure 1 A, B).
We combined the 36 B.1.1.7 genomes from Jordan with a representative subset of 129 globally-sampled B.1.1.7 sequences to estimate the number and timing of introductions of B.1.1.7 into Jordan (see Methods). We reconstructed a time-resolved phylogeny using a Bayesian phylogenetic framework under a strict clock model and an exponential coalescent model with BEAST1.10.13 Only one Jordanian B.1.1.7 sequence was sampled outside of Amman (in Zarqa), with no additional data to resolve the within-Jordan spatial dynamics. The majority of the sequences cluster into three clades representing at least three independent introductions of B.1.1.7 into Jordan, with onward community transmission (Figure 3B, posterior=1 for J1-3). The largest clade (J1) represents the earliest introduction, with a median time of the most recent common ancestor (TMRCA) on 31 October 2020 [95% HPD 26 September to 27 November] (Figure 3C). Clade J2 and J3 have median TMRCAs on 27 November [95% HPD 5 November to 18 December] and 11 December [95% HPD 23 November to 27 December] respectively (Figure 3C). Additionally, there are singletons (single sequences) interspersed with the global population throughout the subtree, representing at least six additional independent international introductions with median TMRCAs in mid-to-late November to mid-December. The number of importations is likely a severe underestimate owing to the small fraction of sequenced samples in Jordan, with only 0.18% of reported cases sequenced.14 The timings of these introductions are concurrent with re-initiation of regular international flights and opening of regional borders, though travel history data is lacking for all samples (Figure 2). The uncertainty in the tree topology for the clades of interests and the sampling bias in the underlying genomic dataset currently limits reliable inference of the origin of these introductions .
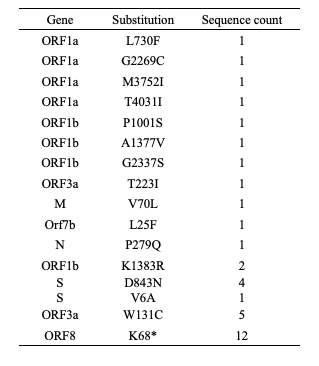
The Jordan-sampled B.1.1.7 sequences contained all of the lineage-defining substitutions, with no detection of the lineage-defining substitutions of P.1 or B.1.351, including E484K, K417N and K417T.4,15,16 There were a number of additional substitutions (Table 1), including a cluster of sequences with a stop codon in ORF8 at position 68.4 Four sequences contained the D843N substitution in the spike gene, which has been detected in 32 sequences globally across 5 lineages.17
Table 1: Additional mutations in lineage B.1.1.7 sequences sampled from Jordan
Discussion
Accurate prevalence estimates of B.1.1.7 in Jordan is complicated by both the sampling rate and biases, with sampling performed unsystematically on routine diagnostics samples rather than through national surveillance programs as in the UK and Denmark. It is important to note that samples from December onwards were screened for SGTF and sequenced diversity therefore does not represent true circulating diversity. No inference on lineage displacement can therefore be made with the current dataset.
It is now known that the Δ69-70 deletion has arisen independently in other lineages and is therefore not specific to B.1.1.7.18 It is therefore important to note that 36 of the 40 (90%) SGTF samples from Jordan were confirmed as B1.1.7 by sequencing. The four non-B.1.1.7 SGTF were identified as lineage B.1.1.1. Additionally, two SGTF samples originating from Biolab Laboratories in Jordan were sequenced by the Princess Haya Biotechnology Center of Jordan University of Science & Technology and confirmed as lineage A. The proportion of SGTF therefore acts as a reasonable proxy for B.1.1.7 (90% of SGTF is B.1.1.7), until further SGTF sequencing is performed to establish a true positive rate. Across England >99% of Δ69-70 sequences were confirmed to be B1.1.7 as of 21 December, though the utility of SGTF is likely to vary spatiotemporally based on circulating non-B.1.1.7 Δ69-70 lineages.19 However, the rapid increases of SGTF frequency similar to what was observed in the UK, Denmark and the US renders it more probable that the proportion of SGTF in positive tests reflects the rapid growth of B.1.1.7 in Jordan in recent weeks.
Comprehensive genome sequencing and characterization of the complete transmission dynamics of the SARS-CoV-2 epidemic in Jordan to infer its global and regional connectedness is ongoing. With a larger number of sequences, we expect to capture a larger fraction of the genomic diversity of the epidemic allowing us to improve the accuracy of the estimates from phylodynamic analyses. However, it is clear from the epidemiological and genomic surveillance data that B.1.1.7 has rapidly emerged to dominance in Jordan, along with the relaxation of containment measures, accelerating a second epidemic wave after months of local control. Comprehensive non-pharmaceutical interventions are required to control the B.1.1.7-associated second epidemic wave and mitigate the pervasive consequences to morbidity and mortality while Jordan is still initiating its national vaccination program.
Methods:
S gene target failure (SGTF) screening
All positive samples were run on TaqPath COVID-19 PCR test from Thermo Fisher Scientific by Biolab’s molecular diagnostics department. SGTF samples (n=40) identified for sequencing had Ct values ranging from 10-32.
Sample sequencing and processing
Prior to the detection of SGTF, 5-10% of total positive samples from all cities in Jordan were randomly selected for sequencing per week. The Andersen lab at Scripps sequenced the 579 SARS-CoV-2 genomes as per the protocol detailed in 1 .
Phylogenetic analyses
A globally representative phylogeny was reconstructed with the focal sequences from Jordan as follows: The Audacity global tree and its associated sequence set hosted by GISAID was downloaded for the full dataset up to 2 February 2021. All sequences with >5% Ns or a length <95% were discarded alongside sequences with incomplete dates and non-human isolates. Known problematic sites (GitHub - W-L/ProblematicSites_SARS-CoV2) were masked, and sequences were aligned to the reference (NC_045512.2) using minimap2 with the 5’ and 3’ UTRs masked.20 The focal sequences from Jordan were phylogenetically placed on the global tree with llama (GitHub - cov-lineages/llama: Local Lineage and Monophyly Assessment), with all identical sequences within a two node distance of the focal sequences retained. The backbone of the global phylogeny was retained as follows: the full global sequence dataset was grouped and downsampled by country and epidemiological week, with all sequences in groups below the 75th percentile of the global country-epiweek sampling distribution retained and sequences within groups exceeding the percentile randomly downsampled to the 90th percentile. A phylogeny was reconstructed from this sequence set using Fasttree 2.21 The globally representative phylogeny was further downsampled by root-to-tip tree-traversal, with all internal nodes subject to two rules: 1) if 95% of the leaves subtended by the internal node represented a single country or USA state, the earliest representative was retained 2) if leaves from the same location were separated by branch lengths <5x10⁻⁶, the earliest representative was retained. From this downsampled phylogeny, five representatives of all major Pangolin designated lineages (here defined as >100 sequences in this tree) were included in the final phylogeny alongside the focal sequences and their retrieved subtrees. A maximum-likelihood phylogeny was reconstructed for this dataset with automatic modelfinding in IQTREE.22
We performed two phylogenetic analyses using BEASTv1.10.13 The first included all sequences sampled in Jordan and was inferred under an HKY+G four category substitution model, a relaxed molecular clock with a log normal prior distribution and a Skygrid coalescent model with a grid point per epidemiological week13, 23. Two chains of 200 million generations were run, sampling every 20000 steps and discarding the first 10% as burn-in. Convergence assessment and demographic reconstruction was performed in Tracer (ESS >200).24 A second time-resolved phylogeny was estimated for all B.1.1.7 sequences in the globally representative dataset (see above), under an HKY+G four category substitution model, a strict molecular clock with a log normal prior distribution and an exponential coalescent prior. Two independent chains were run for 50 million steps, discarding the first 10% as burn-in. All visualization was performed with ggplot and ggtree.25 The code and XMLs to process the analysis is available at: GitHub - Edyth-Parker/Jordan_B117.
Epidemiological analyses
A logistic growth model was fit to the proportion of SGTF tests overtime with the nls() function in R, assuming A generation time of 5-6.5 days per 2. Case count data was sourced from Outbreak.info (https://outbreak.info/). The effective reproduction number was estimated across time points from the reported daily case numbers using the Epinow2 package, assuming generation times and incubation periods as per 26 .
Acknowledgements
We would like to acknowledge Mohammad Ghneim from Biolab’s IT department for his valuable help in data extraction and cleansing, Areej Mathar and Hamza Abu-Azzam for spike mutations data entry, and Diala Haddadin for her effort collecting the raw data for the timeline of non-pharmaceutical public health interventions in Jordan published in the report. We would like to acknowledge all contributors to GISAID (acknowledgement table available at GitHub - Edyth-Parker/Jordan_B117).
- Washington, N. L. et al. Genomic epidemiology identifies emergence and rapid transmission of SARS-CoV-2 B.1.1.7 in the United States. medRxiv (2021). doi:10.1101/2021.02.06.21251159
- Volz, E. et al. Transmission of SARS-CoV-2 Lineage B.1.1.7 in England: Insights from linking epidemiological and genetic data. medRxiv 2020.12.30.20249034 (2021).
- O’toole, Á., Hill, V. & Et al. Tracking the international spread of SARS-CoV-2 lineages B.1.1.7 and B.1.351/501Y-V2.
- Rambaut, A. et al. Preliminary genomic characterisation of an emergent SARS-CoV-2 lineage in the UK defined by a novel set of spike mutations.
- Kissler, S. et al. Densely sampled viral trajectories suggest longer duration of acute infection with B.1.1.7 variant relative to non-B.1.1.7 SARS-CoV-2. https://dash.harvard.edu/bitstream/handle/1/37366884/B117Trajectories_10Feb2021.pdf?sequence=1&isAllowed=y (2021).
- Davies, N. G. et al. Increased hazard of death in community-tested cases of SARS-CoV-2 Variant of Concern 202012/01. medRxiv (2021). doi:10.1101/2021.02.01.21250959
- Alaa Abdel Latif, Karthik Gangavarapu, Emily Haag, Nate Matteson, Julia L. Mullen, Ginger Tsueng, Mark Zeller, Chunlei Wu, Andrew I. Su, Laura D. Hughes, Kristian G. Andersen, and the C. for V. S. B. B.1.1.312 Lineage Report: outbreak.info.
- Alaa Abdel Latif, Karthik Gangavarapu, Emily Haag, Nate Matteson, Julia L. Mullen, Ginger Tsueng, Mark Zeller, Chunlei Wu, Andrew I. Su, Laura D. Hughes, Kristian G. Andersen, and the C. for V. S. B. B.1.36.10 Lineage Report: outbreak.info.
- Rambaut, A. et al. A dynamic nomenclature proposal for SARS-CoV-2 lineages to assist genomic epidemiology. Nat. Microbiol. 5, 1403–1407 (2020).
- Borges. Tracking SARS-CoV-2 VOC 202012/01 (lineage B.1.1.7) dissemination in Portugal: insights from nationwide RT-PCR Spike gene drop out data. (2021).
- Institute, S. S. Statens Serums Institute Estimerede scenarier for udviklingen i cluster B.1.1.7 27.01.2021.
- Davies, N. G. et al. Estimated transmissibility and severity of novel SARS-CoV-2 Variant of Concern 202012/01 in England. medRxiv (2020). doi:10.1101/2020.12.24.20248822
- Suchard, M. A. et al. Bayesian phylogenetic and phylodynamic data integration using BEAST 1.10. Virus Evol. 4, 1–5 (2018).
- du Plessis, L. D. et al. Establishment & lineage dynamics of the SARS-CoV-2 epidemic in the UK. medRxiv 1–6 (2020). doi:10.1101/2020.10.23.20218446
- Nuno R. Faria et al. Genomic characterisation of an emergent SARS-CoV-2 lineage in Manaus: preliminary findings.
- Tegally, H. et al. Emergence and rapid spread of a new severe acute respiratory syndrome-related coronavirus 2 (SARS-CoV-2) lineage with multiple spike mutations in South Africa. medRxiv 2, (2020).
- Alaa Abdel Latif, Karthik Gangavarapu, Emily Haag, Nate Matteson, Julia L. Mullen, Ginger Tsueng, Mark Zeller, Chunlei Wu, Andrew I. Su, Laura D. Hughes, Kristian G. Andersen, and the C. for V. S. B. S:D843N Mutation Report:outbreak.info.
- Madewell, Z. J., Yang, Y., Jr, I. M. L., Halloran, M. E. & Dean, N. E. S gene dropout patterns in SARS-CoV-2 tests suggest spread of the H69del/V70del mutation in the US. medRxiv 1–13 (2020).
- Chand, M., Hopkins, S., Achison, C., Anderson, C., Allen, H., Blomquist, P., Chen, C., C. & V., Dabrera, G., Edeghere, O., et al. Investigation of novel SARS-CoV-2 variant Variant of Concern 202012/01 (Public Health England). (2021).
- Li, H. Minimap2: Pairwise alignment for nucleotide sequences. Bioinformatics 34, 3094–3100 (2018).
- Price, M. N., Dehal, P. S. & Arkin, A. P. FastTree 2 – Approximately Maximum-Likelihood Trees for Large Alignments. PLoS One 5, e9490 (2010).
- Nguyen, L.-T., Schmidt, H. A., von Haeseler, A. & Minh, B. Q. IQ-TREE: a fast and effective stochastic algorithm for estimating maximum-likelihood phylogenies. Mol. Biol. Evol. 32, 268–74 (2015).
- Gill, M. S. et al. Improving bayesian population dynamics inference: A coalescent-based model for multiple loci. Mol. Biol. Evol. 30, 713–724 (2013).
- Rambaut, A., Drummond, A. J., Xie, D., Baele, G. & Suchard, M. A. Posterior Summarization in Bayesian Phylogenetics Using Tracer 1.7. Syst. Biol. 67, 901–904 (2018).
- Yu, G., Smith, D. K., Zhu, H., Guan, Y. & Lam, T. T.-Y. ggtree : an r package for visualization and annotation of phylogenetic trees with their covariates and other associated data. Methods Ecol. Evol. 8, 28–36 (2017).
- Abbott, S. et al. Estimating the time-varying reproduction number of SARS-CoV-2 using national and subnational case counts. Wellcome Open Res. 5, 112 (2020).