Severe acute respiratory syndrome coronavirus 2 (SARS-CoV-2) belongs to the Betacoronavirus genus, responsible for spillover events in 2002 and 2012 (severe acute respiratory syndrome and Middle East respiratory syndrome, respectively). The zoonotic origins of these viruses (possibly bats, camelids, pangolins and/or palm civets) have received much attention. However, other evolutionary aspects, as spatial variation, have been comparatively neglected. SARS-CoV-2 has spread around the world in a very fast way. The effects this has had on the virus diversity are under investigation. Previous studies suggest viral genotypes are heterogeneously distributed (https://doi.org/10.1073/pnas.2004999117; A dynamic nomenclature proposal for SARS-CoV-2 to assist genomic epidemiology | bioRxiv).
When relatedness between spatially coexisting lineages is greater than expected by chance, their distribution is said to be phylogenetically structured. One of the consequences of structuring is spatially close sequences being more similar to each other than expected by chance, as explained in Figure 1 below.
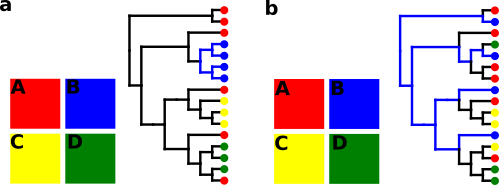
Figure 1. Toy structured (a) and random (b) distributions. The colored squares represent four hypothetical areas (A, B, C and D). Colored branches correspond to evolutionary distances between region B lineages. Notice the smaller distances in the spatially structured phylogeny.
Phylogenetic structuring can be assessed by comparing measured phylogenetic distances with those expected under no structuring, which can be accomplished by Monte Carlo simulations (https://doi.org/10.1146/annurev.ecolsys.33.010802.150448). We used this method to test for geographical structuring of ca. 9,000 SARS-CoV-2 genomes from America, Europe, Asia, Africa and Oceania. The following is a summary of some of the main results of the study. The full paper is available here.
Results
Virotypes identification and distribution. Structure analyzes require determining the abundance patterns of a set of operational taxonomic units (OTUs). Viral OTUs, which we call virotypes, were defined as sets of genomes that presented k-mer distances of zero from each other. We identified 5,305 such clusters among 8,612 high-quality genomes from around the world. The most abundant virotype was represented by 223 sequences. Five virotypes presented more than 100 sequences each, 12 presented at least 50 sequences and 695 presented between 2 and 50 sequences. The rest of virotypes were singletons.
The virotypes geographical distribution was very uneven and some regions presented more endemisms than others. The complete analysis is detailed in Table S4 of the full paper. Here we highlight some outstanding results as an example. Of the virotypes represented by at least 10 sequences, only 6 were distributed more or less homogeneously. The most abundant virotype displayed a greater than expected abundance in North America and was under-represented in Europe and Asia. Fifteen virotypes were over-represented in North America and another 15 in Europe. Five and 3 virotypes were over-abundant in Asia and Oceania, respectively, and one virotype was too abundant int both Asia and Oceania. Africa shared 4 virotypes with Europe, 2 with Europe and South America 1 with Europe and Oceania and 1 with North America. The remaining 44 virotypes in Africa were endemic. In contrast, the virotypes in South America were predominantly cosmopolitan. Four of them were also detected in Asia, Europe, North America and Oceania, 3 were shared with Europe and North America and 2 were also observed in Africa and Europe. One of the virotypes present in South America was also present in Asia, North America and Oceania, a second one was also detected in Asia, Europe and Oceania and a third one was shared with Europe and Oceania. Two of the South American virotypes were also represented among the North American and European sequences.
SARS-CoV-2 spatial phylogenetic structure. Sequences representative of the 5,305 virotypes identified here were aligned by Mafft and analyzed phylogenetically with the double-precision version of FastTree. A thorough visual inspection of the obtained phylogeny revealed six major sections of the tree in which the virotypes were clumped according to their origins. For practical reasons, we refer to these sections as A, B, C, D, E, and F.
Below, a figure is displayed depicting the distribution in the tree of the virotypes present in North America, which clustered preferentially in sections A and D.
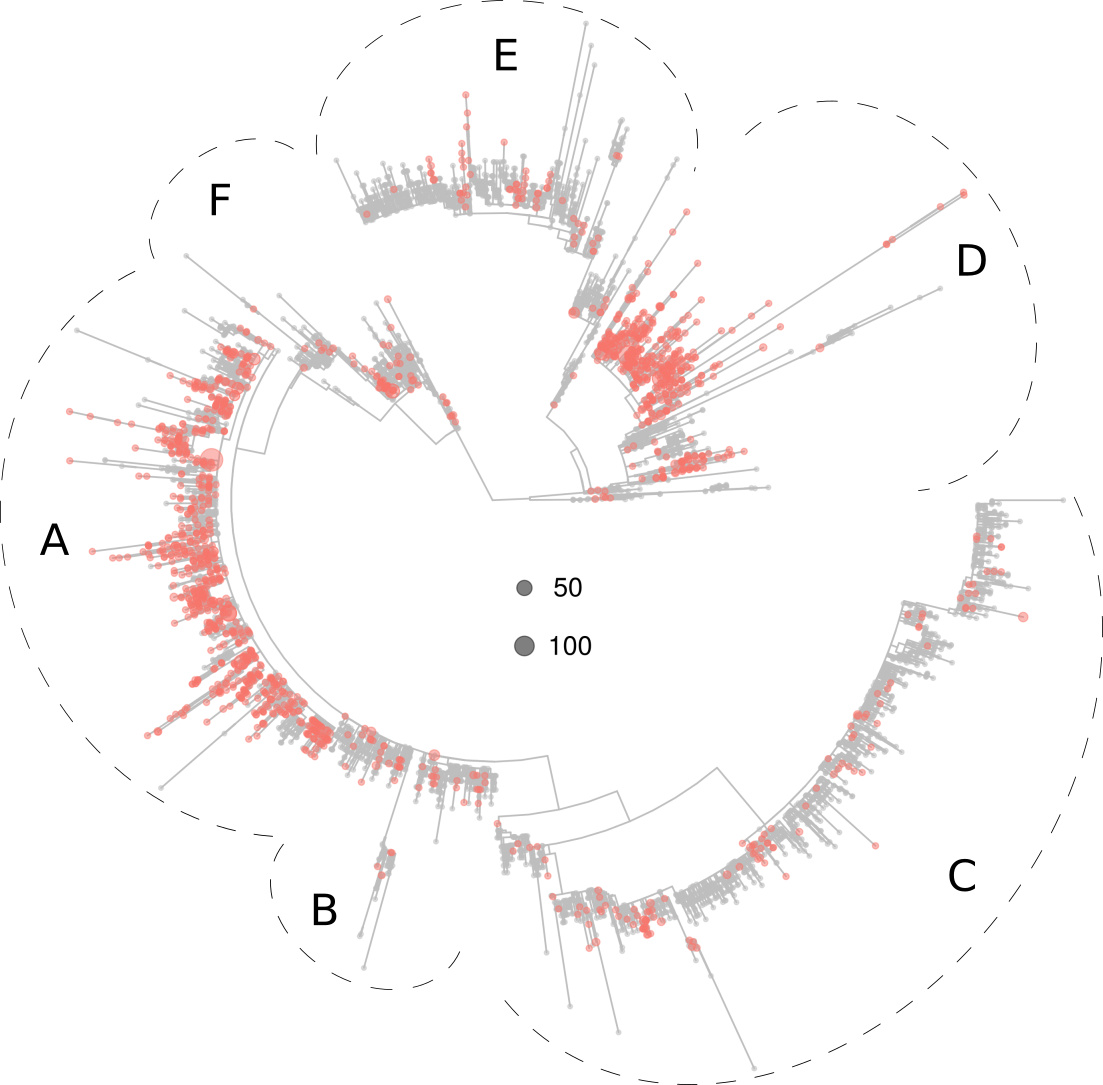
Figure 2. Phylogeny of 5,305 SARS-CoV-2 virotypes representative of 8,612 genomes from around the world. The virotypes present in North America are highlighted in red. Dots diameters are proportional to the number of genomes accrued in each virotype, as indicated in the center of the figure.
The European virotypes were much represented in tree sections B, C, E and F, and moderately represented in section A (Fig. 3).

Figure 3. Phylogeny of 5,305 SARS-CoV-2 virotypes representative of 8,612 genomes from around the world. The virotypes in Europe are highlighted in red. Dots diameters are proportional to the number of genomes accrued in each virotype, as indicated in the center of the figure.
The Asian virotypes clustered preferentially in sections D, E and F but in proximal branches relative to the positions occupied by the North American (region D) and European (regions E and F) virotypes:
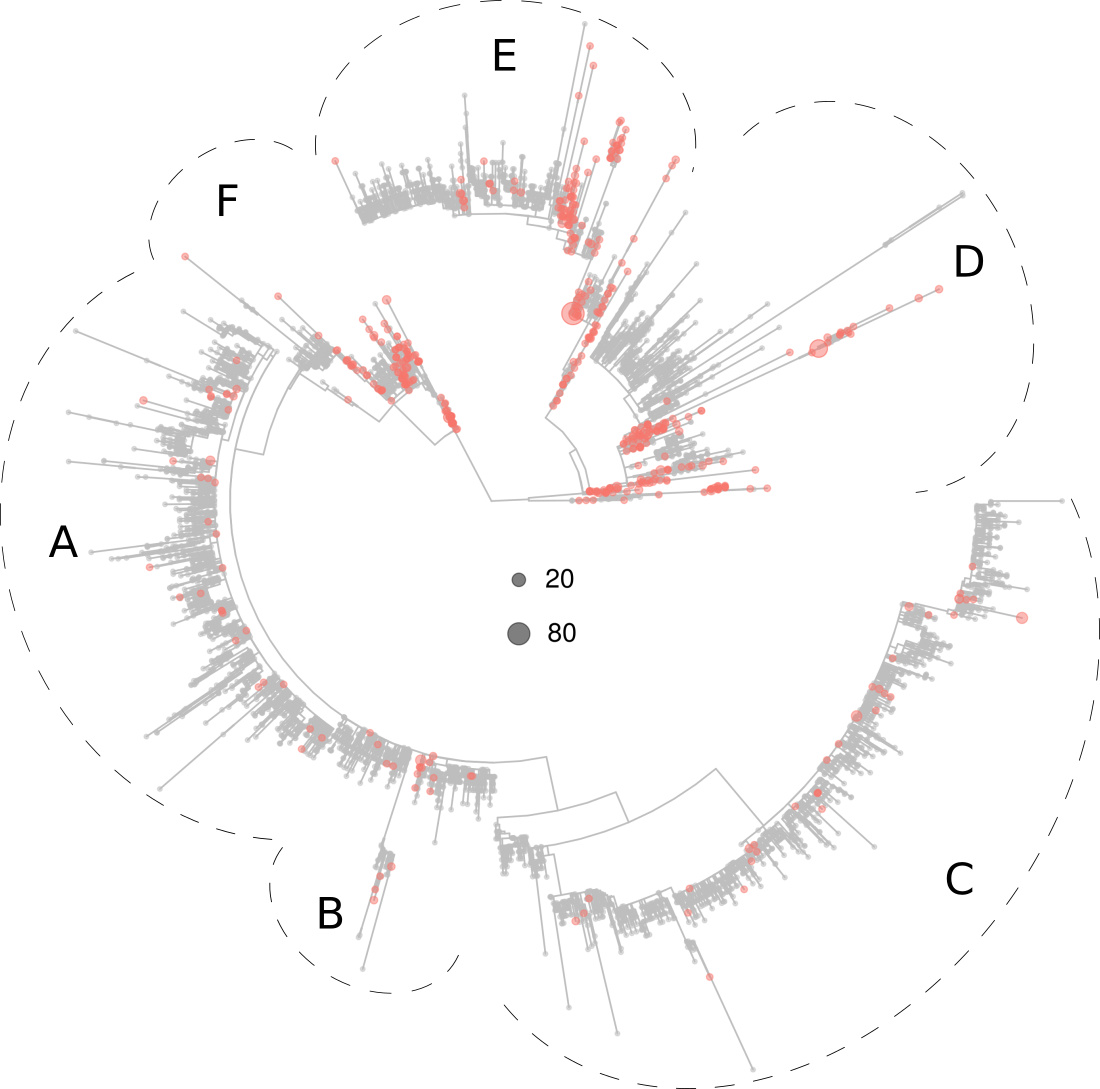
Figure 4. Phylogeny of 5,305 SARS-CoV-2 virotypes representative of 8,612 genomes from around the world. The virotypes present in Asia are highlighted in red. Dots diameters are proportional to the number of genomes accrued in each virotype, as indicated in the center of the figure.
Many of the virotypes in Africa were clustered in a relatively well supported branch (please see Fig. S2 of the full manuscript). Conversely, the virotypes present in South America (Fig. S2) and Oceania (Fig. 5 below) were scattered all across the tree.

Figure 5. Phylogeny of 5,305 SARS-CoV-2 virotypes representative of 8,612 genomes from around the world. The virotypes present in Oceania are highlighted in red. Dots diameters are proportional to the number of genomes accrued in each virotype, as indicated in the center of the figure.
Numerical structure analyses were performed by the picante package. Null distributions were inferred by shuffling virotypes across tree tips 10,000 times. Using the obtained permutations and the actual data, the following weighted metric was calculated for each region:
SESMPD = (MPDOBS – mean(MPDH0)) / sd(MPDH0),
where MPDOBS is the mean phylogenetic distance (MPD) between all sequences from the region, mean(MPDH0) is the average MPD between the sequences from the region in the randomized data, and sd(MPDH0) is the corresponding standard deviation. Negative and low SESMPD values support structured distributions. Significance levels were calculated as the MPDOBS rank divided by the number of permutations minus one.
As detailed in Table 1 below, limitation in space was significant for Africa, Europe and North America.
Table 1. Numerical structure analysis.
| ntaxa1 | obs2 | rand.mean3 | rand.sd4 | obs.rank5 | SESMPD6 | p-value7 | |
|---|---|---|---|---|---|---|---|
| Africa | 53 | 0.00476 | 0.00744 | 0.00053 | 1 | -5.07282 | 0.0001 |
| Asia | 494 | 0.0074 | 0.00747 | 0.00046 | 4507 | -0.14996 | 0.45065 |
| Europe | 2747 | 0.00671 | 0.00757 | 0.00019 | 1 | -4.57045 | 0.0001 |
| North America | 1479 | 0.00623 | 0.00753 | 0.00032 | 1 | -3.99469 | 0.0001 |
| Oceania | 657 | 0.00769 | 0.00757 | 0.00021 | 6973 | 0.53542 | 0.69723 |
| South America | 39 | 0.00683 | 0.00731 | 0.00072 | 2336 | -0.67678 | 0.23358 |
| 1 Number of virotypes from each region. | |||||||
| 2 Observed Mean Phylogenetic Distances (MPD). | |||||||
| 3 Average MPD in Monte Carlo (M-C) randomizations. | |||||||
| 4 Standard deviation of M-C MPDs. | |||||||
| 5 Observed MPD ranks. | |||||||
| 6 Standardized effect of geographical structure. | |||||||
| 7 H0 : virotypes distributed randomly. | |||||||
Discussion
Biogeographical patterns have been previously observed in other Betacoronavirus and very different viruses as phages and retroviruses. That SARS-CoV-2 has developed a biogeography despite its high propagation rate may seem contradictory. However, spatial diversification depends not only on dispersion constraints but also on evolutionary rates. In particular, spatially structured phylogenies can be the consequence of speciation rates being very high relative to dispersion rates. As far as we know, travels between remote places constitute the only dispersal mechanism of SARS-CoV-2. This implies that founder viruses usually carry very small fractions of the total genetic variation of the source populations. Therefore, each time the virus spreads, substantial losses of diversity can occur, possibly combined with rare mutations settlement, due to founder effects. In addition, it stands to reason that, after dispersal, mutations accumulate quickly as the newly established population enlarges. Some of these mutations can lead to novel virotypes, as strongly suggested by the here presented results. Based on these considerations, it is reasonable to hypothesize that long-distance dispersal constitute an opportunity for the virus to fix otherwise rare, and/or develop new, mutations.
It has been shown that slight mutations can produce significant phenotypic effects in MERS-CoV and other coronaviruses. On the other hand, the 2002-2003 SARS-CoV epidemic was subdivided into three genetically different phases, suggesting that sarbecoviruses can mutate recurrently along relatively short periods of time. Furthermore, recent evidence (https://doi.org/10.1128/JVI.00411-20) suggests that SARS-CoV-2 can tolerate non-synonymous mutations at the nsp1 and accessory ORFs, which in other coronaviruses are related to immune modulation and viral evasion. Thus, the here presented results must be taken as a call for attention. The virus evolution should continue to be monitored and relationships should be sought between viral diversity and pathogenesis.