May 24 update:
The continued spread of B.1.1.7 and the two identified novel lineages (columns 7 and 10 in Fig. 3 above; hereafter, B.1.1.v1 and B.1.1.v2) between February-April 2021 is confirmed by community-based PCR testing. To obtain independent frequency estimates, we made use of a PCR system sensitive to the presence of nsp6:Δ106-108 and S:Δ69-70 deletions to detect these variants. Specifically, S:Δ69-70+ nsp6:Δ106-108+ samples correspond to B.1.1.7, while S:Δ69-70- nsp6:Δ106-108+ samples correspond to either the B.1.1.v1 or the B.1.1.v2 variant (Fig. 4 above).
Community-based PCR were performed for 739 samples obtained between February-April, 2021. We further analysed only those samples for which both tests were performed and produced unambiguous results. There were 269 such samples from 22 regions (including 170 from Saint Petersburg, 43 from Sverdlovsk Oblast, and 12 from Leningrad Oblast). For S:Δ69-70 detection, we used the Yale69/70del RT-PCR assay described elsewhere. For nsp6:Δ106-108 detection, we used a newly designed RT-PCR assay. 133 of these 269 samples were also sequenced (sequence data made available through GISAID); for 126 of them (94.7%), the results on the presence of S:Δ69-70 and nsp6:Δ106-108 were consistent between the NGS and PCR data, indicating that our PCR tests are highly specific.
While the frequency estimates were highly uncertain (Table 1), they indicate that B.1.1.7, and one or both of variants B.1.1.v1 and B.1.1.v2, were wide-spread in April (Fig. 9, Table 1). A considerable fraction of PCR samples from February and March were included in our main analysis, as their sequences were in GISAID. However, the frequency increase was also observed in the 136 PCR samples for which no sequencing data was available, providing independent validation for the NGS results. Similarly, it was observed when the PCR tests only for St. Petersburg were analysed (Fig. 10, 11), indicating that the prevalence of these variants increases at least in this city as opposed to being an artefact of changing sampling between regions.
Figure 9. Frequencies of S: Δ 69-70, nsp6: Δ 106-108, and their combination in Russia in Feb-Apr 2021 based on PCR data. S:Δ69-70+ nsp6:Δ106-108+ samples correspond to B.1.1.7, and S:Δ69-70- nsp6:Δ106-108+ samples correspond to B.1.1.v1 or B.1.1.v2. The rare instances of S:Δ69-70+ nsp6:Δ106-108- probably correspond to false positive S:Δ69-70 detection. Notations for logistic curves are the same as in Fig. 6.
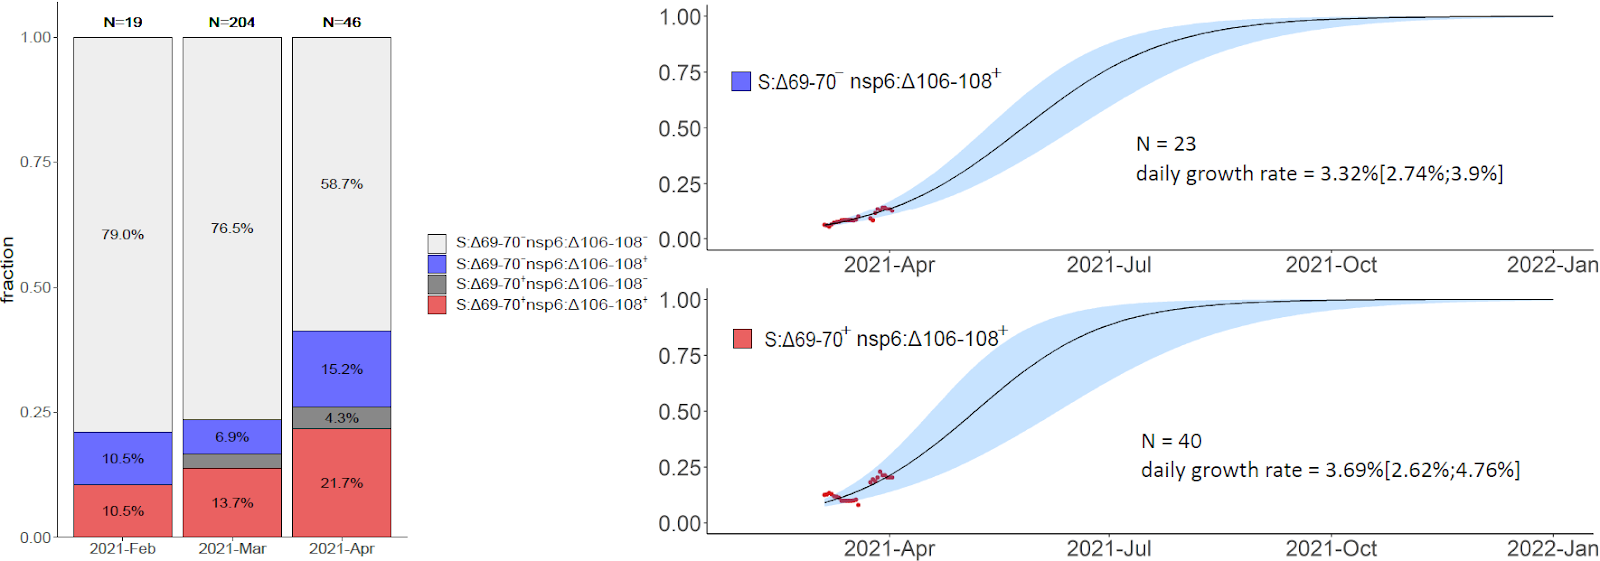
Table 1. Frequencies of (B.1.1.v1 or B.1.1.v2) and B.1.1.7 estimated from PCR data. The point estimate and the 95% confidence intervals (Wilson score intervals) are shown.
| 2021-Feb | 2021-Mar | 2021-Apr | |
|---|---|---|---|
| nsp6:Δ106-108+ S:Δ69-70- (B.1.1.v1 or B.1.1.v2) | 10.5% (2.3%-31.4%) | 6.9% (4.1%-11.2%) | 15.2% (7.6%-28.2%) |
| nsp6:Δ106-108+ S:Δ69-70+ (B.1.1.7) | 10.5% (2.9%-31.4%) | 13.7% (9.7%-19.1%) | 21.7% (12.3%-35.6%) |
Fig. 10. Frequencies of S: Δ 69-70, nsp6: Δ 106-108, and their combination in Saint Petersburg in Feb-Apr 2021 based on the PCR data.

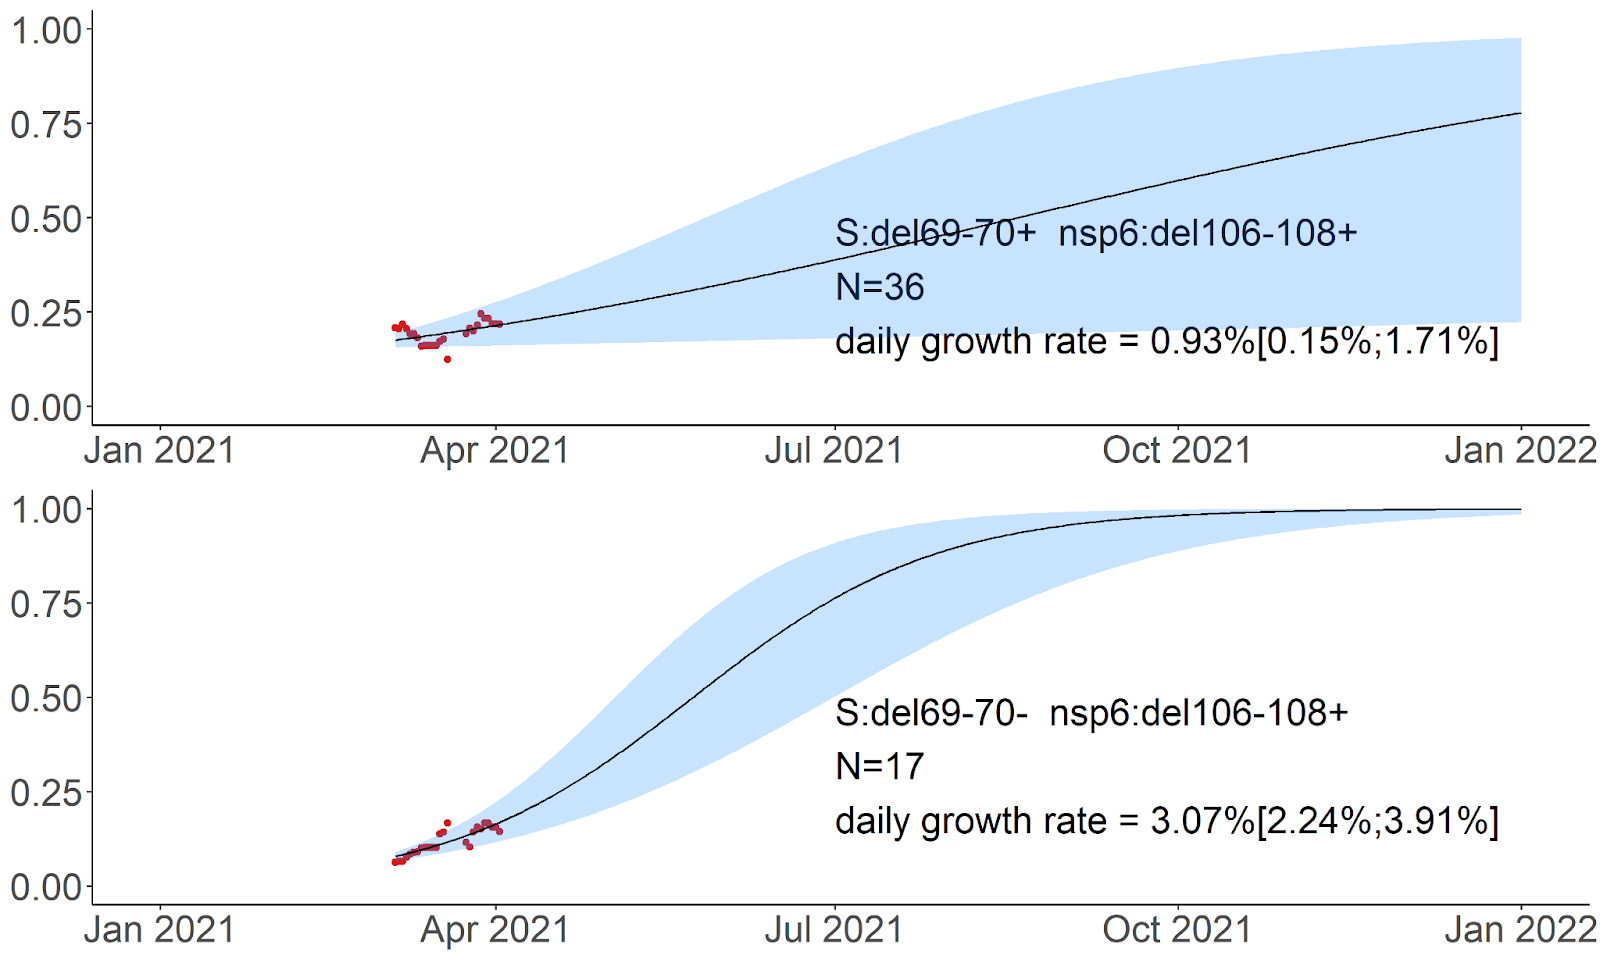
Fig. 11. Logistic growth model for nsp6: Δ 106-108 with and without S: Δ 69-70 in Saint Petersburg in Feb-Apr 2021 based on PCR data. Notations are the same as in Fig. 5.