Materials and Methods
Mobile device data insights: We use anonymised and aggregated mobile data insights collected from the network operator, O2. The data is extrapolated to give a picture of movement trends of the UK population over the age of 12 and includes trips using all transport and purpose modes. All trips were allocated to ‘Local Authority Districts’ (LADs) (https://geoportal.statistics.gov.uk/datasets/local-authority-districts-december-2019-boundaries-uk-bfc) based on cell tower overlaps. Data also includes Scotland, Wales, and Northern Ireland. Trips are recorded when a mobile device connects from one mobile cell mast to the next, non overlapping, cell mast. This means that some shorter trips may not be included. Further the size of the cells may vary depending on the population density of the region. The trips shown in this manuscript represent the average number of trips per weekday (Mon – Thu) in February 2020 between Kent and London and other LADs in the UK. For analyses that are performed at the UTLA level we aggregate movements from LAD level to UTLA using a standard conversion: Open Geography Portal. Removing Hampshire when estimating the association between movements from Kent and London and B.1.1.7 detection (Figure 1d) results in only minor changes to the correlation coefficient (Pearson’s r = -0.67, CI -0.53 : -0.78, p < 0.001). It must be noted the analysis of the data insights was only available for February 2020, and we were not able to estimate any more recent changes in movement that could be reflective of changes of behaviour, including lockdowns, or more recently due to holiday travel.
Epidemiological data: Daily new cases by specimen date were downloaded from https://coronavirus.data.gov.uk/details/download. Data was last accessed on January 10th, 2020.
Genomic data: Sequences were aligned as part of the grapevine pipeline (GitHub - COG-UK/grapevine: Process consensus file for COG-UK data) which processes COG and GISAID data every day. From this master alignment, sequences with no reference alleles, and more than 5 of the 17 defining mutations (and therefore 12 or fewer ambiguous alleles at key sites) and their corresponding cleaned date and location metadata were extracted. The list of mutations are described in detail here: https://pando.tools/t/preliminary-genomic-characterisation-of-an-emergent-sars-cov-2-lineage-in-the-uk-defined-by-a-novel-set-of-spike-mutations/563
Metadata: The location data for sequences is cleaned as part of the grapevine pipeline (GitHub - COG-UK/grapevine: Process consensus file for COG-UK data). Custom Python scripts were used to match UTLAs and LADs to adm2 and adm3 regions from the Global Administrative Database (GADM) for mapping and analysis.
Line list data cleaning: There were multiple entries of the same unique identifiers in the SGTF test results, which prevented directly mapping the SGTF test results to the full line list (where the unique identifiers are truly unique). Specifically, there were 50,357 “individuals” with multiple test results, of which 48,599 had the same result, i.e., they were both negative or both positive, and could be readily merged with the full line list. However, 1,758 did not match, e.g., one result was positive and the other negative, and these cases were subsequently excluded from all analyses. The total excluded cases were <0.15% of the total unique individuals that tested positive and were present in the dataset.
Estimate of case growth rate: To estimate the epidemic growth rates in each county, we fit a mixed effects GLM of log new daily case counts in overlapping, three-day windows (fixed effect) and a random effect for each UTLA on the slope and intercept, using the R package lme4 v.1.1-21 (13). Daily case counts were determined using the date of specimen collection. Qualitatively similar results were obtained by estimating the epidemic doubling time across each county using mixed-effects Poisson and negative binomial GLMs. Where sequence locations were ambiguous, the case growth rate was averaged across the relevant areas for the analysis in Figure 2b.
Estimate drivers of transmission and increase in frequency of B.1.1.7 and SGTF: Mobility, case, and B.1.1.7/SGTF frequencies were aggregated up to each UTLA (which was often the finest-grained resolution present in the genome/testing/line list data). Briefly, using a Beta prior (0.1,1) on the proportion of the novel variant to account for sampling intensity, we estimated frequency using sampling data from pre-lockdown (prior to Nov. 5th), lockdown (Nov. 5st - Dec. 3rd), post-lockdown (Dec. 4th - Dec. 17th), and recent (after Dec. 17th). Following the first time period, when updating the posteriors, we take as priors the posteriors from the early period (down-weighted by 50% to prevent more recent data from being overwhelmed by earlier samples). To determine the relationship between these variables, we fit multi-GLM regressions to natural-log transformed data using base R. Model selection was used to confirm these results by exhaustive search with BIC in the R package glmulti v. 1.0.7.1.
Supplementary Figures
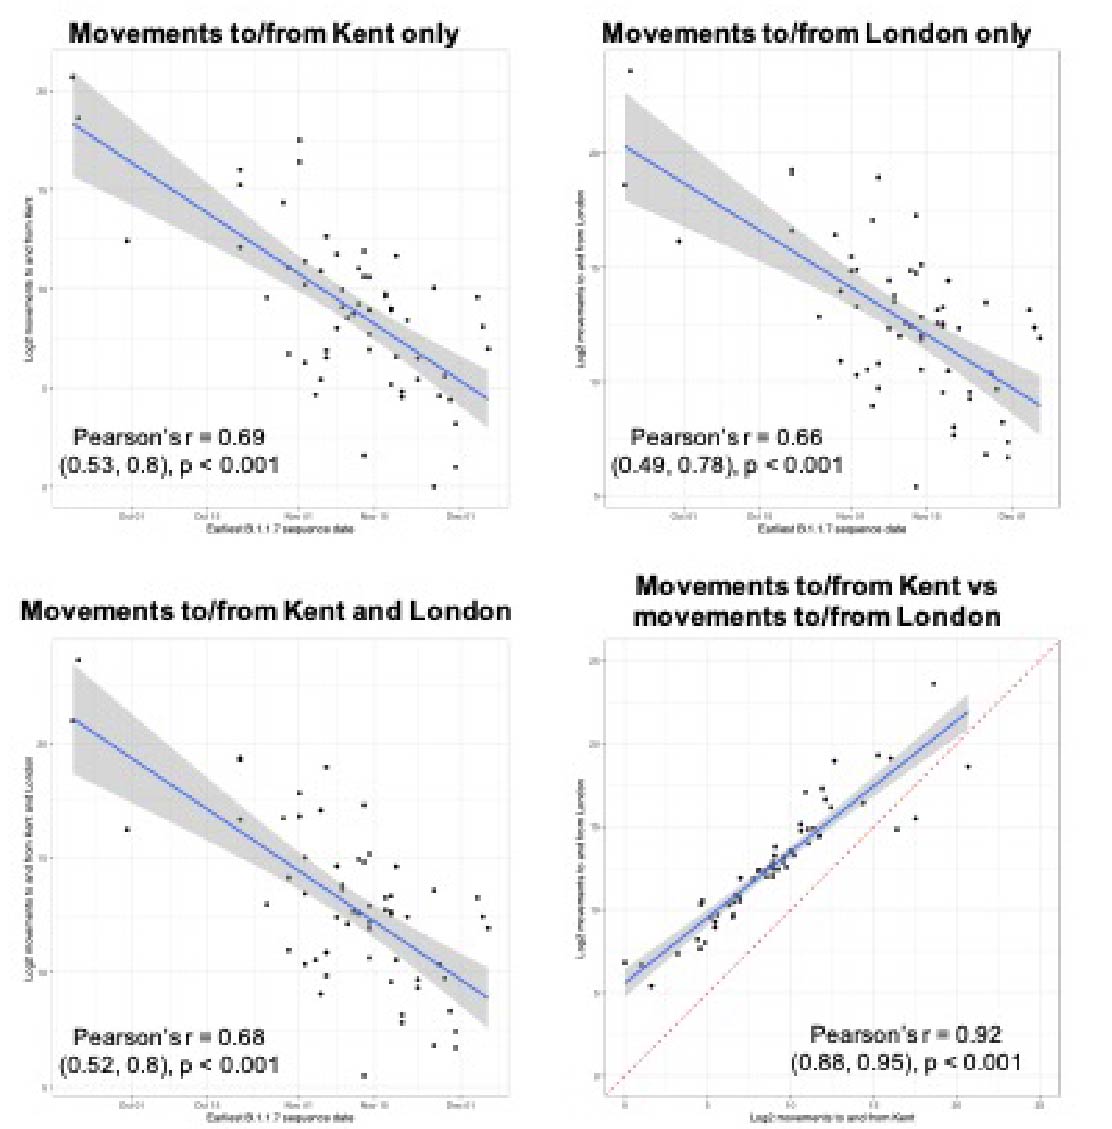
Figure S1: The plots show the correlation between detection date of B.1.1.7 in each UTLA and movements from London and/or Kent to that UTLA during February 2020. The correlations show that similar results are obtained for both Kent and London.
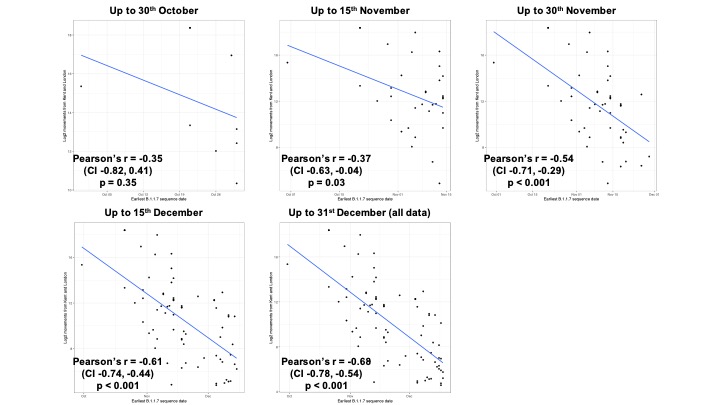
Figure S2: The change through time in the relationship between the date of detection of B.1.1.7 and mobility movements from Kent and London. Anonymised and aggregated data insights on human mobility is from February 2020 and does not change through time (see Materials and Methods).
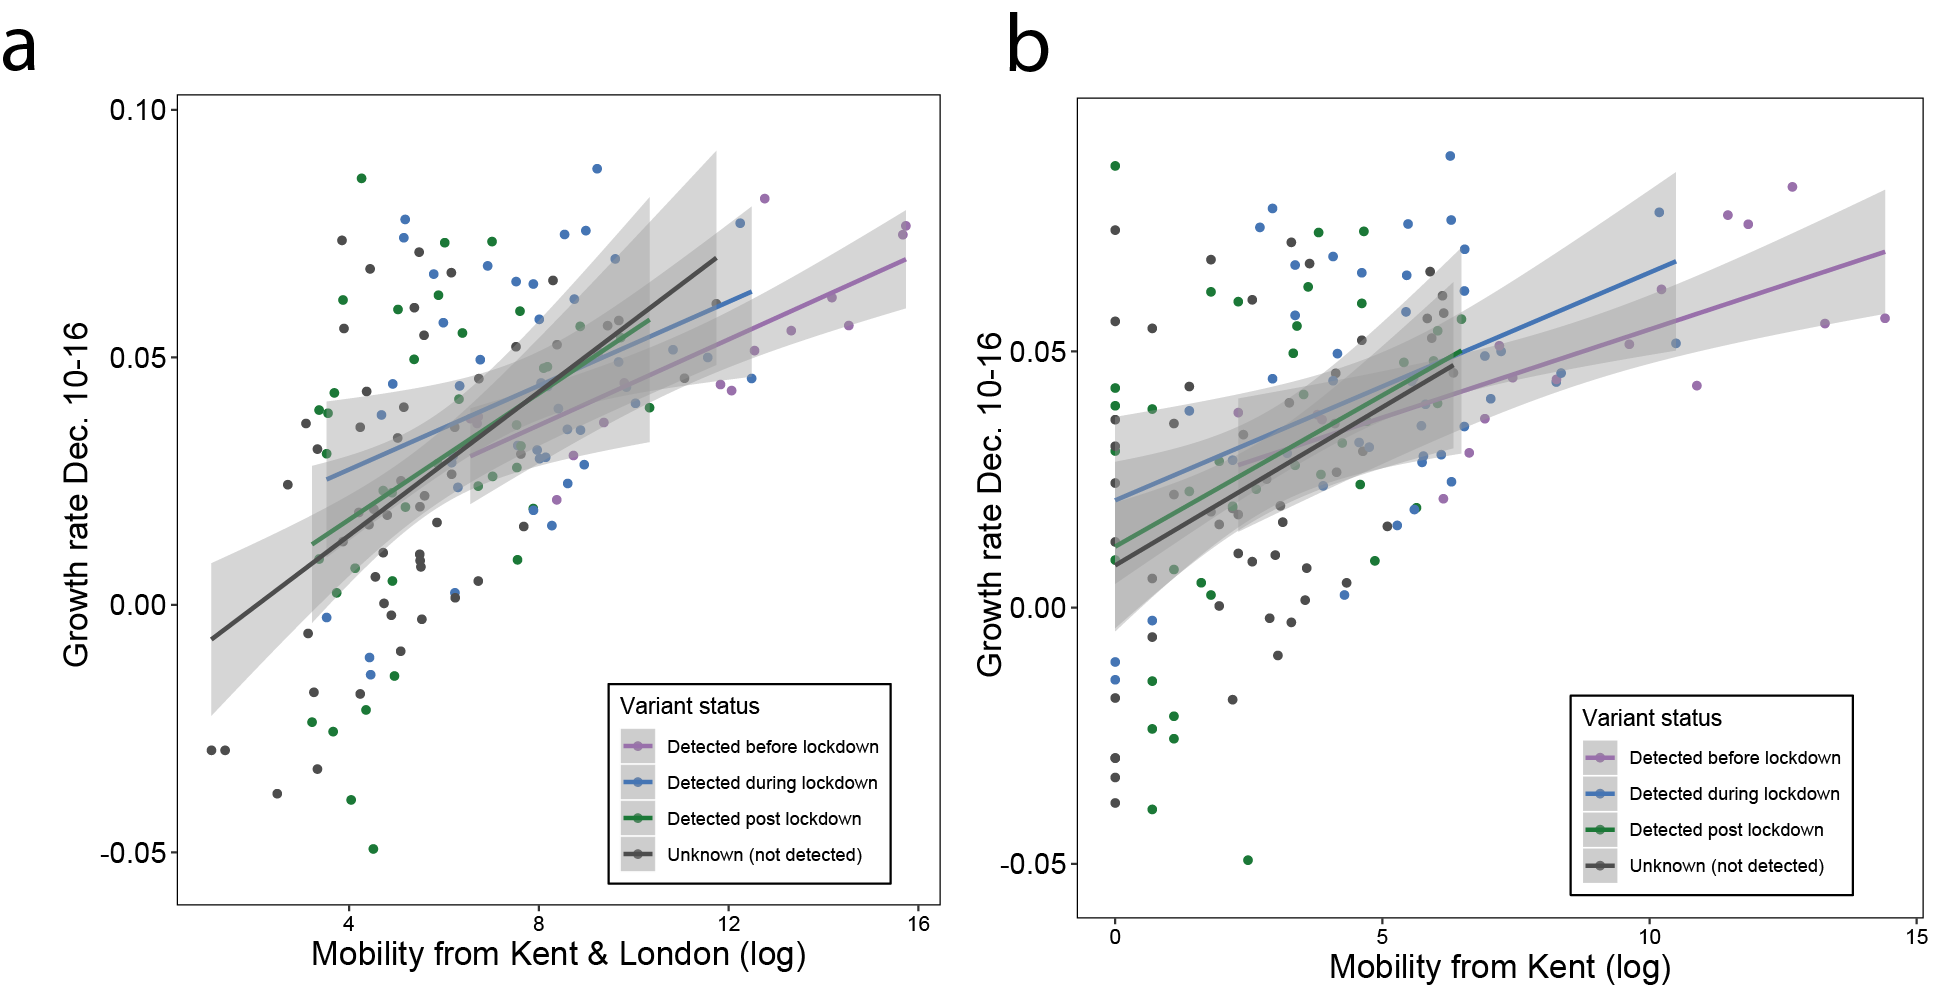
Figure S3: Median case growth rates from 10-16th of December across UTLAs in the UK vs human mobility from London (GLM R2 = 0.28, p < 0.001) and Kent (GLM R2 = 0.24, p < 0.001). Each line represents separate coefficients for UTLAs that detected B.1.1.7 genomes (i) before the lockdown (prior to November 5th, purple), (ii) during the lockdown (November 5th - December 2nd, blue), (iii) after the lockdown (after December 2nd, green). The black line shows the correlation for UTLAs that had not detected B.1.1.7 as of December 29, 2020.
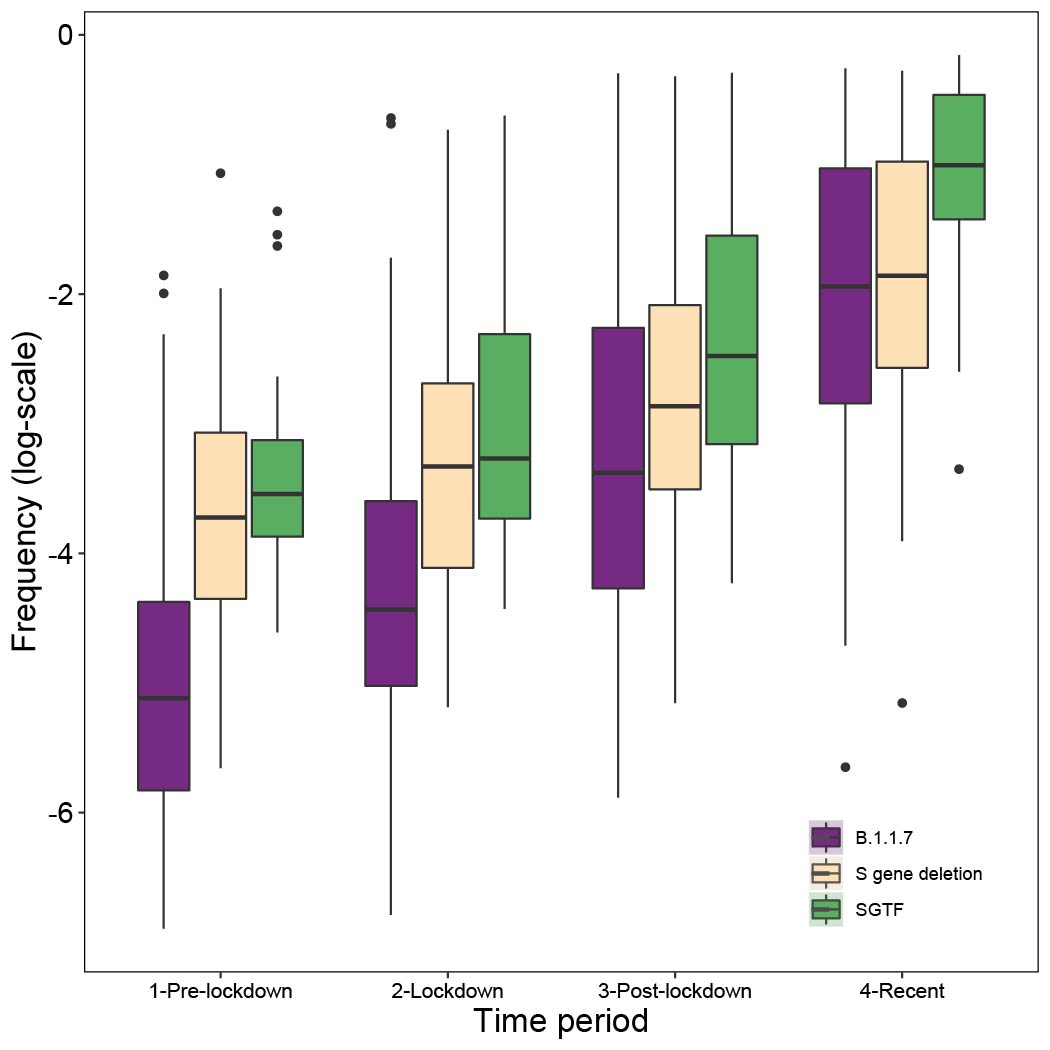
Figure S4: The frequency of the B.1.1.7 lineage (purple), the 20 lineages currently known to carry the 21765_6 S gene deletion (tan), and S-gene target failures (green) were estimated for each UTLA and aggregated into four time periods. Briefly, to estimate the frequency we each type, we used a Beta prior (0.1,1) on the proportion of the novel variant to account for sampling intensity, we estimated frequency using sampling data from pre-lockdown (prior to Nov. 5th), lockdown (Nov. 5st - Dec. 3rd), post-lockdown (Dec. 4th - Dec. 17th), and recent (after Dec. 17th). Following the first time period, when updating the posteriors, we take as priors the posteriors from the early period (down-weighted by 50% to prevent more recent data from being overwhelmed by earlier samples).
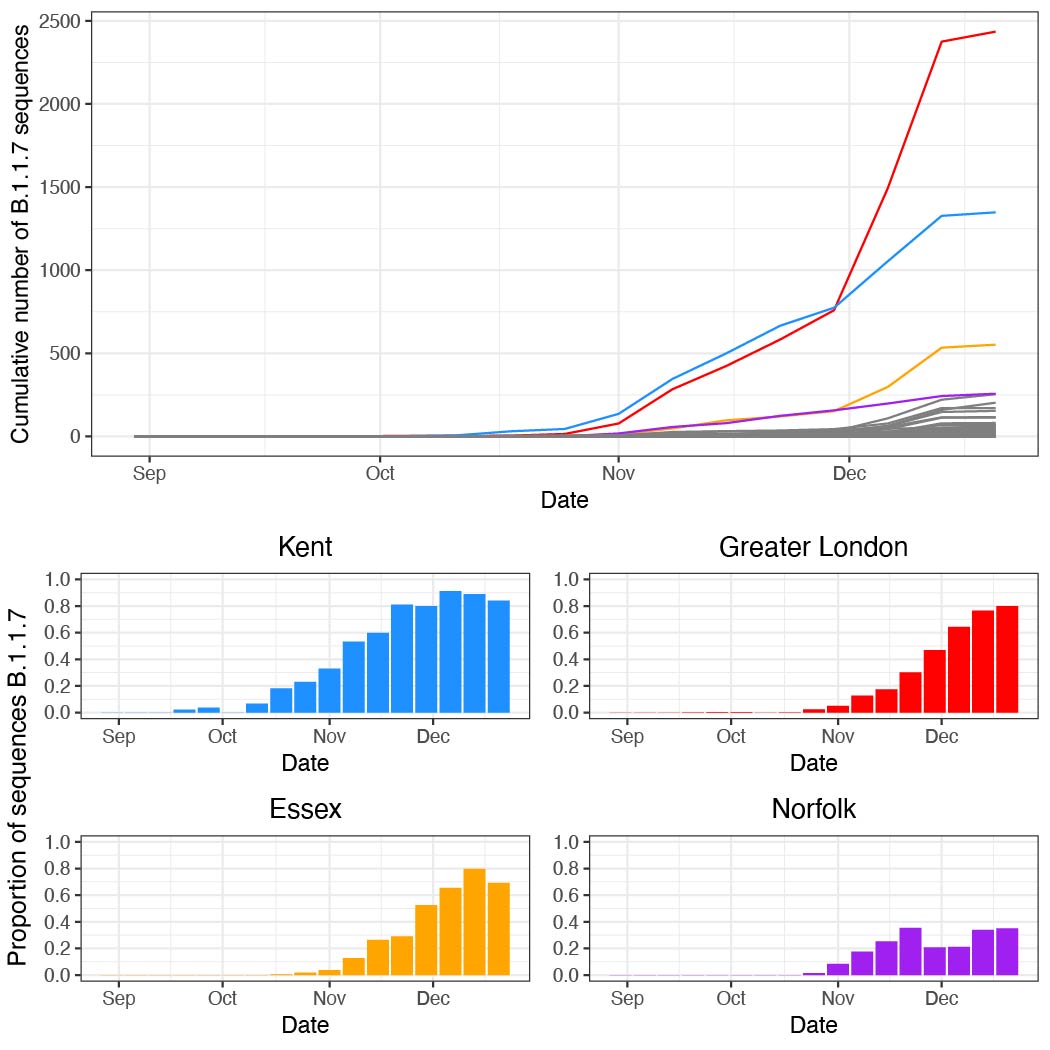
Figure S5: (a) The cumulative number of B.1.1.7 sequences up to and including each week in each UTLA. (b) The proportion of genomes sequenced each week that are B.1.1.7 (raw proportions shown here).