THIS WORK HAS NOT BEEN PEER REVIEWED
Spatio-temporal heterogeneity and the spread of lineage B.1.1.7 in the United Kingdom
Moritz U.G. Kraemer1+, Verity Hill2*, Christopher Ruis3*, Kris V. Parag4, Anya Lindstrom Battle1, Áine O’Toole2, Alessandro Vespignani5, The COVID-19 Genomics UK (CoG-UK) consortium6,#, Nicholas J. Loman7, Andrew Rambaut2, Samuel V. Scarpino5+, Oliver G. Pybus1+
- Department of Zoology, University of Oxford, UK
- Institute of Evolutionary Biology, University of Edinburgh, UK
- Molecular Immunity Unit, Department of Medicine, Cambridge University, UK
- Imperial College London, UK
- Network Science Institute, Northeastern University, USA
- https://www.cogconsortium.uk/
- Institute of Microbiology and Infection, University of Birmingham, UK
*Contributed equally
+Correspondence: [email protected] (M.U.G.K.); [email protected] (S.V.S.); [email protected] (O.G.P.)
Abstract
In late 2020 a distinct phylogenetic cluster of SARS-CoV-2, named B.1.1.7, was detected in the south of England. The lineage has since spread across the UK and internationally. To investigate the spatial dynamics of the current outbreak of B.1.1.7 in the UK we combine data from whole genome sequencing, routine community-based diagnostic PCR testing, and human mobility. First, we find that the invasion and growth rates of B.1.1.7 cases among UK regions are positively associated with the intensity of human mobility from Kent and London during and after England’s second lockdown (early-Nov to early-Dec). Second, following the lockdown, there were higher growth rates in areas well connected to Kent and London and that previously experienced lower attack rates. Third, using whole genome sequencing data and using S-gene target failure (SGTF) we find that the increase in frequency of lineage B.1.1.7 in each location was initially associated with mobility and prior attack rates, but this association declined through time and is no longer evident. We conclude that the emergence of B.1.1.7 occurred in the context of complex spatio-temporal dynamics of SARS-CoV-2 in the UK, which served to rapidly disseminate B.1.1.7 geographically, and potentially to amplify the effects of its increased intrinsic transmissibility. Limitations in the data used mean our results are preliminary, should be interpreted cautiously, and our results may change as new data become available.
Introduction
The SARS-CoV-2 lineage B.1.1.7 has rapidly expanded across the United Kingdom (1, 2). As of December 29, it has been detected in 60 counties across Wales, Scotland, Northern Ireland and England, with onward transmission in 30 counties. Restrictions on travel have been enacted to contain the international spread of B.1.1.7 and genomic surveillance has detected the virus in numerous countries worldwide (3). Initial analyses of genomic, contact tracing and aggregated epidemiological data have estimated higher transmissibility of B.1.1.7 compared to other SARS-CoV-2 lineages (1, 4–6). In order to add to this growing body of work, we here describe the dynamics of B.1.1.7 in the context of inferred human mobility and spatial heterogeneity of previous SARS-CoV-2 transmission in the UK.
Spatial expansion of B.1.1.7 in the UK
B.1.1.7 was first detected in Kent on 2020-09-20 and spread quickly across the United Kingdom (Figure 1a). The speed of expansion of B.1.1.7 is illustrated in Figure 1b, with each week adding approximately 8 regions of new detection. Notably, B.1.1.7 was spreading spatially before the end of the English national lockdown on December 2nd 2020.
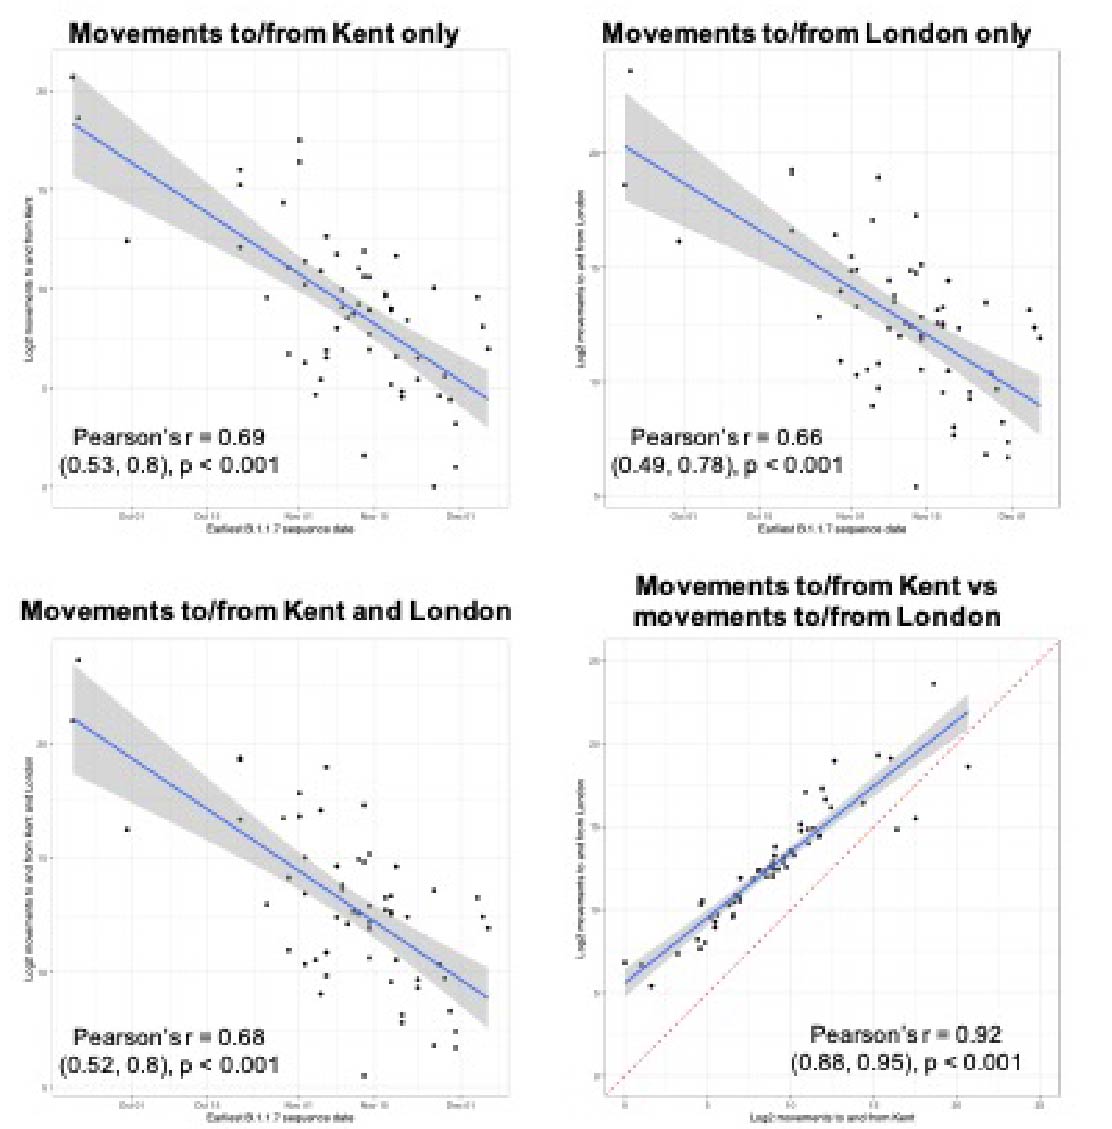
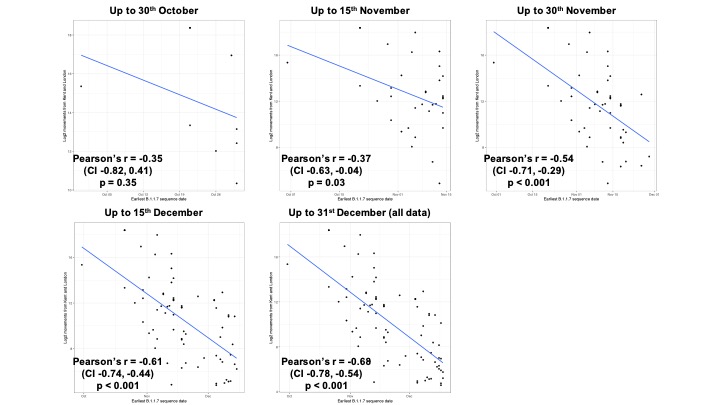
Newly-expanding lineages of SARS-CoV-2 spread via human movements (e.g. (7, 8)). We use aggregated mobile phone data to examine the dissemination of B.1.1.7 from its likely location of emergence (Kent and London) to other regions of the UK (Figure 1c; Methods). For each UTLA (upper tier local authority), we find that the date of first detection of B.1.1.7 can be predicted well by movement intensity from Kent and London (Pearson’s r = -0.68, 95% CI: -0.54,-0.78, Figure 1d) and similarly well using movements from Kent and London separately (Figure S1). This correlation strengthens through time as new locations with B.1.1.7 detection are added (Figure S2). The anonymised and aggregated mobility data we use represents baseline movement from February 2020 and therefore do not include any recent changes in movement due to holiday travel, lockdown, or the effects of any other intervention. Thus we advise caution in interpreting these travel numbers. Other data suggest that the frequency of long distance movements for example has declined during and after the lockdown which is not captured in our data (9).
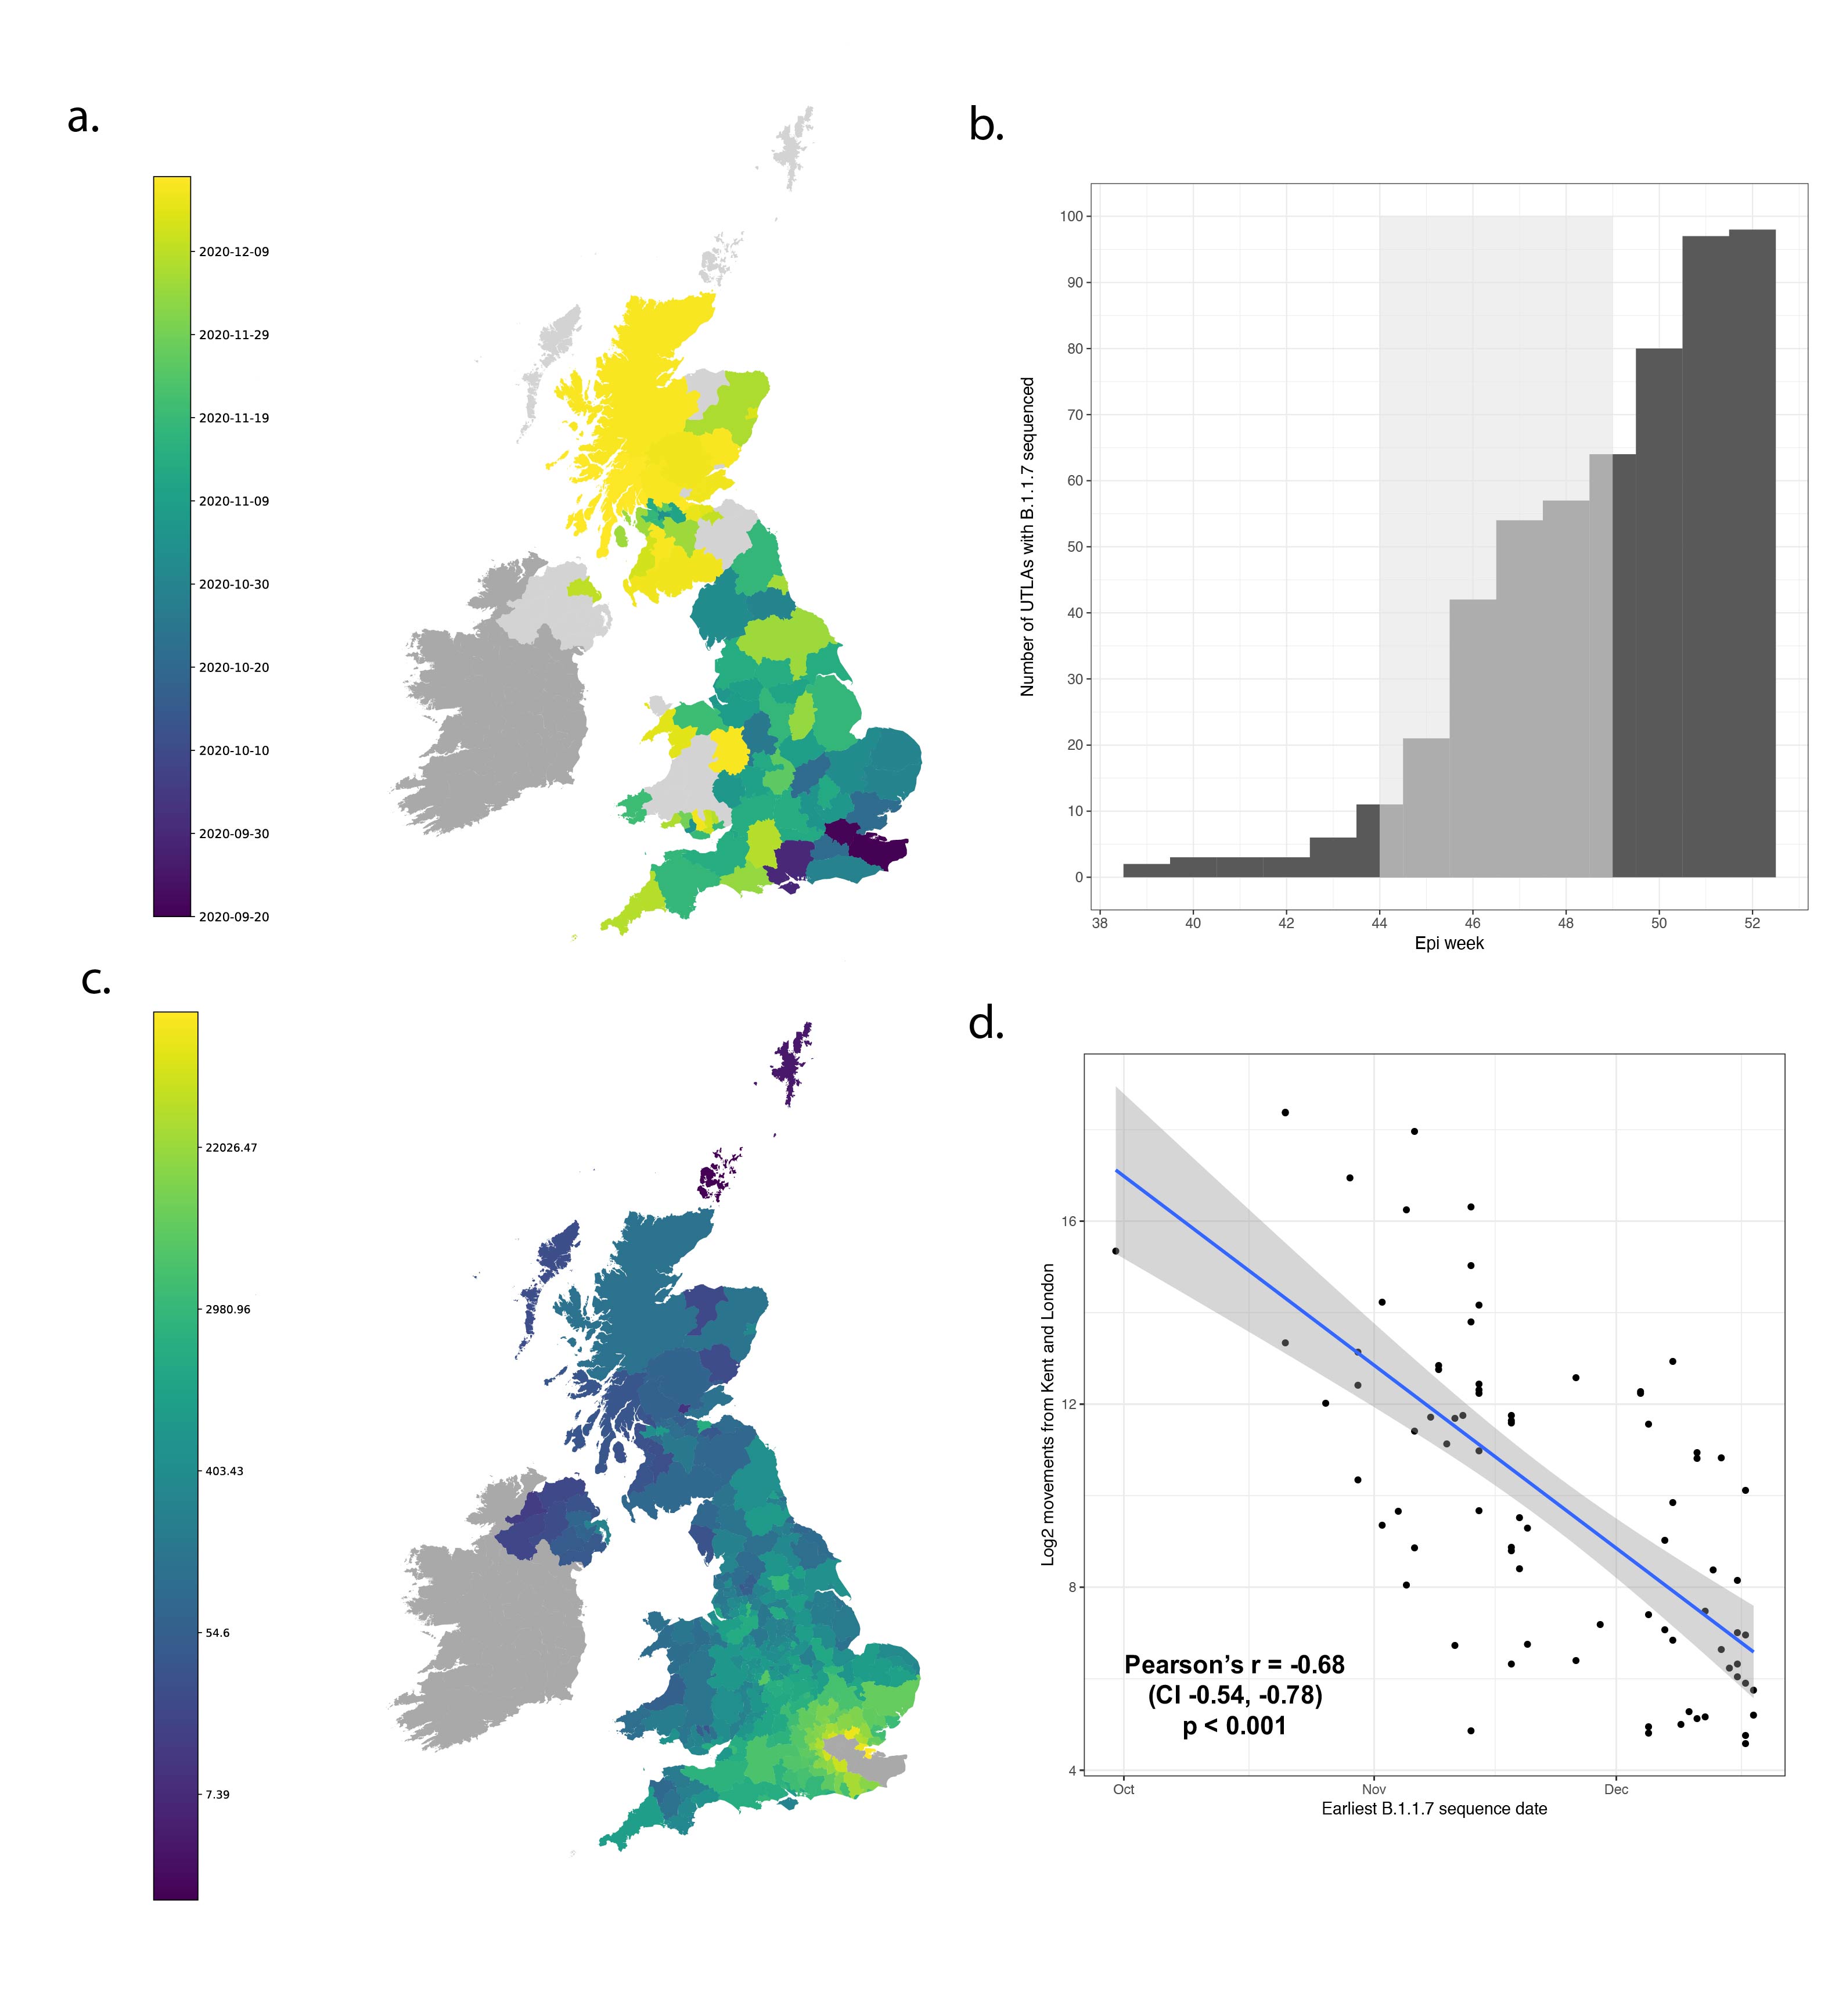
Figure 1: Spatial expansion of B.1.1.7 across the United Kingdom. (a) Map of arrival time of lineage B.1.1.7 at the UTLA level. Darker colours indicate earlier arrivals and lighter colours later arrivals. Arrival time is defined as the first sample date of a genomic sequence of lineage B.1.1.7 in each UTLA. (b) Cumulative number of UTLAs where lineage was present in 7-day intervals. The grey shaded area indicates the period of second lockdown in England, November 5th – December 2nd, 2020. c) Estimated number of movements from Kent and London to all Local Tier Local Authority. Lighter colours indicate more movements and darker colours fewer. Mobility is based on anonymised and aggregated data insights from mobile phones (Materials and Methods) and represents trips from February 2020. (d) Relationship between the arrival time of B.1.1.7 and estimated movements from Kent and London, for each UTLA (see Materials and Methods).
Next, we examined weekly growth rates in SARS-CoV-2 cases at the UTLA level (Materials and Methods; daily date of specimen data up to Jan 10th 2021 from https://coronavirus.data.gov.uk). We excluded case data from 3rd - 10th January inclusive to account for reporting and testing delays. Case growth rates until 23rd December are highest in Southeast England (Figure 2a shows growth rates for 10-16th December).
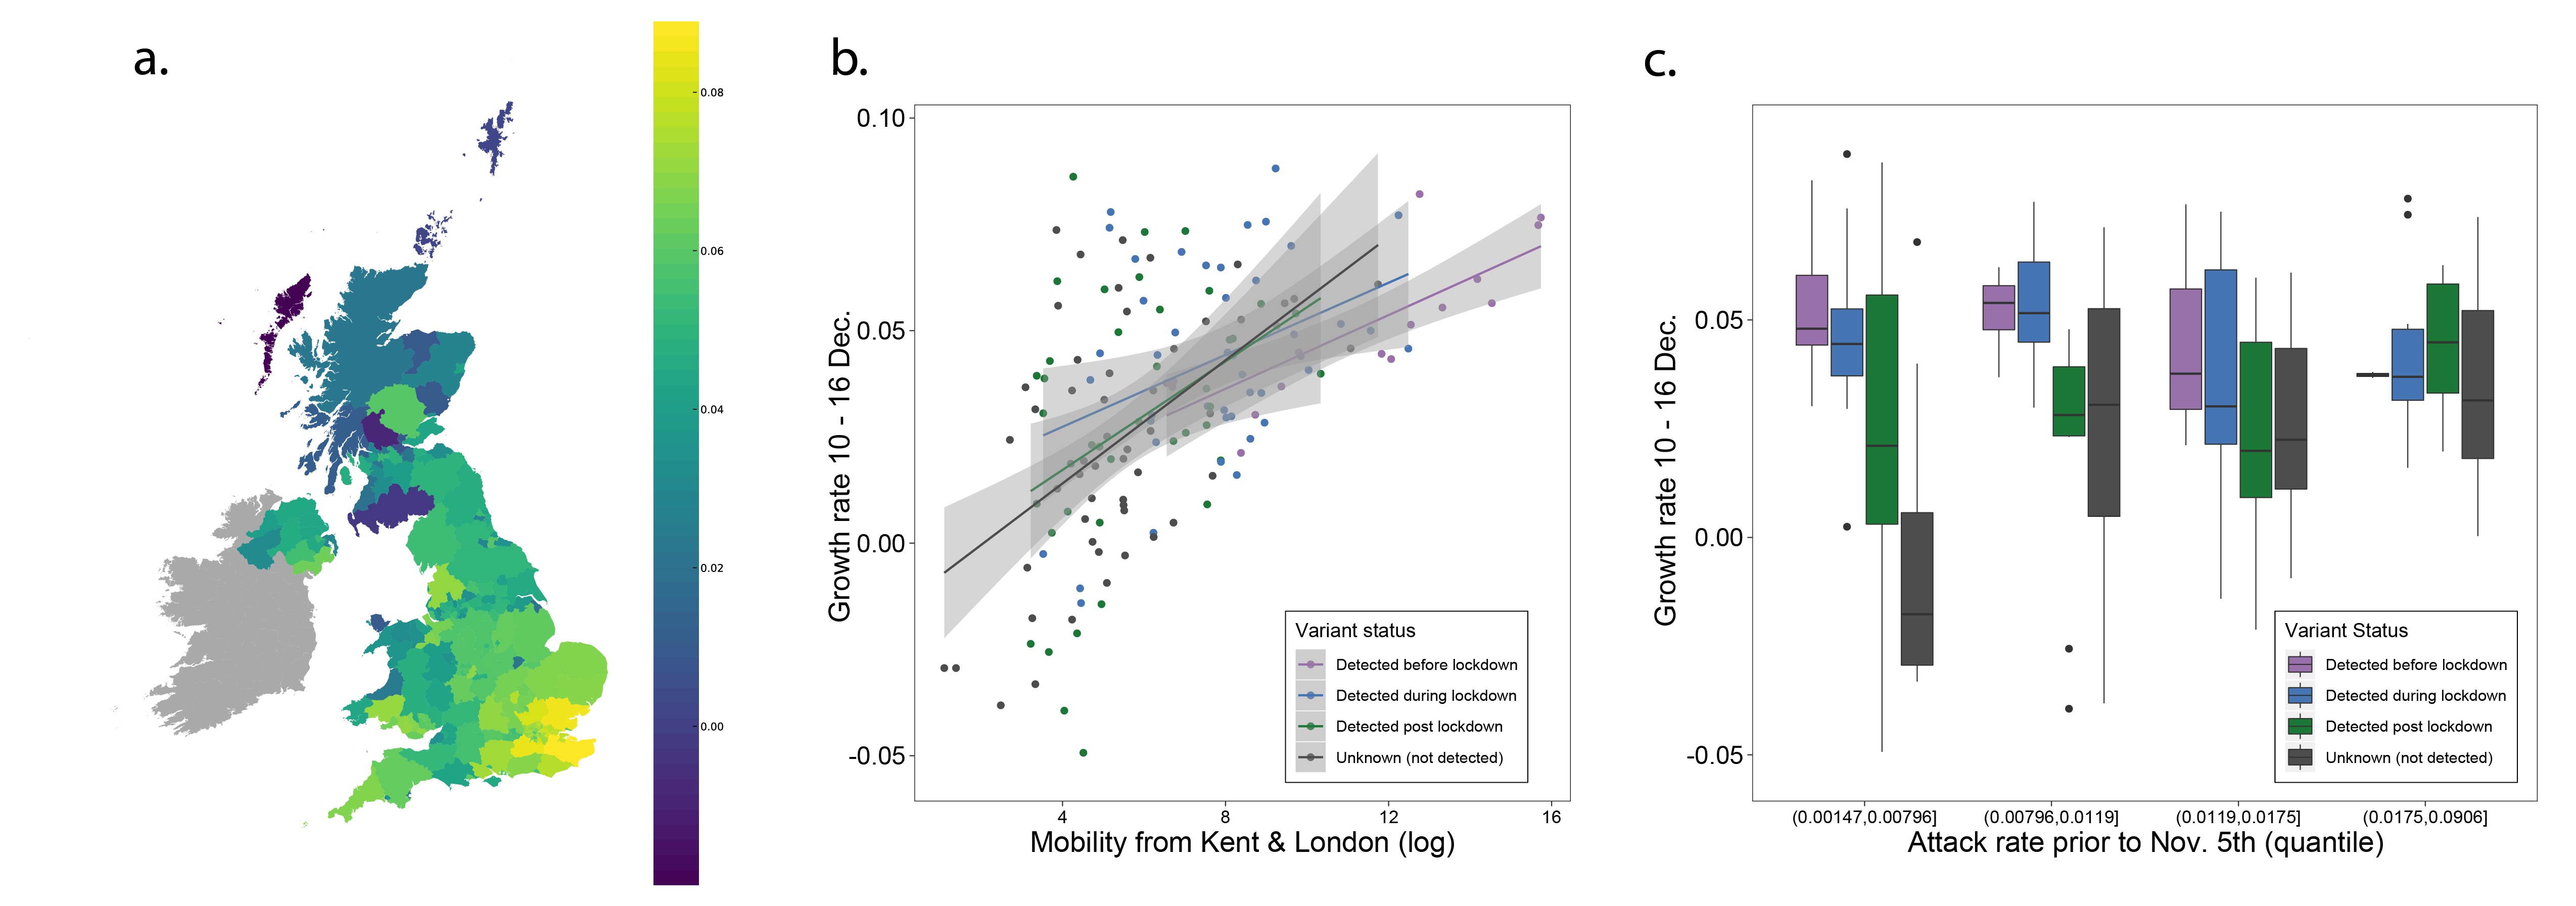
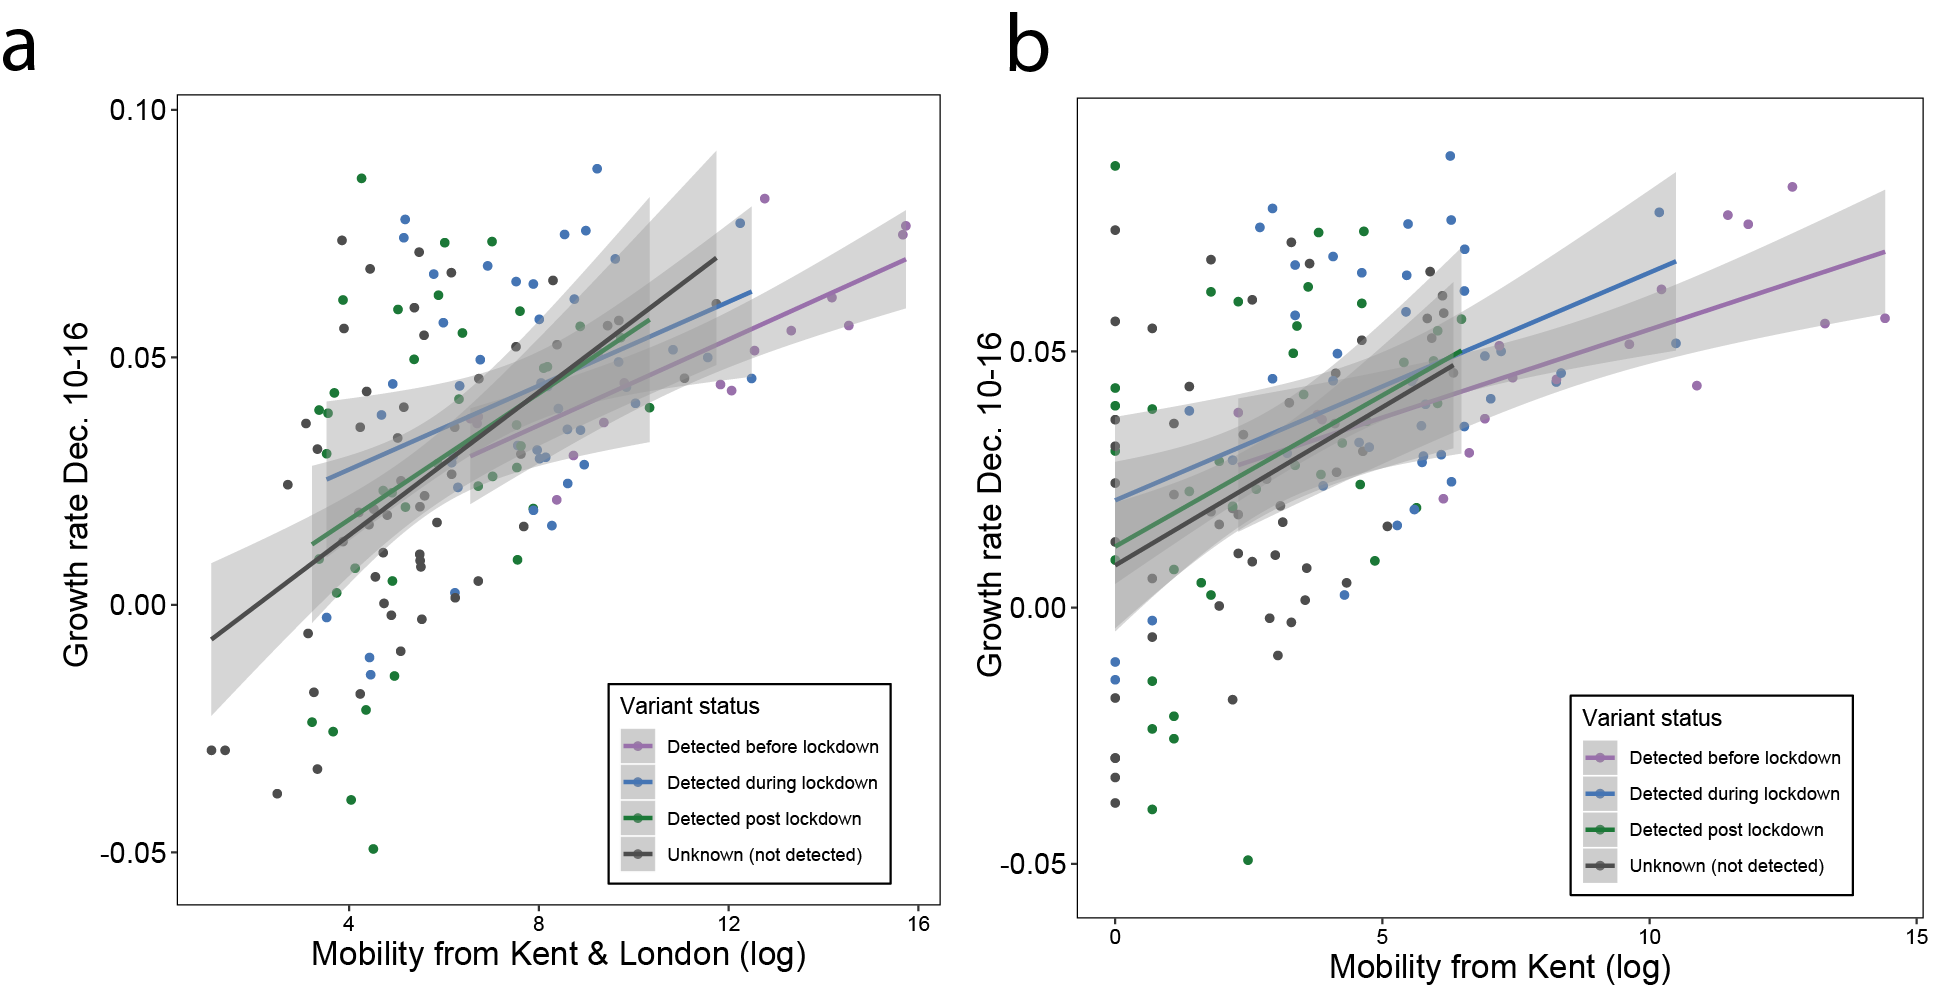
Figure 2: (a) Map of the rolling seven day average of daily case growth rates in all UTLAs in the week December 10th - 16th 2020. (b) Median case growth rates during 10-16th December in each UTLA are correlated with mobility from Kent & London (GLM R2 = 0.28, p < 0.001), with similar explanatory power for London (Figure S3; GLM R2 = 0.28, p < 0.001) and Kent (Figure S3; GLM R2 = 0.24, p < 0.001) considered separately. Each line represents separate coefficients for UTLAs that first detected B.1.1.7 genomes (i) before the lockdown (prior to November 5th, purple), (ii) during the lockdown (5th Nov - 2nd Dec, blue), (iii) after the lockdown (after 2nd Dec, green). The black line shows the correlation for UTLAs that had not detected B.1.1.7 by 29th December. c) Relationship between the first detection date of B.1.1.7 and case growth rate during 10th-16th across all UTLAs, stratified by attack rate prior to 5th November 2020. Each boxplot represents growth rates in UTLAs that had detected B.1.1.7 before 5th November (purple), between November 6-December 2 (blue), 3rd-29th Dec (green) or not detected by 29th Dec (grey). The x-axis is grouped by attack rates (quantiles) prior to the second English lockdown (cases before 5th November).
During the UK’s second wave of infection, after summer 2020, there was strong spatial heterogeneity in recorded cases. Using case count data, we find that the southeast of England and Greater London together accounted for about 40% of all cases during December 1st – 7th, the week that the English national lockdown was eased (Kent alone accounted for 5% of all cases during that week, whilst Kent makes up 2.7% of the UK population). Conversely, outbreaks in the UK in autumn and early winter were more concentrated in the north of England (80% of reported cases between September 1st and December 1st were outside Greater London and the Southeast).
We use human mobility and COVID-19 case data to investigate the role of Kent and London in seeding infections across the UK. We find that case growth rates across UTLAs during December 10th - 16th are associated with mobility from Kent and London (GLM R2 = 0.28, p < 0.001, GLM for London R2 = 0.26, p < 0.001, and GLM for Kent R2 = 0.24, p < 0.001, Figure 2b, Figure S3). Interestingly, we find that growth rates are associated with movements from London and Kent both in UTLAs where B.1.1.7 has been reported, and in ULTAs where it has not (Figure 2b).
We further explored the relationships between post-lockdown growth rates, previous attack rates, mobility, and timing of B.1.1.7 invasion. Performing model selection using Bayesian Information Criteria, we find that attack rates prior to the November lockdown (p < 0.001) were positively associated with COVID-19 growth rates after the lockdown, but that there was a significant, negative interaction between prior attack rate and mobility from London and Kent. Specifically, regions with lower attack rates prior to the November lockdown, but with higher connectivity to London and Kent, had the highest observed case growth rates (p < 0.001, Figure 2c). In a multivariate model, mobility from Kent and London and prior attack rates explained 33% of the variation in case growth rates at the UTLA level in the week of 10-16th December. We conclude that B.1.1.7 initially expanded in an area that had low previous attack rates and high levels of connectedness and mobility, contributing to the rapid spread of the new lineage across the UK. After 16th December, mobility, and the interaction of mobility and attack rates, are no longer significant in explaining the growth rates across the United Kingdom, at which time local factors and interventions likely start to dominate growth trends. Lower local previous attack rates are still significantly associated with higher growth rates after December 16.
These analyses have several limitations: (i) case reporting biases may affect estimates of growth rates, (ii) some regions may have undetected B.1.1.7 circulation and are therefore not assigned to the correct analysis group, (iii) despite the UK’s national genomic surveillance programme, the lag between earliest circulation, detection and reporting of B.1.1.7 may vary among locations depending on sampling intensity and reporting capacity, (iv) estimates of total attack rate prior to the lockdown are based on case counts, which may not reflect changing testing practices through time and among locations, (v) human mobility data are from February 2020 and do not reflect any recent changes of mobility. Therefore, these results should be viewed as preliminary and will be updated as the situation evolves.
Human mobility and prior outbreaks predict increasing frequency of B.1.1.7
We next investigated factors related to the increase of B.1.1.7 relative to other SARS-CoV-2 lineages across the UK using genome sequence and PCR testing data. Given the small fraction of cases that are identified by whole genome sequencing, we repeated our analyses with a proxy for B.1.1.7 (10) (9), the S-gene target failure (SGTF) dataset from Public Health England, in order to track increases in frequency of lineage B.1.1.7 through time.
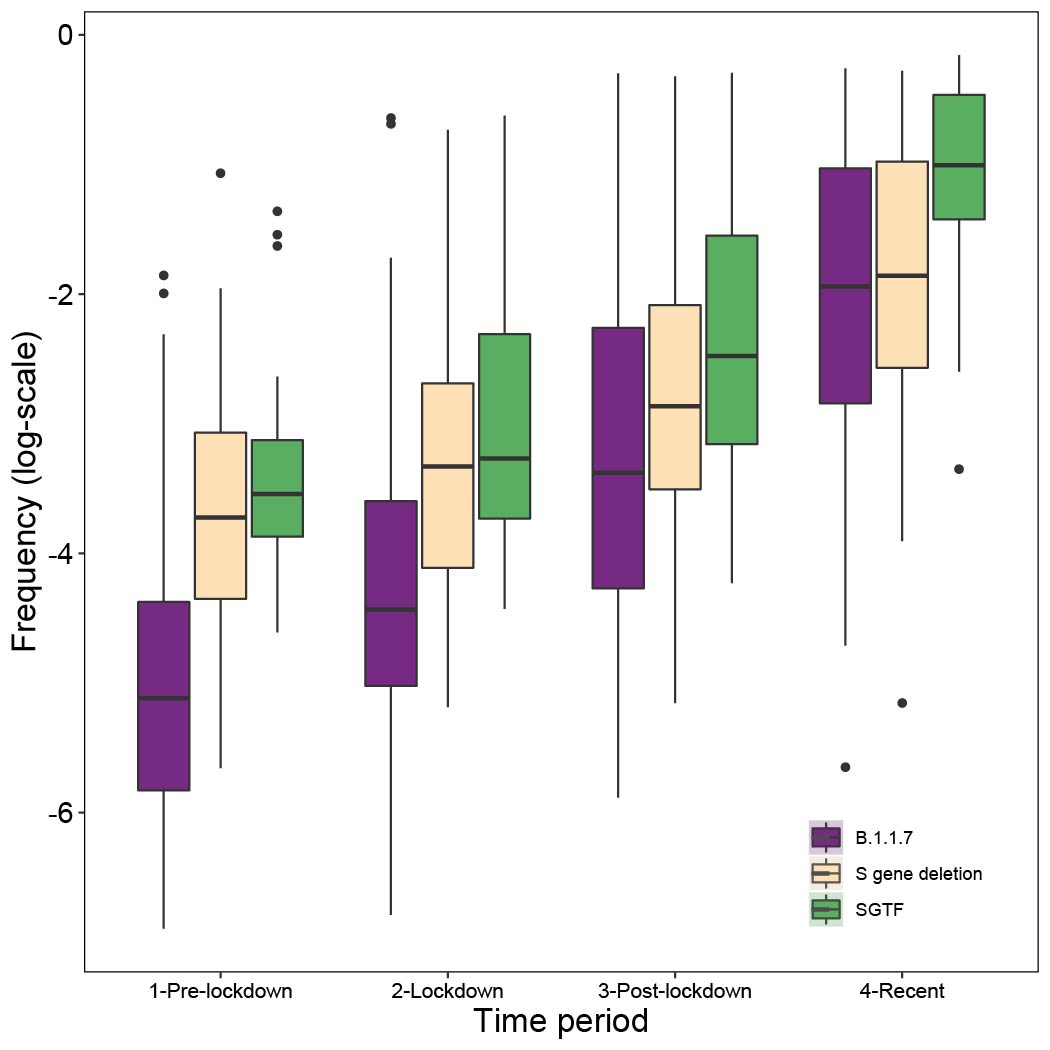
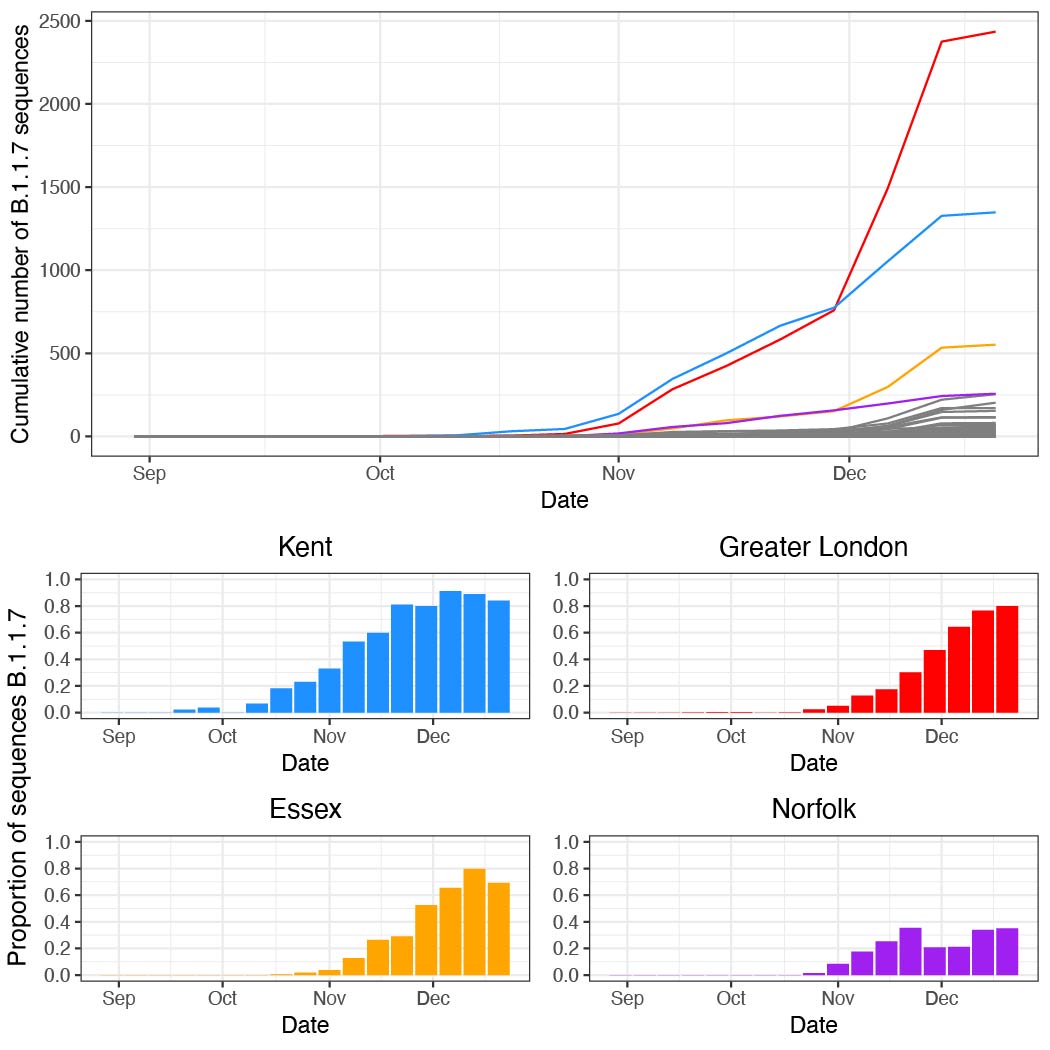
Genome sequence data: For all genomes sampled in Kent, ~55% were assigned lineage B.1.1.7 between 5th November and 2nd December. Using a Beta prior (0.1,1) that assumes the pre-lockdown frequencies of B.1.1.7 to be low, we can update the estimated frequency using sampling data from the periods pre-lockdown (prior to 5th Nov), lockdown (5th Nov - 2nd Dec), post-lockdown (3rd -16th Dec), and recent (after 16th Dec). When updating the posteriors for the subsequent sampling period, we take as priors the posteriors from the previous period (down-weighted to prevent more recent data from being overwhelmed by earlier samples). We observe consistent increases in the frequency of B.1.1.7. across the sampling periods (Figure 3a). Specifically we see increases in Medway and Kent in the initial phase, and rapid increases in East Sussex and Swindon after the lockdown ended (Figure 3a). Other locations exhibit slower increases, for example Norfolk (Figure S5).
SGTF data: Using SGTF data we also find consistent increases in frequency among locations across the sampling periods (Figure 3b; differences between genome data and SGTF data are not statistically significant). However, we note that SGTF observations may be biased in October and November due to the co-circulation of lineages other than B.1.1.7 that can also lead to SGTF (Figure S4). Using SGTF as a proxy for B.1.1.7 is therefore time-dependent and depends on the background diversity of co-circulating lineages.
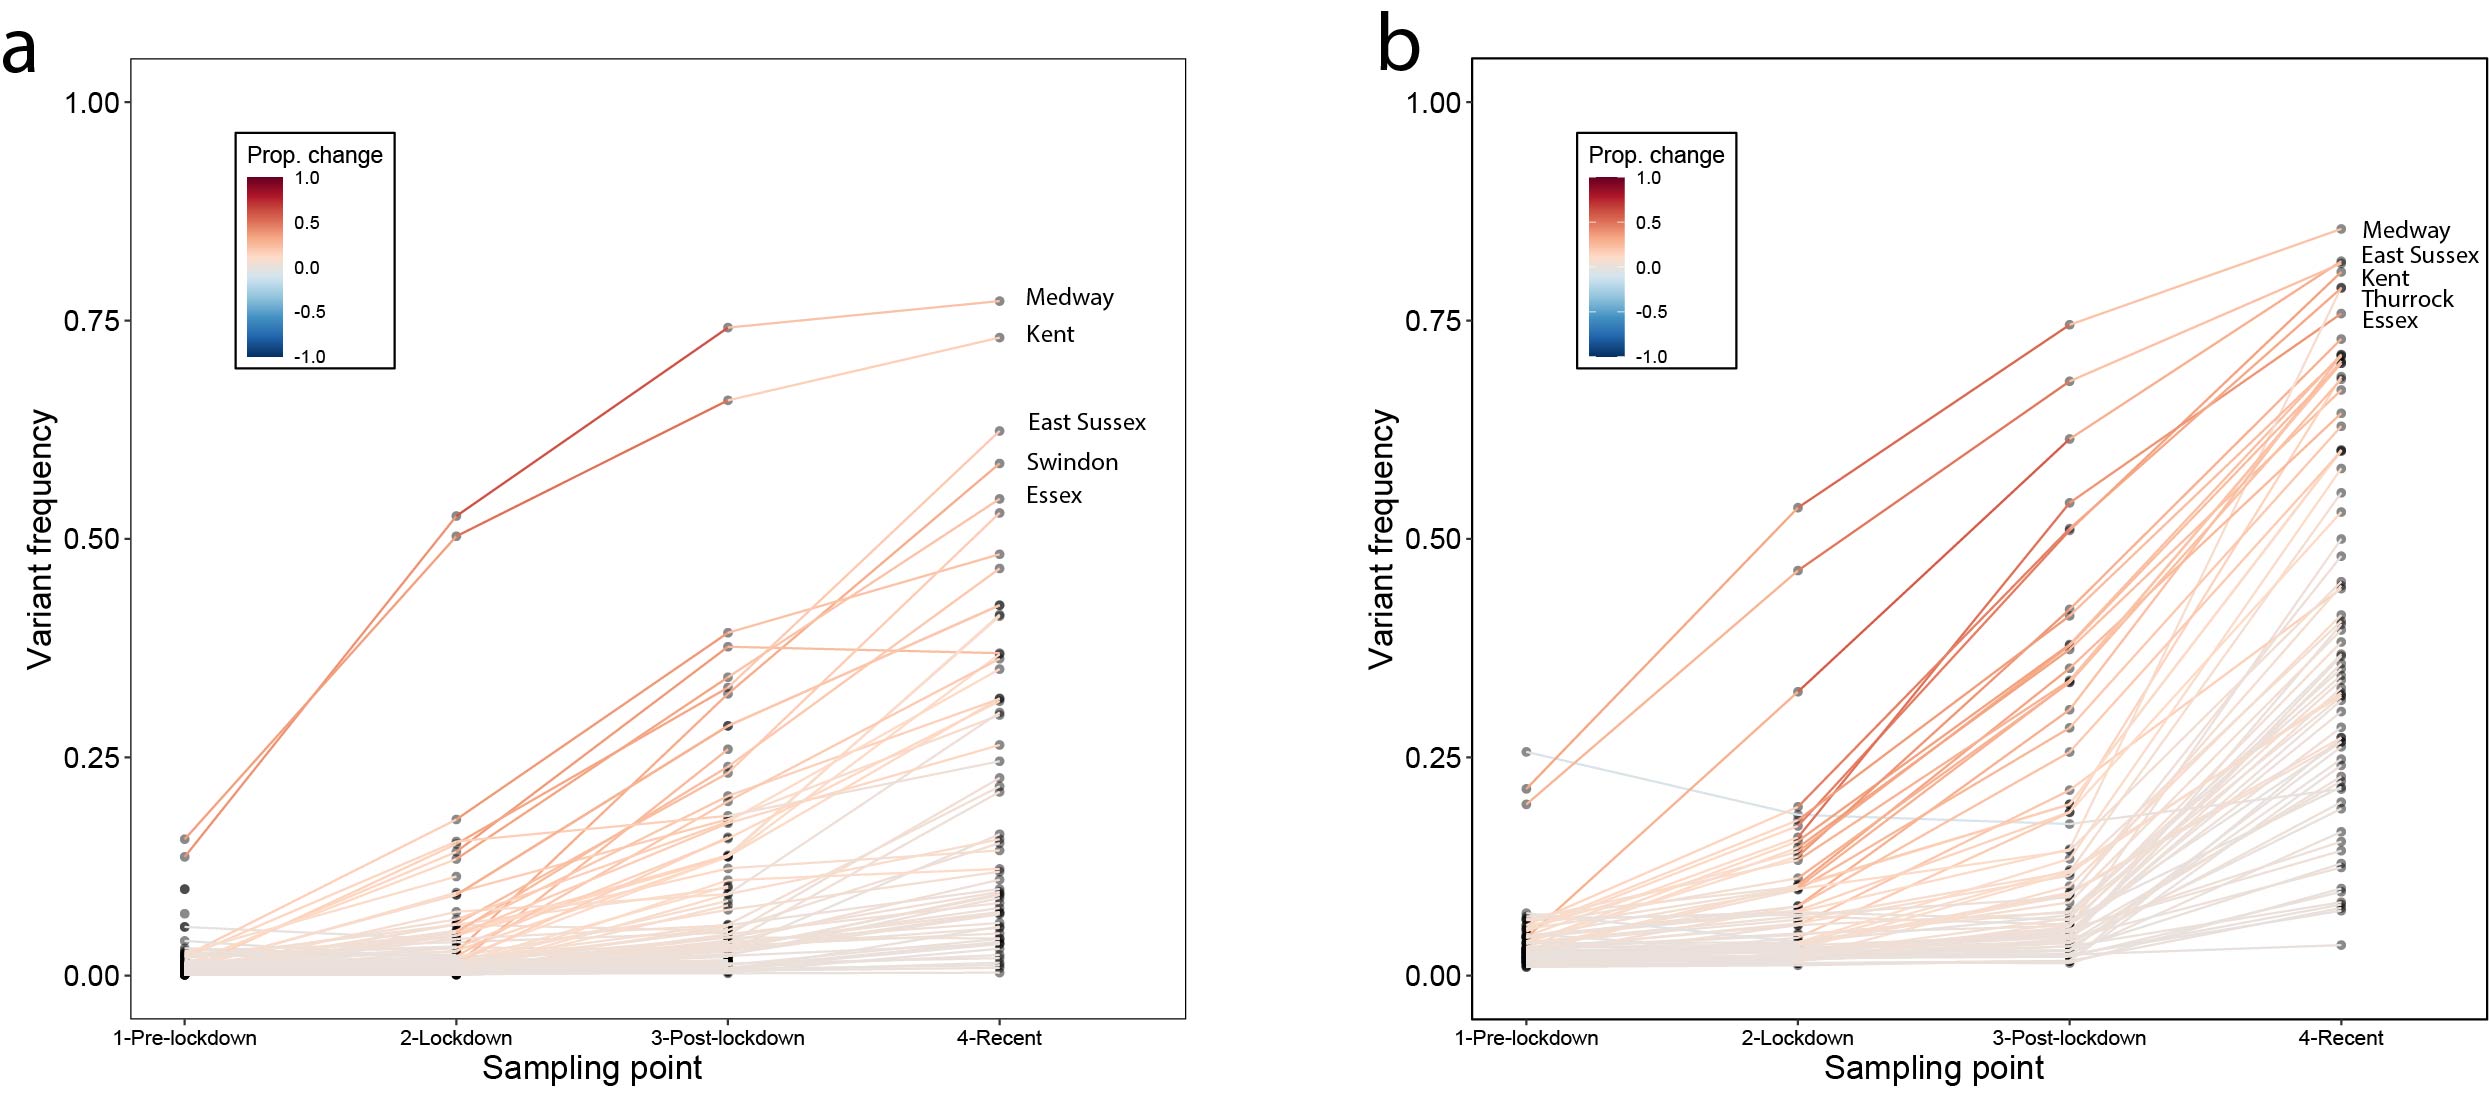
Figure 3: Change in frequency of the variant between Nov. and Dec. 2020. (a) results for data from whole genome sequencing. (b) results from SGTF data. In both panels, each line represents a UTLA location. Using a uniform Beta prior (1,1) on the proportion of lineage B.1.1.7, we can update the estimated frequency using sampling data from pre-lockdown (prior to Nov. 5th), lockdown (Nov. 5th - Dec. 2nd), post-lockdown (Dec. 3rd - Dec. 16th), and recent (after Dec. 16th).
The initial, early relative increase in frequency of B.1.1.7 in each region may be affected by exportation of the lineage from Kent and London (both combined had 34 million outgoing movements per month in Feb 2020). In a multivariate model we find that about 50% of variation of increase in frequency of B.1.1.7 genomes between the end of the lockdown (2nd December) and 17th December can be potentially explained by human mobility from London and attack rates prior to November (Figure 4a and c). If we repeat the analysis using increases in SGTF variant frequency then we obtain similar results (R2 = 0.57, p < 0.001, Figure 4b and d).
However, the explanatory power of mobility and previous attack rate drops markedly for the SGTF data after 16th December, with mobility from London no longer being a significant predictor (full model R2 = 0.18, p=0.001). Further, neither human mobility nor pre-lockdown attack rate were significant predictors of changes in B.1.1.7 genome frequencies after 17th December. Instead, B.1.1.7 genome frequency change after the 17th December was best predicted simply by its frequency on that date (R2 = 0.13, p = 0.006). A drop through time in the explanatory power of connectivity to Kent and London is expected under a dissemination process that has an initial invasion phase, followed by a phase of local transmission. During the latter, growth rates become increasingly independent of direct exportation from location(s) of emergence in which the incidence of the new variant is high (11).
During the latest period of decline of cases in the United Kingdom following the lockdown on January 5, 2021 we note that UTLAs with the highest frequency of SGTF on January 5 (we could not perform the analysis with the latest genomic data due to a delay in reporting) tended to have a quicker decline in cases (Pearson’s r = 0.66, p < 0.001).
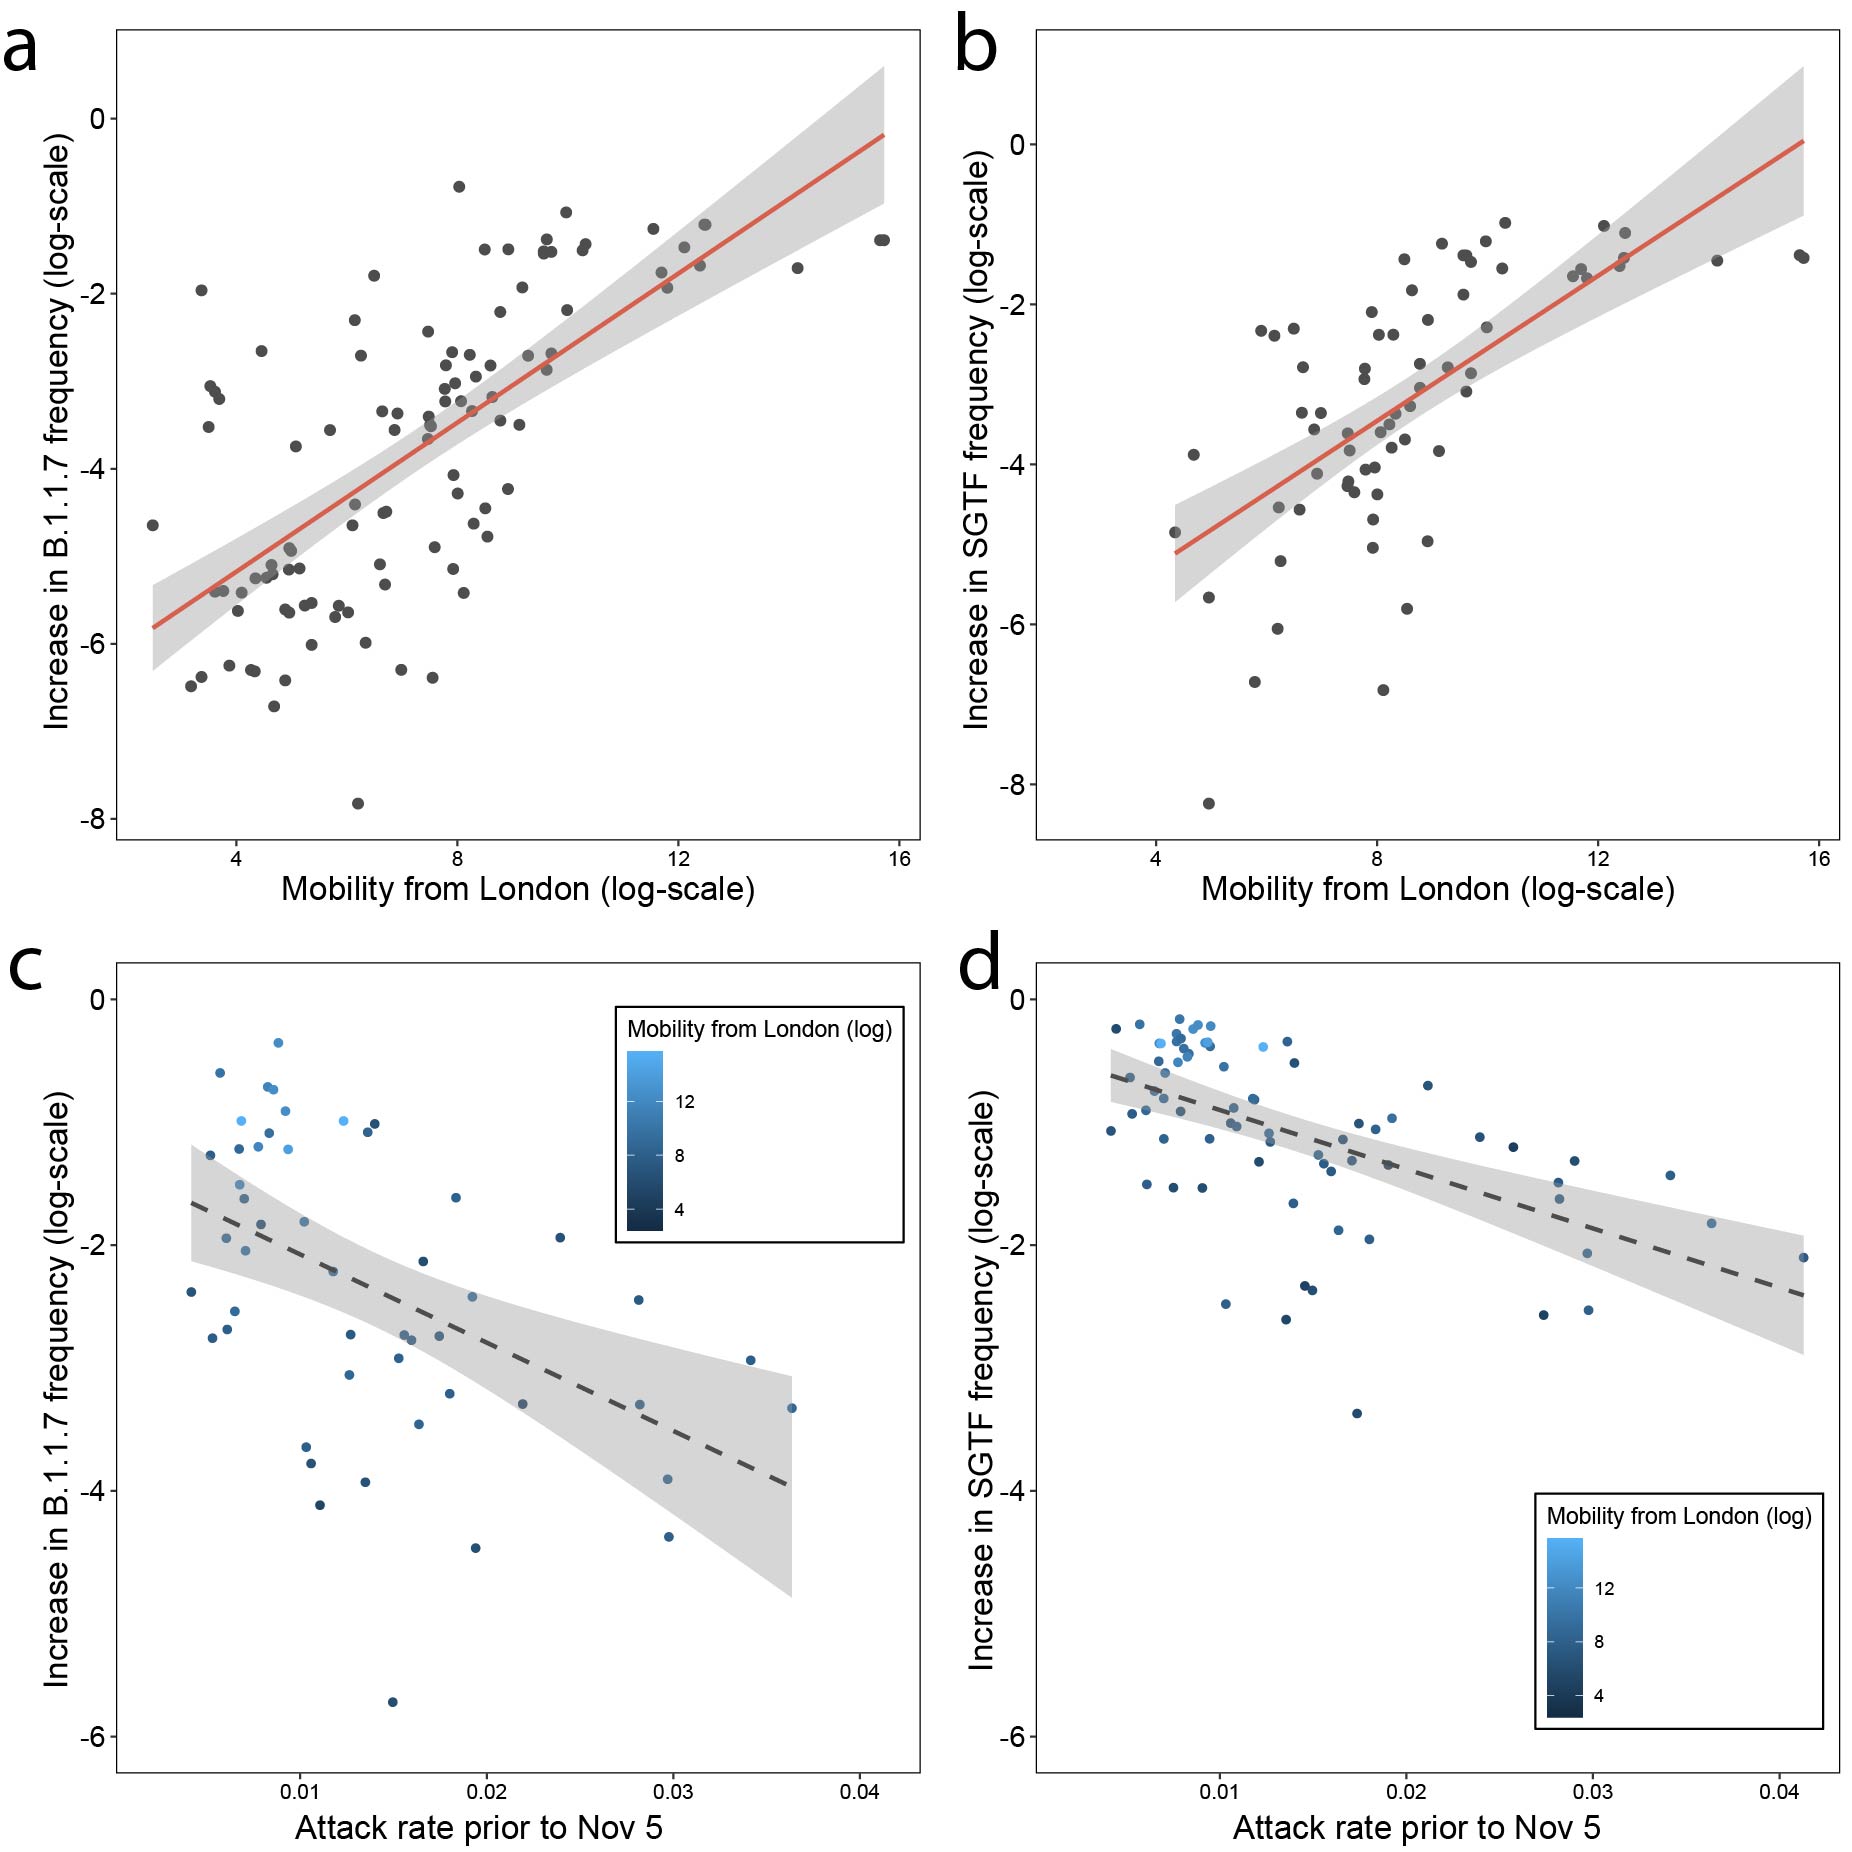
Figure 4: Increase in the frequency of the variant between the end of the lockdown on December 2nd and December 16th is predicted by mobility from London (a) using genome data (B.1.1.7) and (b) using SGTF data. Increase in the frequency of the variant as it relates to previous attack rates c) using genome data (B.1.1.7) and (d) using SGTF data.
Conclusions and future work
Lineage growth and spatial spread is a common feature of the SARS-CoV-2 pandemic (7, 8). Early during the emergence of a new variant, lineage replacement dynamics are likely affected by spatio-temporal heterogeneity in incidence and mobility among highly-connected regions (12). For example, during summer 2020, returning travellers from Europe imported B.1.177 into all four nations of the UK. This importation occurred in the context of low overall prevalence of SARS-CoV-2 in the UK, allowing the frequency of B.1.177 to increase rapidly across the country after July, before declining during the lockdown in November (the number of travellers arriving in the UK during September from Spain was ~460,000).
We conclude the exceptionally rapid spatial spread and early growth rates of the new variant lineage B.1.1.7 likely reflect the combined effects of its higher intrinsic transmissibility (1, 4, 5) and the spatial structure of incidence and mobility before, during, and after the second lockdown in England. Understanding this process is further complicated by the differences among regions in non-pharmaceutical interventions at that time. Further epidemiological and experimental work is needed to discriminate transient demographic factors from the permanent contribution to increased transmissibility conferred by the mutations carried by B.1.1.7 and to understand the mechanisms of their action.
THIS WORK HAS NOT BEEN PEER REVIEWED
References:
- Meera Chand, Susan Hopkins, Christina Achison, Charlotte Anderson, Hester Allen, Paula Blomquist, Cong Chen, Vicki Chalker, Gavin Dabrera, Obaghe Edeghere, Matt Edmunds, Theresa Lamagni, Richard Myers, Isabel Oliver, Richard Elson, Eileen Gallagher, Natalie Groves, Gareth Hughes, Meaghan Kall, Hannah Moore, Will Sopwith, Charlie Turner, Lara Utsi, Marina Vabistsevits, Roberto Vivancos, Asad Zaidi, Maria Zambon, Wendy Barclay, Neil Ferguson, Erik Volz, Nicholas Loman, Andrew Rambaut, Jeff Barrett, Investigation of novel SARS-CoV-2 variant Variant of Concern 202012/01 (2021), (available at https://assets.publishing.service.gov.uk/government/uploads/system/uploads/attachment_data/file/952490/Variant_of_Concern_VOC_202012_01_Technical_Briefing_4_England.pdf).
- Preliminary genomic characterisation of an emergent SARS-CoV-2 lineage in the UK defined by a novel set of spike mutations (2020), (available at https://pando.tools/t/preliminary-genomic-characterisation-of-an-emergent-sars-cov-2-lineage-in-the-uk-defined-by-a-novel-set-of-spike-mutations/563).
- Tracking the international spread of SARS-CoV-2 lineages B.1.1.7 and B.1.351/501Y-V2 (2021), (available at https://pando.tools/t/tracking-the-international-spread-of-sars-cov-2-lineages-b-1-1-7-and-b-1-351-501y-v2/592).
- E. Volz, S. Mishra, M. Chand, J. C. Barrett, R. Johnson, L. Geidelberg, W. R. Hinsley, D. J. Laydon, G. Dabrera, Á. O’Toole, R. Amato, M. Ragonnet-Cronin, I. Harrison, B. Jackson, C. V. Ariani, O. Boyd, N. J. Loman, J. T. McCrone, S. Gonçalves, D. Jorgensen, R. Myers, V. Hill, D. K. Jackson, K. Gaythorpe, N. Groves, J. Sillitoe, D. P. Kwiatkowski, S. Flaxman, O. Ratmann, S. Bhatt, S. Hopkins, A. Gandy, A. Rambaut, N. M. Ferguson, The COVID-19 Genomics UK (COG-UK) consortium, Transmission of SARS-CoV-2 Lineage B.1.1.7 in England: Insights from linking epidemiological and genetic data. bioRxiv (2021), , doi:10.1101/2020.12.30.20249034.
- N. G. Davies, R. C. Barnard, C. I. Jarvis, A. J. Kucharski, Estimated transmissibility and severity of novel SARS-CoV-2 Variant of Concern 202012/01 in England. medRxiv (2020) (available at https://www.medrxiv.org/content/10.1101/2020.12.24.20248822v1.full-text).
- Lineage-specific growth of SARS-CoV-2 B.1.1.7 during the English national lockdown (2020), (available at https://pando.tools/t/lineage-specific-growth-of-sars-cov-2-b-1-1-7-during-the-english-national-lockdown/575).
- D. S. Candido, I. M. Claro, J. G. de Jesus, W. M. Souza, F. R. R. Moreira, S. Dellicour, T. A. Mellan, L. du Plessis, R. H. M. Pereira, F. C. S. Sales, E. R. Manuli, J. Thézé, L. Almeida, M. T. Menezes, C. M. Voloch, M. J. Fumagalli, T. M. Coletti, C. A. M. da Silva, M. S. Ramundo, M. R. Amorim, H. H. Hoeltgebaum, S. Mishra, M. S. Gill, L. M. Carvalho, L. F. Buss, C. A. Prete Jr, J. Ashworth, H. I. Nakaya, P. S. Peixoto, O. J. Brady, S. M. Nicholls, A. Tanuri, Á. D. Rossi, C. K. V. Braga, A. L. Gerber, A. P. de C Guimarães, N. Gaburo Jr, C. S. Alencar, A. C. S. Ferreira, C. X. Lima, J. E. Levi, C. Granato, G. M. Ferreira, R. S. Francisco Jr, F. Granja, M. T. Garcia, M. L. Moretti, M. W. Perroud Jr, T. M. P. P. Castiñeiras, C. S. Lazari, S. C. Hill, A. A. de Souza Santos, C. L. Simeoni, J. Forato, A. C. Sposito, A. Z. Schreiber, M. N. N. Santos, C. Z. de Sá, R. P. Souza, L. C. Resende-Moreira, M. M. Teixeira, J. Hubner, P. A. F. Leme, R. G. Moreira, M. L. Nogueira, Brazil-UK Centre for Arbovirus Discovery, Diagnosis, Genomics and Epidemiology (CADDE) Genomic Network, N. M. Ferguson, S. F. Costa, J. L. Proenca-Modena, A. T. R. Vasconcelos, S. Bhatt, P. Lemey, C.-H. Wu, A. Rambaut, N. J. Loman, R. S. Aguiar, O. G. Pybus, E. C. Sabino, N. R. Faria, Evolution and epidemic spread of SARS-CoV-2 in Brazil. Science. 369, 1255–1260 (2020).
- L. du Plessis, J. T. McCrone, A. E. Zarebski, V. Hill, C. Ruis, B. Gutierrez, J. Raghwani, J. Ashworth, R. Colquhoun, T. R. Connor, N. R. Faria, B. Jackson, N. J. Loman, Á. O’Toole, S. M. Nicholls, K. V. Parag, E. Scher, T. I. Vasylyeva, E. M. Volz, A. Watts, I. I. Bogoch, K. Khan, COVID-19 Genomics UK (COG-UK) Consortium†, D. M. Aanensen, M. U. G. Kraemer, A. Rambaut, O. G. Pybus, Establishment and lineage dynamics of the SARS-CoV-2 epidemic in the UK. Science (2021), doi:10.1126/science.abf2946.
- A. Zachariae, D. Brockmann, COVID-19 lockdown induces disease-mitigating structural changes in mobility networks. Proceedings of the (2020) (available at https://www.pnas.org/content/117/52/32883.short).
- S. A. Kemp, R. P. Datir, D. A. Collier, I. Ferreira, A. Carabelli, W. Harvey, D. L. Robertson, R. K. Gupta, Recurrent emergence and transmission of a SARS-CoV-2 Spike deletion ΔH69/ΔV70. Cold Spring Harbor Laboratory (2020), p. 2020.12.14.422555.
- M. U. G. Kraemer, C.-H. Yang, B. Gutierrez, C.-H. Wu, B. Klein, D. M. Pigott, Open COVID-19 Data Working Group, L. du Plessis, N. R. Faria, R. Li, W. P. Hanage, J. S. Brownstein, M. Layan, A. Vespignani, H. Tian, C. Dye, O. G. Pybus, S. V. Scarpino, The effect of human mobility and control measures on the COVID-19 epidemic in China. Science. 368, 493–497 (2020).
- N. W. Ruktanonchai, J. R. Floyd, S. Lai, C. W. Ruktanonchai, A. Sadilek, P. Rente-Lourenco, X. Ben, A. Carioli, J. Gwinn, J. E. Steele, O. Prosper, A. Schneider, A. Oplinger, P. Eastham, A. J. Tatem, Assessing the impact of coordinated COVID-19 exit strategies across Europe. Science. 369, 1465–1470 (2020).
- B. Ripley, Support Functions and Datasets for Venables and Ripley’s MASS [R package MASS version 7.3-53] (2020) (available at https://cran.r-project.org/package=MASS).
Acknowledgements: We thank all involved in the collection and processing of SARS-CoV-2 testing data. We also thank Public Health England for making epidemiological data available for this analysis.
Funding: VH was supported by the Biotechnology and Biological Sciences Research Council (BBSRC) [grant number BB/M010996/1]. AR acknowledges the support of the Wellcome Trust (Collaborators Award 206298/Z/17/Z – ARTIC network) and the European Research Council (grant agreement no. 725422 – ReservoirDOCS). M.U.G.K. acknowledges support from the Branco Weiss Fellowship and EU grant 874850 MOOD. O.G.P. and M.U.G.K. acknowledge support from the Oxford Martin School. A.L.B. S.V.S. and M.U.G.K. acknowledge grants from the Rockefeller Foundation. C.R. was supported by a Fondation Botnar Research Award (Programme grant 6063) and UK Cystic Fibrosis Trust (Innovation Hub Award 001). A.L.B acknowledges support from the Biotechnologyand Biological Sciences Research Council (BBSRC) [grant number BB/M011224/1]. COG-UK is supported by funding from the Medical Research Council (MRC) part of UK Research & Innovation (UKRI), the National Institute of Health Research (NIHR) and Genome Research Limited, operating as the Wellcome Sanger Institute. A.OT is supported by the Wellcome Trust Hosts, Pathogens & Global Health Programme [grant number: grant.203783/Z/16/Z] and Fast Grants [award number: 2236]. The contents of this publication are the sole responsibility of the authors and do not necessarily reflect the views of the European Commission or any of the other funders.
Author contributions: M.U.G.K., V.H., C.R., S.V.S, O.G.P. conceived and planned the research. M.U.G.K., V.H., C.R., A.L.B., S.V.S. analysed the data. M.U.G.K. and O.G.P. wrote the first draft. All authors contributed to writing and interpreting the results.
Competing interests: The authors declare no competing interests.
Data and materials availability: Code and publicly available data associated with this report are hosted on our GitHub repository: https://github.com/Emergent-Epidemics/SARS-CoV-2-B117-UK