On the veracity of RaTG13

September 17th 2020

Vegard Eldholm & Ola B Brynildsrud

Norwegian Institute of Public Health

Proponents of the “lab-release theory” for SARS-CoV-2 (SC2) have recently focused their attention on the published bat coronavirus RaTG13 genome, identified in a horseshoe bat (Rhinolophus affinis). The “Yan-report”, which has garnered significant attention recently, claims that the RaTG13 genome is “fake” and generated as a cover-up to prop up the “natural origin theory”. To us, it is far from clear that the existence of RaTG13 has a major bearing on deciding whether SC2 is the result of natural evolution or was created in a laboratory. However, as the genome now seems to play an outsized role in the controversy, it could definitely be harmful to the public’s perception of science if the published genome was found to be some sort of a fabrication.

In their report, Yan et al simply postulate that the published genome is not real, and cite a number of preprints in support of this view. Among the cited preprints, Singla et al. seem to represent a wholehearted attempt to look into the veracity of the published RaTG13 genome. The authors conclude that the RaTG13 genome could not be assembled from the raw sequence data linked to its original publication .

We therefore decided to see for ourselves whether we could recover the RaTG13 genome from the public raw sequence data. Zhou et al. only cursorily describe the methods used for genome assembly: Short metagenomic reads were assembled de novo after depletion of reads of human or animal origin, and gaps in the assembly were filled with Sanger-sequenced amplicons.

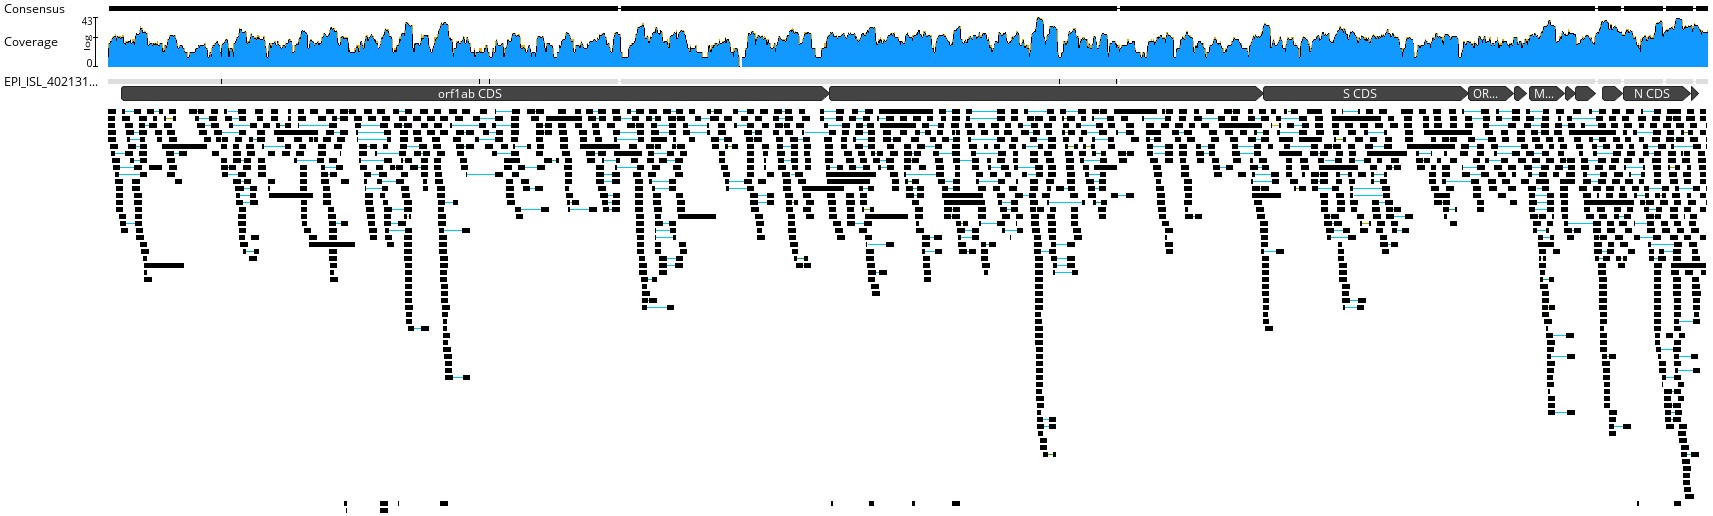
We downloaded the reads from ENA (accessions SRR11085797 for the metagenomic data and SRR11806578 for the amplicon data), and separately mapped both short reads and Sanger amplicons to the RaTG13 genome using BWA with default settings. We first inspected the trace in Artemis for poorly covered regions. Singla et al. claim that more than 1% of the genome had zero coverage, but we could not identify any position with a coverage of less than 1. It is possible that Singla et al. refers to the metagenomic sequence only, as SRR11806578 does not seem to be mentioned in the paper. It is essential to keep in mind that Sanger traces are essentially “error-free” when inspected and trimmed properly, which is why the method is still in use for validation of next generation sequencing projects.

It is indeed true that the sequencing depth across RaTG13 is quite low - Our average indicates 9.73, which is exactly the same as Singla’s estimate. This is strange though, since our number was attained WITH the additional coverage from Sanger sequencing. Low depth is to be expected from metagenomic samples, and the Sanger amplicons fill the gaps well. Specifically, the region 13182-13293 claimed by Singla et al to be absent, is indeed covered by a Sanger amplicon closing the gap in the raw read data (Fig. 1).


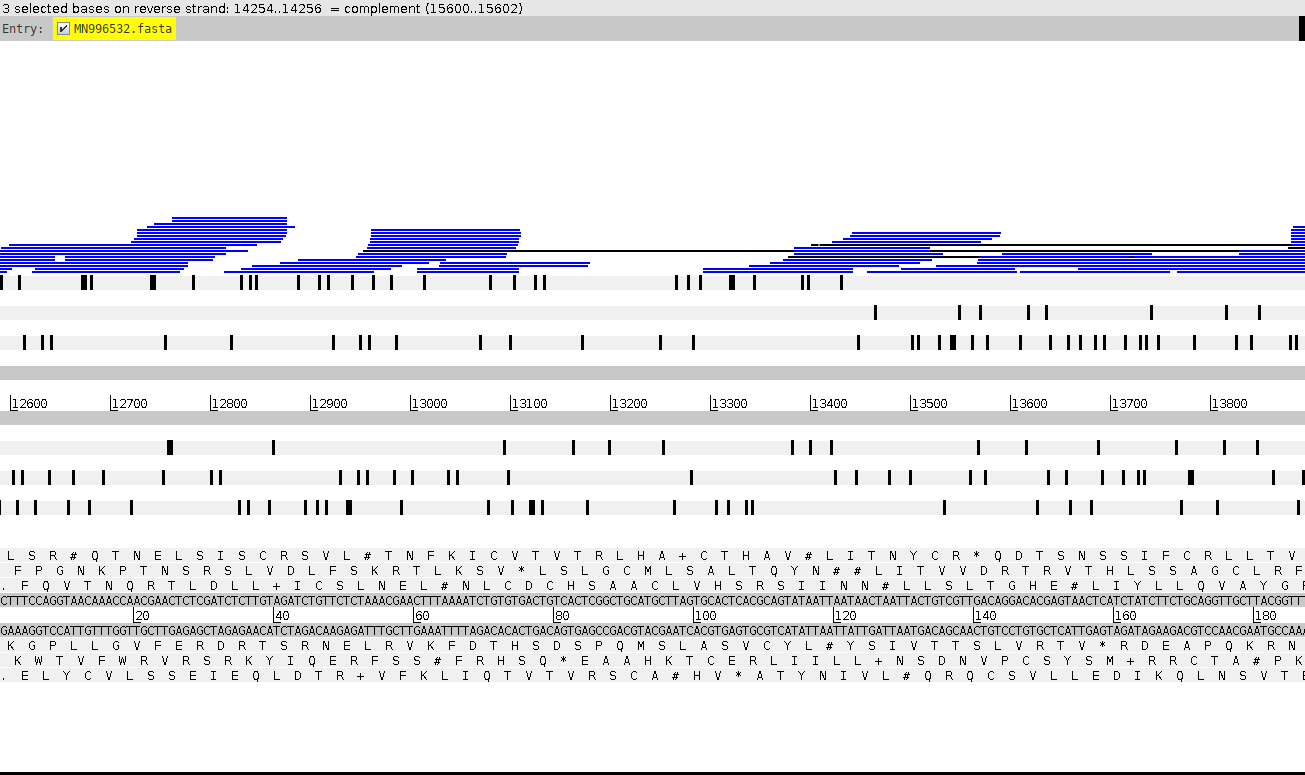
Figure 1. Metagenomic short reads and Sanger amplicons mapped to the RaTG13 genome. Expanded view of a region singled out by Singla et al, demonstrating coverage of assembly gap with Sanger amplicons.

A total of 466 nucleotides in the published genome was not covered by short metagenomic reads in our mapping. On the other hand, a whopping 16540 nucleotides were covered by the Sanger amplicons, illustrating the length to which the authors have gone to patch regions with low/zero depth.

Finally, we used BCFtools to identify potential SNPs between MN996532 and the raw reads generated in Zhou et al’s paper, potentially indicating issues with the data. Across the entire span of the RaTG13 genome, we could only find 2 sites which had basecalls in conflict with the published RaTG13 genome - Positions 18797-18798, which were called as TG rather than GC in our pileups.

To conclude, the published RaTG13 genome is supported by raw sequence data of good quality. It should be noted that our depth estimate of 9.73x above is somewhat misleading, as it counts the essentially error-free Sanger amplicons as “common” error-prone short reads. With Sanger sequencing, a single trace of good quality is generally regarded as sufficient for accurate sequence characterization. The total quality of the data is thus significantly better than the 9.73x depth estimate suggests.

7 Likes

I have previously done this as well and have no concerns about the overall quality of RaTG13 - only a handful of unresolved bases, none of which are in the most critical parts of the genome. Mean coverage of 8.2x with a standard deviation of 5.9x.

As anybody who’s sequenced viral genomes from primary samples knows, getting this type of coverage is very good. Bat samples are tricky and typically have low virus titers so it’s more common to get partial genomes - here it’s a full one.

Methods
Data: https://www.ncbi.nlm.nih.gov/Traces/study/?acc=SRP249482&o=acc_s%3Aa
I used Geneious for this particular plot since the assembler is quite flexible and can assemble Sanger and short-read data at the same time - but you can pretty much use any assembler to get the same result.

6 Likes

I really do not understand why this thread is considered a “new thread”. It should be part of Bill Gallaher’s earlier thread (Tackling Rumors of a Suspicious Origin of nCoV2019). Same concern about the thread “The Sarbecovirus origin of SARS-CoV-2’s furin cleavage site”.

This is a dangerous and unscientific practice. It is as if someone started a new research project without bothering to have a look at the previous literature, not a good practice indeed.

As for RaTG13, this has been discussed already in “Tackling Rumors of …”. In that thread, I commented on the issue (my post is #16) and suggested a reasonable strategy.

Best,
Giorgio Matassi

Well I respectfully disagree. I had read the topic, which is mainly about inferences that can be made by comparing sequences and specific sites.

This thread is concerned with claims that the RaTG13 sequence is not real. Not how it compares with SC2 or other coronaviruses, but whether the virus exists. Quite a different matter even though it is concerned with “rumours of suspicious origin…”

One could make a case for posting it under the topic you mention, but I think your reaction, implying that we haven’t read other posts in here and that this post represents “a dangerous and unscientific practice” is quite unreasonable.

Kind regards,

Vegard

4 Likes

I agree with you Vegard - this is a different topic. Bill’s topic is about the molecular mechanism of how SARS-CoV-2 gained its furin cleavage site, whereas this thread is about the authenticity of SARS-like CoV genomes that have been the focus of a lot of conspiracy theories lately.

Entirely justifies a separate thread and thanks for your great analysis!

I actually have the pangolin and other bat CoVs assembled as well - I’ll follow up with a short update later today (like RaTG13, they’re all fine - in case there was ever any questions about that).

4 Likes

That’s cool, looking forward to it!

1 Like

“Dangerous and unscientific practice” was bad wording on my side.

I still think all the threads I mentioned are linked tough. If you feel like keeping data scattered, go ahead.

Best,

Giorgio

I concur and second the thanks for a great thread and thorough analysis.

Also looking forward to seeing data on the pangolin and other bat CoVs.

Keep up the fantastic work!

1 Like

To further investigate the authenticity of recent pangolin and bat SARS-like coronaviruses, I downloaded all the raw data and assembled all the genomes using bwa mem. All the genomes assembled according to what had been described in the various papers and important features like the receptor binding domains were fully resolved (see figure - RBD highlighted with a green bar under the coverage plot).

Samples

Name Reference Type Study PMID BioProject reads
MP789 EPI_ISL_412860 pangolin Li et al 31652964 PRJNA573298 SRR10168377 SRR10168378
Pangolin-CoV EPI_ISL_410721 pangolin Xiao et al 32380510 PRJNA607174 SRR11119759 SRR11119762 SRR11119765 SRR11119766 SRR11119767 SRR12053850
RmYN02 EPI_ISL_412977 bat Zhou et al 32416074 PRJNA656060 SRR12432009 SRR12464727
RmYN01 EPI_ISL_412976 bat Zhou et al 32416074 NMDC1001304 did not download because of slow speeds
P1E EPI_ISL_410539 pangolin Lam et al 32218527 PRJNA606875 SRR11093266
P2S EPI_ISL_410544 pangolin Lam et al 32218527 PRJNA606875 SRR11093265
P2V EPI_ISL_410542 pangolin Lam et al 32218527 PRJNA606875 SRR11093271
P3B EPI_ISL_410543 pangolin Lam et al 32218527 PRJNA606875 SRR11093270
P4L EPI_ISL_410538 pangolin Lam et al 32218527 PRJNA606875 SRR11093269
P5E EPI_ISL_410541 pangolin Lam et al 32218527 PRJNA606875 SRR11093268
P5L EPI_ISL_410540 pangolin Lam et al 32218527 PRJNA606875 SRR11093267
RaTG13 EPI_ISL_402131 bat Zhou et al 32015507 PRJNA606165 SRR11085797 SRR11806578

Data
Fastq files for each sample were downloaded directly from ENA as single-read data. Consensus genomes were downloaded directly from NCBI and used as reference sequences for genome assembly.

Methods
Sequencing data was uncompressed and aligned in single-read mode to each relevant reference genome using bwa mem with default settings and saved as an aligned bam file using samtools:

gunzip -cd {input_reads.gz} | bwa mem -t 8 {reference.fasta} /dev/stdin | samtools view -q 1 > {output.bam}

Data
All relevant data - including assembled bam files and high resolution coverage plots - can be downloaded from our Google Cloud repo and via our project page.

4 Likes