Origins and Spread within Canada
Next, we tracked the frequencies of AY.25 and AY.27 sequences across Canadian provinces, based on data deposited in GISAID and the Canadian VirusSeq Portal (https://virusseq-dataportal.ca/). These analyses could be confounded by differential sampling strategies across provinces and should thus be treated with caution. Weekly sequencing volumes and sampling strategies differ provincially, and certain variants of concern are prioritized for sequencing based upon qPCR screening. For any given time period, sequencing may represent between 5–100% of cases in a given province and can thus impact analyses of the introduction and spread of the variants. Nevertheless, some notable patterns are apparent.
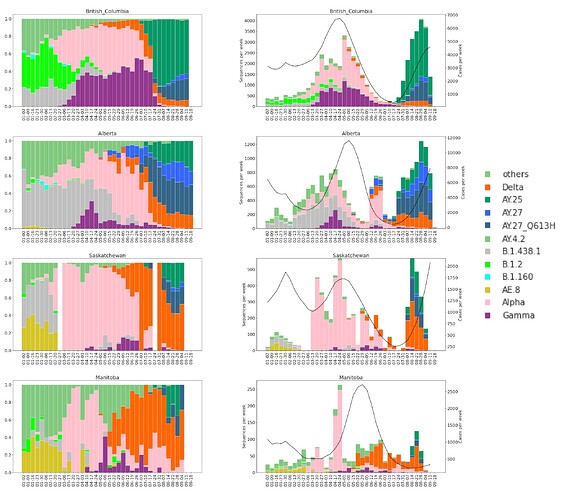
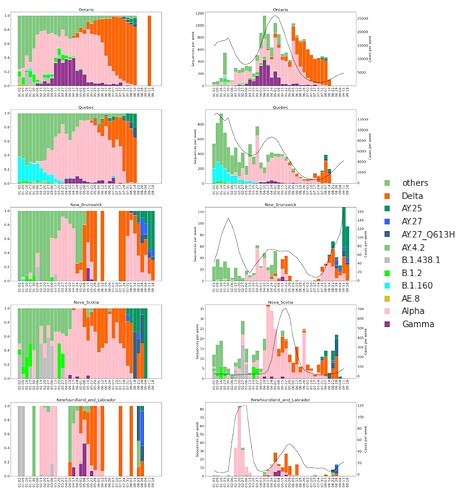
The sublineage AY.25 has been predominantly a United States sublineage: based on GISAID data from Oct. 25, 2021, over 80% of AY.25 genomes were from the US. AY.25 did not rapidly increase in frequency in Canada until mid-July (Fig. 6 and 7), well after AY.25 had spread significantly through several US states (particularly Southern, Midwestern, and Western states). Over a similar time frame, AY.25 also underwent rapid spread in large gatherings in Provincetown, MA in the United States, among a highly vaccinated population (Brown et al. 2021) (see also B.1.617.2 sublineage with expansion in Cape Cod, Massachusetts, USA in July 2021 · Issue #181 · cov-lineages/pango-designation · GitHub). Sublineage AY.25 rose particularly rapidly in frequency in British Columbia during July coinciding with the start of the “Delta wave” of cases (starting in May, nearly 100% of cases were sequenced). Daily cases in early July were at their lowest point for 2021 in British Columbia, rising over the next two months (from 41.5 new cases per day in the first two weeks of July to 647 in the last two weeks of August 2021 in a population of size 5.1M [from the daily news releases on BC Government News]). The appearance of AY.25 in the province near the beginning of the Delta wave allowed it to rise rapidly in number, creating a strong founder event.
Figure 6. Proportions (left) and absolute counts (right) of SARS-CoV-2 genomes in Western Canadian Provinces in 2021. VOCs and some lineages of Canadian interest are shown. Sequence counts are shown in coloured bars and reported COVID-19 cases as a black line (right axis).
Figure 7. Proportions (left) and absolute counts (right) of SARS-CoV-2 genomes in Eastern Canadian Provinces in 2021. VOCs and some lineages of Canadian interest are shown. Sequence counts are shown in coloured bars and reported COVID-19 cases as a black line (right axis).
The AY.27 sublineage is distinctly Canadian –– of the total detections in GISAID, over 97% are of Canadian origin. The earliest detections of the lineage in Canada were in British Columbia and Alberta during April and May, which were detected only a few days after the earliest detections of AY.27 in India and in a few other countries. The high genetic similarity of the earliest AY.27 genomes, the similarity of their collection dates, and the lack of earlier detections makes inferences of the origins of AY.27 challenging. A large subclade of AY.27 harbouring the S:Q613H mutation spread widely across all Canadian provinces (Fig. 5, 6, 7). In contrast, a subclade of AY.27 lacking the S:Q613H and N:S412R mutations arose early in Alberta but failed to sustain transmission or spread to other provinces (Fig. 5).
Transmission of AY.25 and AY.27 sublineages within Canada
To further understand the transmission dynamics of the Delta sublineages AY.25 and AY.27 within Canada, we identified phylogenetically derived clusters of the sequences collected from Canadian provinces using TreeCluster (Balaban et al. 2019) applied to the Maximum Likelihood (ML) tree of each sublineage. Briefly, clusters were formed by linking sequences below a maximum pairwise patristic distance threshold equivalent to approximately one substitution/genome, or two weeks of evolution given a previous estimate of the SARS-CoV-2 substitution rate (Boni et al. 2020). These clusters comprise sequences linked to at least one other sequence by one or fewer substitutions, and can thus span likely transmission chains (allowing for some unsampled intermediates) that extend up to several weeks or months. We note that such similar sequences provide limited resolution to infer phylogenies and transmission chains, which could be clarified by contact tracing information.
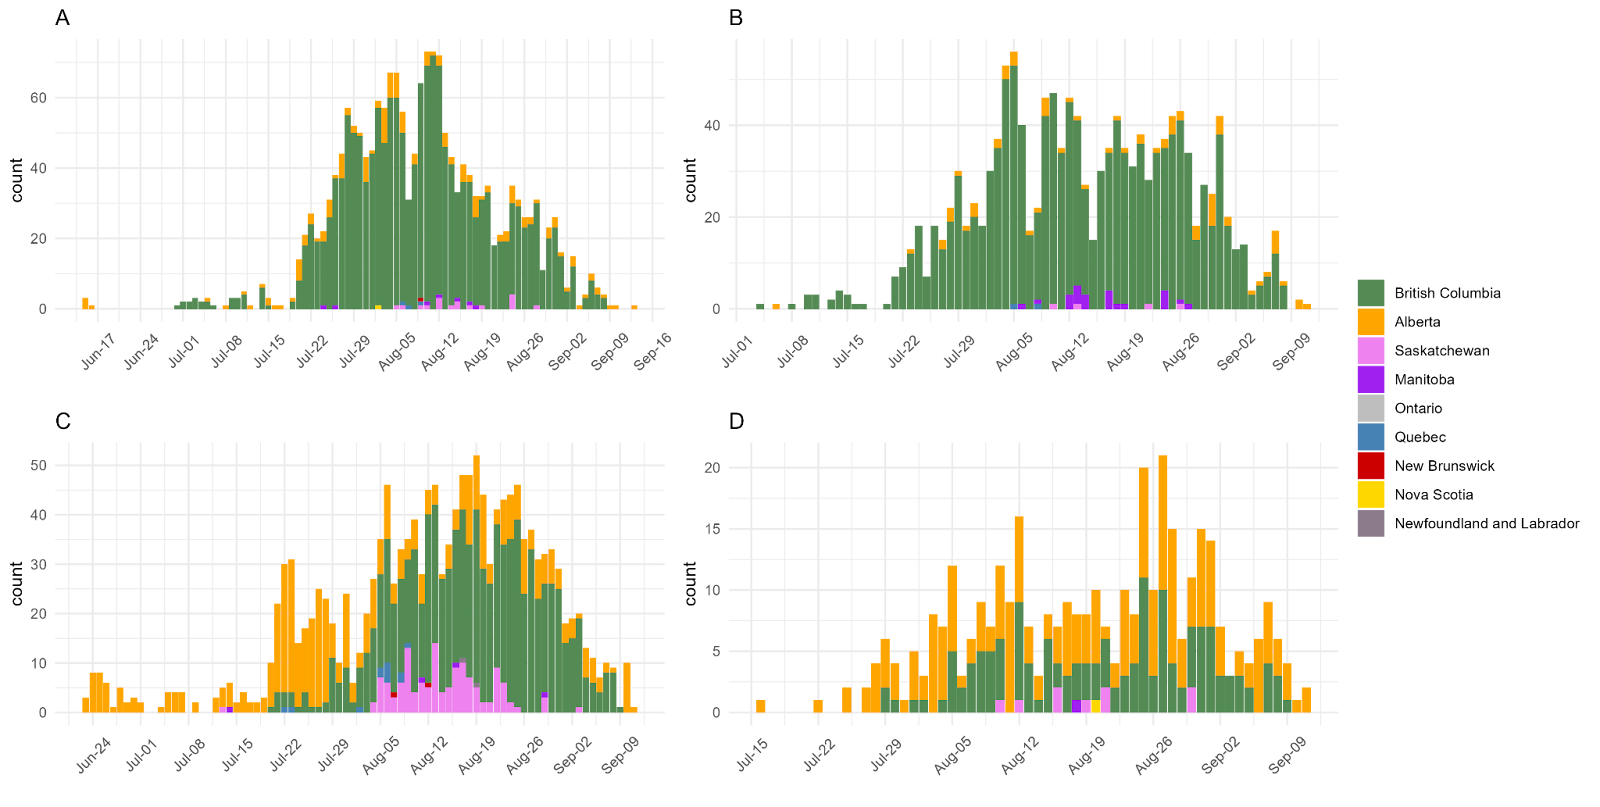
The majority of AY.25 and AY.27 sequences clustered with at least one other sequence (84% and 80% respectively), while 52% of AY.25 and 48% of AY.27 sequences were found in larger clusters of ≥ 20 sequences (Fig. 8). Closer inspection of clusters in AY.25 revealed two very large clusters (n = 1814 and n = 1365) with limited genetic diversity, along with ten clusters of > 100 sequences (n = 109 – 280), and 1402 small clusters between 2 and 98 sequences. Sequences in both of the largest two AY.25 clusters were predominately collected in British Columbia, with some limited appearance elsewhere, mainly in the Western provinces of Alberta and Saskatchewan (Fig. 9A,B). We note that the high volume of sequencing in British Columbia likely impacts the relative apparent composition of clusters. Indeed, the timing of these clusters again coincided with a change in strategy in British Columbia to sequence nearly all SARS-CoV-2 positive cases.
AY.27 is characterized by one large cluster of 1536 sequences, six clusters of between 102 and 366 sequences, and 847 smaller clusters of between 2 and 97 sequences. In contrast to the AY.25 clusters, sequences were distributed more equally among the Western Canadian provinces (Fig. 9). We note that the appearance of one of the AY.27 clusters in Saskatchewan (Fig. 9C) coincides with the ramping up of sequencing from just a few sequences to over 1000 sequenced in the first week of August, 2021. The earliest AY.27 sequences were detected in Alberta around mid-July before appearing in multiple provinces, predominantly Western Canada. The second largest cluster was again first detected in Alberta around mid-July and was then also mainly detected in Alberta and British Columbia. In the larger clusters ( > 100 sequences) we often see multiple provinces represented, particularly among British Columbian and Albertan AY.27 sequences (Fig. 8 and 9). While this observation is certainly in line with transmission among provinces, due to the genetic similarity of the genomes in these clusters we cannot currently measure the extent of intermixing between provinces without contact tracing information.

Figure 8. Timed phylogenetic trees of Canadian AY.25 (left) and AY.27 sequences (right). Coloured bars indicate the Canadian province of sample collection and the phylogenetic cluster, with clusters ≥ 100 sequences colored separately. AY.25 sequences have been subsampled for visualization.

Figure 9. Histograms of the two largest sequence clusters of Canadian AY.25 (A and B) and AY.27 sequences (C and D). Coloured by the Canadian province of sample collection. (A) cluster “Apr21_n1824”, (B) cluster “Jul21_n1365”, (C) cluster “Jun21_n1536”, (D) cluster “Jul21_n366”.
Estimating selection coefficients for AY.25 and AY.27
We next measured the rate of frequency changes among Delta sublineages within Canada, based on the numbers of SARS-CoV-2 sequences deposited in GISAID. We kept all sequences with collection dates between May 15 and November 4, 2021, avoiding the sporadic appearance of AY.25 and AY.27 before these dates. For Ontario, sequences were obtained from the VirusSeq portal, rather than GISAID, because the latter frequently contained incomplete collection dates.
The frequency of a variant with a constant selective advantage s_i is expected to change over time according to the logistic equation:
[Eq. 1]
where the sum is taken over all variants that differ in fitness, p_i(0) is the initial frequency of type i, and time t is measured in days. Among the Delta PANGO lineages, only AY.25 and AY.27 reached a total frequency of > 2% over this time period in Canada, so we focused on a model with three types (AY.25, AY.27, and other Delta), measuring fitness relative to the other Delta sublineages (primarily assigned to B.1.617.2).
The likelihood of observing the sequence data within a province was then calculated using a trinomial distribution (Methods). Estimates of the four unknown parameters (p25(0), p27(0), s25, s27) were obtained by maximizing the likelihood of seeing all of the Delta data for the province. Analyses focusing on AY.27 sequences with S:Q613H were not substantially different from those presented with all AY.27 (data not shown), because S:Q613H comprised such a large portion of this lineage (Fig. 3). Again consistent with a founder event(s), the frequency of AY.25 rose very rapidly in British Columbia during June–July, when cases were low in the province (Fig. 6).
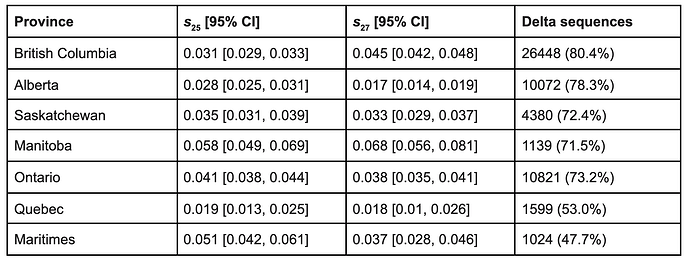
Delta sublineages AY.25 and AY.27 both show evidence of positive selection in all provinces analysed (Fig. 10, Table 1). Selection estimates ranged from 1.9–5.8% for AY.25 and from 1.7–6.8% for AY.27 among provinces. As described by equation [1], these selection coefficients give the rate of exponential increase per day of one sublineage relative to the average across all Delta lineages. Recently, AY.4.2, which like AY.27 bears S:A222V, was reported to have a selective advantage of 19% per week in the UK (UK Health Security Agency 2021a), which corresponds to a similar selective advantage per day of 2.7%. The S:A222V mutation has arisen multiple times independently, without evidence of a selective advantage or change in either antigenicity or viral entry into cells (Hodcroft et al. 2021). Nevertheless,the spread of S:A222V in both AY.4.2 in the UK and AY.27 in Canada suggests that it might have a weak advantage in the Delta genetic background. For context, the selection coefficients estimated for AY.25, AY.27, and AY.4.2 are weaker than the 6-11% advantage per day inferred for Alpha over preexisting SARS-CoV-2 lineages (Volz, Mishra, et al. 2021) (translating their advantage per generation into a measure per day) and also weaker than the 9.8% advantage per day of Delta over Alpha (Public Health England 2021).
Because of the large amount of data available ( > 1000 sequences for each province, Table 1), the confidence intervals for the selection coefficients are small and largely non-overlapping among provinces, but we caution that these differences may have several potential causes, ranging from epidemiologically relevant to sampling artefacts. Two potential explanations of biological relevance are that (a) selectively important mutations within each sublineage (Fig. 4 and 5) may differ in frequency among provinces (i.e., the PANGO designations may not coincide precisely with the functionally relevant mutations) and (b) the level of social restrictions has varied among provinces, with greater stringency reducing selection for mutations that have a transmission advantage (Otto et al. 2021). Potential artefacts include biased sampling for genomic sequencing, spatial heterogeneity within each province, and founder effects when different sublineages are, by chance, associated with outbreaks. Any of these artefacts could make the selection coefficients appear to be significantly different, even if they are in fact the same.

Figure 10. Frequency changes of AY.25 (green) and AY.27 (blue) over time in Canadian provinces. Area of each dot gives the total number of Delta sequences from that province each week (including B.1.617.2 and all AY sublineages). Frequency changes expected from equation [1] at the maximum likelihood point are given by the thick curve, with 100 thin curves drawn from a multi-normal distribution around this point based on the covariance matrix (Methods). Ontario data is based on VirusSeq submissions, because dates on GISAID were often incomplete. The maritime provinces were combined for sufficient counts (Nova Scotia, Newfoundland and Labrador, and New Brunswick).
Table 1. Maximum likelihood estimates of the selective advantage per day of AY.25 and AY.27 for each province with 95% confidence intervals based on profile likelihood (see Methods). The last column gives the number of Delta sequences (% of all sequences) submitted to GISAID (VirusSeq for Ontario) that were collected in Canada between May 15 and November 4, 2021.
Conclusions
We investigated evolutionary changes within the SARS-CoV-2 Delta variant, which now predominates in Canada. The AY sublineages of Delta span a significant amount of diversity, out of which two clades have grown disproportionately in size in Canada: AY.25 and AY.27. While the majority of AY.25 detections are in the United States, AY.27 is almost exclusively a Canadian clade.
We do not, at present, have definitive evidence of a change in transmission rate or evidence of a functionally important shift caused by the mutations carried by these Delta sublineages. We do, however, find repeated spread across different provinces consistent with selection coefficients in the range of 2–6% per day, similar to that recently reported for AY.4.2 (UK Health Security Agency 2021a). We note that these selective coefficients are relative to other circulating variants in each province and are not equivalent to absolute transmission rates.
A substantial caveat of these results is that provinces are not independent, and travelers among provinces would couple the dynamics (as emphasized by (Hodcroft et al. 2021) in the European context). Furthermore, differences, in the proportion of diagnosed COVID-19 cases that were sequenced, and in the strategy by which cases were prioritized for sequencing, can impact analyses of the relative population dynamics of sublineages, cluster composition and selection coefficients. Using only sequences that were obtained through representative population sampling would remove this bias, but this would require information not available at this time. Using a downsampled dataset would have other limitations as well.
Continued monitoring and coupling information about these variants with household transmission rates, vaccination status, and severity of case outcomes are important next steps to monitor the epidemiological importance of these Delta sub-lineages, in Canada and globally.
Acknowledgments and Data availability
We thank all the authors, developers, and contributors to the GISAID and VirusSeq database for making their SARS-CoV-2 sequences publicly available. We thank especially the Canadian Public Health Laboratory Network, academic sequencing partners, diagnostic hospital labs, and other sequencing partners for the provision of the Canadian sequence data used in this work. Genome sequencing was supported by a Genome Canada grant to the Canadian COVID-19 Genomic Network (CanCOGeN). This study was also supported by the Canadian Institutes for Health Research (CIHR) operating grant to the Coronavirus Variants Rapid Response Network (CoVaRR-Net). Data analyses were enabled by compute and storage resources provided by Compute Canada and Calcul Québec and an NSERC Discovery Grant to SPO (RGPIN-2016-03711). All sequences presented here are available through GISAID and the VirusSeq Portal. The complete list of IDs is available in this repository: GitHub - phac-nml/ay25ay27: Builds and sequence lists for virological.
Methods
Bioinformatics and Phylogenetics
SARS-CoV-2 genomes were downloaded from GISAID on 2021-11-06. Lineages were assigned using Pangolin with the pangoLEARN data release 2021-10-18.
The phylogenetic trees in Figures 4 and 5 were constructed using Augur by subsampling GISAID equally for up to 7500 Canadian and international AY.27 or AY.25 lineages while including a small number of more distantly related lineages for context. The resulting Newick files were combined with a database of mutations constructed using the Genomic Data Index (GitHub - apetkau/genomics-data-index: Indexes genomes using SNVs, MLST, or kmers for rapid querying, clustering, and visualization.). This software uses minimap2 and snpEff to identify mutations and regions with missing data, and stores the results in a database. The database was used to search for specific mutations and associated metadata (country/province/PANGO lineage) and to draw figures using the ETEToolkit. The mutations shown for AY.25 (Fig. 4) were chosen to highlight any large (≥15%) difference in the percent of samples with the mutation between Canadian and non-Canadian AY.25. The mutations shown for AY.27 (Fig. 5) were selected such that between 10% and 90% of AY.27 samples have the specific mutation; this range was chosen to profile the diversity of mutations within AY.27.
The phylogenetic tree in Fig. 1 was inferred by Maximum Likelihood in IQ-Tree (version 1.6.12) and then processed with TreeTime (version 0.7.5) to generate a time-stamped tree. For visualization, the full tree was downsampled by removing sequences at random to maintain a maximum of 50 sequences per day. Trees in Fig. 1 and 8 were rendered using ggtree in R.
Builds, trees, sample ID lists, and other supplementary files can be found at GitHub - phac-nml/ay25ay27: Builds and sequence lists for virological
Epitopes
Epitope data was obtained from an experimental study by (Shrock et al. 2020). IgG and IgA z-scores of SARS-CoV-2 qPCR-positive patients were averaged to show the overall support of epitope activity for a specific genome site. Here, we classified z-scores below 1 as low support, z-scores between 1 and 5 as moderate support, and z-scores above 5 as high support. Genome locations for which epitope activity was not assessed are shown in grey.
Selection Advantage
To estimate selection, we used standard likelihood techniques. In brief, the data consisted of the number of three Delta sub-types (AY.25, AY.27, and all other Delta sub-types), binned by week for ease of computation. The selection coefficients for AY.25 (s25) and AY.27 (s27), as well as their initial frequencies on May 15, 2021 (p25(0) and p27(0), respectively) were fit by maximizing the likelihood function:
This likelihood function is based on the trinomial distribution (dropping the trinomial coefficient, which is constant, given the data). Calculations were performed on the log of the likelihood (lnL), maximizing the probability of observing the data across all time points within a province. The 95% confidence intervals were obtained by shifting a given parameter away from its maximum likelihood point, refitting all other parameters, until 2lnL dropped by chi-squared(1,0.95) (Table 1).
The likelihood is approximately multi-normal around the maximum likelihood peak, with a variance-covariance matrix given by the inverse matrix of –1 times the Hessian matrix, which contains the double derivatives of lnL evaluated at the maximum likelihood point (Pawitan 2001). Using the variance estimates for s25 and s27 to obtain 95% confidence intervals (+/- 1.96 times the square-root of the variance), yielded nearly identical intervals to Table 1. Random draws of the four parameters from this multi-normal distribution were used to illustrate uncertainty in the fits to equation [1] (Fig. 10); occasionally, these random draws led to a negative initial allele frequency, in which case the initial frequency was set to 1e-6. Note that other sources of uncertainty (e.g., biased sampling and drift) and heterogeneity in Delta sublineages within each province are not captured.
References
Balaban, Metin, Niema Moshiri, Uyen Mai, Xingfan Jia, and Siavash Mirarab. 2019. “TreeCluster: Clustering Biological Sequences Using Phylogenetic Trees.” PloS One 14 (8): e0221068.
Boni, Maciej F., Philippe Lemey, Xiaowei Jiang, Tommy Tsan-Yuk Lam, Blair W. Perry, Todd A. Castoe, Andrew Rambaut, and David L. Robertson. 2020. “Evolutionary Origins of the SARS-CoV-2 Sarbecovirus Lineage Responsible for the COVID-19 Pandemic.” Nature Microbiology. https://doi.org/10.1038/s41564-020-0771-4.
Brown, Catherine M., Johanna Vostok, Hillary Johnson, Meagan Burns, Radhika Gharpure, Samira Sami, Rebecca T. Sabo, et al. 2021. “Outbreak of SARS-CoV-2 Infections, Including COVID-19 Vaccine Breakthrough Infections, Associated with Large Public Gatherings - Barnstable County, Massachusetts, July 2021.” MMWR. Morbidity and Mortality Weekly Report 70 (31): 1059–62.
Cherian, Sarah, Varsha Potdar, Santosh Jadhav, Pragya Yadav, Nivedita Gupta, Mousumi Das, Partha Rakshit, et al. 2021. “SARS-CoV-2 Spike Mutations, L452R, T478K, E484Q and P681R, in the Second Wave of COVID-19 in Maharashtra, India.” Microorganisms 9 (7). https://doi.org/10.3390/microorganisms9071542.
Chi, Xiangyang, Renhong Yan, Jun Zhang, Guanying Zhang, Yuanyuan Zhang, Meng Hao, Zhe Zhang, et al. 2020. “A Neutralizing Human Antibody Binds to the N-Terminal Domain of the Spike Protein of SARS-CoV-2.” Science 369 (6504): 650–55.
Elliott, Paul, David Haw, Haowei Wang, Oliver Eales, Caroline E. Walters, Kylie E. C. Ainslie, Christina Atchison, et al. 2021. “Exponential Growth, High Prevalence of SARS-CoV-2, and Vaccine Effectiveness Associated with the Delta Variant.” Science, eabl9551.
Freed, Nikki E., Markéta Vlková, Muhammad B. Faisal, and Olin K. Silander. 2020. “Rapid and Inexpensive Whole-Genome Sequencing of SARS-CoV-2 Using 1200 Bp Tiled Amplicons and Oxford Nanopore Rapid Barcoding.” Biology Methods & Protocols 5 (1): bpaa014.
Greaney, Allison J., Tyler N. Starr, Pavlo Gilchuk, Seth J. Zost, Elad Binshtein, Andrea N. Loes, Sarah K. Hilton, et al. 2021. “Complete Mapping of Mutations to the SARS-CoV-2 Spike Receptor-Binding Domain That Escape Antibody Recognition.” Cell Host & Microbe 29 (1): 44–57.e9.
Hodcroft, Emma B., Moira Zuber, Sarah Nadeau, Timothy G. Vaughan, Katharine H. D. Crawford, Christian L. Althaus, Martina L. Reichmuth, et al. 2021. “Spread of a SARS-CoV-2 Variant through Europe in the Summer of 2020.” Nature 595, 707–712.
Kannan, Saathvik R., Austin N. Spratt, Alisha R. Cohen, S. Hasan Naqvi, Hitendra S. Chand, Thomas P. Quinn, Christian L. Lorson, Siddappa N. Byrareddy, and Kamal Singh. 2021. “Evolutionary Analysis of the Delta and Delta Plus Variants of the SARS-CoV-2 Viruses.” Journal of Autoimmunity 124 (November): 102715.
Li, Qianqian, Jiajing Wu, Jianhui Nie, Li Zhang, Huan Hao, Shuo Liu, Chenyan Zhao, et al. 2020. “The Impact of Mutations in SARS-CoV-2 Spike on Viral Infectivity and Antigenicity.” Cell 182 (5): 1284–94.e9.
Liu, Zhuoming, Laura A. VanBlargan, Louis-Marie Bloyet, Paul W. Rothlauf, Rita E. Chen, Spencer Stumpf, Haiyan Zhao, et al. 2021. “Identification of SARS-CoV-2 Spike Mutations That Attenuate Monoclonal and Serum Antibody Neutralization.” Cell Host & Microbe 29 (3): 477–88.e4.
McCallum, Matthew, Jessica Bassi, Anna De Marco, Alex Chen, Alexandra C. Walls, Julia Di Iulio, M. Alejandra Tortorici, et al. 2021. “SARS-CoV-2 Immune Evasion by Variant B.1.427/B.1.429.” bioRxiv. https://doi.org/10.1101/2021.03.31.437925.
McCallum, Matthew, Alexandra C. Walls, Kaitlin R. Sprouse, John E. Bowen, Laura Rosen, Ha V. Dang, Anna deMarco, et al. 2021. “Molecular Basis of Immune Evasion by the Delta and Kappa SARS-CoV-2 Variants.” bioRxiv. https://doi.org/10.1101/2021.08.11.455956.
Otto, Sarah P., Troy Day, Julien Arino, Caroline Colijn, Jonathan Dushoff, Michael Li, Samir Mechai, et al. 2021. “The Origins and Potential Future of SARS-CoV-2 Variants of Concern in the Evolving COVID-19 Pandemic.” Current Biology: CB 0 (0). https://doi.org/10.1016/j.cub.2021.06.049.
Pawitan, Yudi. 2001. In All Likelihood: Statistical Modelling and Inference Using Likelihood. OUP Oxford.
Planas, Delphine, David Veyer, Artem Baidaliuk, Isabelle Staropoli, Florence Guivel-Benhassine, Maaran Michael Rajah, Cyril Planchais, et al. 2021. “Reduced Sensitivity of SARS-CoV-2 Variant Delta to Antibody Neutralization.” Nature 596 (7871): 276–80.
Public Health England. 2021. “SARS-CoV-2 Variants of Concern and Variants under Investigation in England, Technical Briefing 15,” June 2021. https://assets.publishing.service.gov.uk/government/uploads/system/uploads/attachment_data/file/993879/Variants_of_Concern_VOC_Technical_Briefing_15.pdf[.](http://paperpile.com/b/8jf7Yz/9zYE)
Sanderson, Theo, and Jeffrey C. Barrett. 2021. “Variation at Spike Position 142 in SARS-CoV-2 Delta Genomes Is a Technical Artifact Caused by Dropout of a Sequencing Amplicon.” bioRxiv. https://doi.org/10.1101/2021.10.14.21264847.
Shen, Lishuang, Timothy J. Triche, Jennifer Dien Bard, Jaclyn A. Biegel, Alexander R. Judkins, and Xiaowu Gai. 2021. “Spike Protein NTD Mutation G142D in SARS-CoV-2 Delta VOC Lineages Is Associated with Frequent Back Mutations, Increased Viral Loads, and Immune Evasion.” bioRxiv. https://doi.org/10.1101/2021.09.12.21263475.
Shrock, Ellen, Eric Fujimura, Tomasz Kula, Richard T. Timms, I-Hsiu Lee, Yumei Leng, Matthew L. Robinson, et al. 2020. “Viral Epitope Profiling of COVID-19 Patients Reveals Cross-Reactivity and Correlates of Severity.” Science 370 (6520). https://doi.org/10.1126/science.abd4250.
Suryadevara, Naveenchandra, Swathi Shrihari, Pavlo Gilchuk, Laura A. VanBlargan, Elad Binshtein, Seth J. Zost, Rachel S. Nargi, et al. 2021. “Neutralizing and Protective Human Monoclonal Antibodies Recognizing the N-Terminal Domain of the SARS-CoV-2 Spike Protein.” Cell 184 (9): 2316–31.e15.
UK Health Security Agency. 2021a. “SARS-CoV-2 Variants of Concern and Variants under Investigation in England – Technical Briefing 27.” https://assets.publishing.service.gov.uk/government/uploads/system/uploads/attachment_data/file/1029715/technical-briefing-27.pdf[.](http://paperpile.com/b/8jf7Yz/NUVCn)
———. 2021b. “SARS-CoV-2 Variants of Concern and Variants under Investigation in England Technical Briefing 26,” October 2021. https://assets.publishing.service.gov.uk/government/uploads/system/uploads/attachment_data/file/1028113/Technical_Briefing_26.pdf[.](http://paperpile.com/b/8jf7Yz/9m2XI)
Volz, Erik, Verity Hill, John T. McCrone, Anna Price, David Jorgensen, Áine O’Toole, Joel Southgate, et al. 2021. “Evaluating the Effects of SARS-CoV-2 Spike Mutation D614G on Transmissibility and Pathogenicity.” Cell 184 (1): 64–75.e11.
Volz, Erik, Swapnil Mishra, Meera Chand, Jeffrey C. Barrett, Robert Johnson, Lily Geidelberg, Wes R. Hinsley, et al. 2021. “Assessing Transmissibility of SARS-CoV-2 Lineage B.1.1.7 in England.” Nature 593 (7858): 266–69.
Wang, Zijun, Fabian Schmidt, Yiska Weisblum, Frauke Muecksch, Christopher O. Barnes, Shlomo Finkin, Dennis Schaefer-Babajew, et al. 2021. “mRNA Vaccine-Elicited Antibodies to SARS-CoV-2 and Circulating Variants.” Nature, https://doi.org/10.1038/s41586-021-03324-6.


