Sarah Nadeau
Visiting Postdoc, Fred Hutchinson Cancer Research Center
[email protected]
This is a write-up I put together during a two-month visit to Erick Matsen’s group. Many thanks to Erick and his group for supporting the project. Thanks also to Jakob McBroome, Christopher Gulvik, and Jay Gee for helpful comments. Any errors are entirely my own.
Problem statement
Identifying transmission clusters in a pathogen outbreak - epidemiologically linked cases - is key to identifying at-risk individuals and preventing new infections. In recent years, molecular data is increasingly used to help identify transmission clusters (e.g. whole-genome sequencing, multi-locus sequence typing). However, different analysis methods are used by different groups focusing on different pathogens. This makes it difficult to generalize molecular transmission cluster detection to new applications. Here, I aim to provide a resource for researchers and public health officials to assist in selecting and using a molecular transmission cluster detection method.
Executive summary
I compared four methods for molecular transmission cluster detection on two outbreak data sets (one bacterial, one viral) with publicly available whole-genome sequencing data. Methods were chosen to represent increasingly complex assumptions and were assessed for (i) performance and (ii) ease of use. ClusterTracker and Nextstrain’s augur ran quickly and performed generally well out-of-the-box for both outbreaks. In particular, Nextstrain seems to represent a sweet spot between simplistic assumptions and bespoke modeling. All methods would benefit from additional tuning to outbreak specifics. However, this comparison highlights that even non-optimized usage can provide valuable information on case clustering.
Code resources
Nextflow modules are available to run HIV-TRACE, ClusterTracker, and Nextstrain augur using reproducible container computing environments (Docker images). Nextflow workflows are available to run all three methods on either a bacterial dataset or a SARS-CoV-2 dataset. All code is accessible at GitHub - SarahNadeau/cluster-detection.
Supporting analyses
Transmission cluster definition
Different tools estimate epidemiological linkage differently, so the precise definition for a molecular transmission cluster depends on the tool used. For HIV-TRACE, a transmission cluster is a group of cases whose infecting strains are more closely related to one another than generally circulating strains. For ClusterTracker, Nextstrain augur, and BEAST, a transmission cluster is a group of cases whose infecting strains descend from a common ancestor corresponding to a pathogen introduction into a new population.
Case study outbreak data
I selected one bacterial and one viral outbreak for analysis. Based on epidemiological data, we have strong evidence that each outbreak corresponds to a single transmission cluster. The bacterial outbreak is a Klebsiella aerogenes outbreak in a hospital cardiothoracic intensive care unit (CICU) described by Malek et al. (2019). 15 cases were identified in the CICU over a 6-month period. The viral outbreak is a SARS-CoV-2 super-spreading event at a business conference described by Lemiux et al. (2021). Approximately 100 cases were linked to the 2-day conference by public health contact tracing. These case studies represent different pathogen types, epidemic scales, and genome sampling intensities (Table 1).
To evaluate whether cases comprise one or more transmission clusters, “context” genomes from generally circulating strains are required for comparison. I followed roughly the same procedures as the original publications to select context strains for each outbreak (Table 1). The context set for K. aerogenes represents nearly all sequenced diversity of this pathogen available on GenBank at the time of the original study, plus several strains from the same hospital but epidemiologically unlinked to the CICU outbreak. The context set for SARS-CoV-2 is a down-sample of all available diversity. I performed three replicate down-samplings, each time selecting the same most genetically similar context sequences but different random sequences stratified by global region and month. K. aerogenes samples were annotated as from the hospital or by country of sampling. SARS-CoV-2 samples were annotated as from the conference or by administrative division of sampling.
Table 1. Case study outbreak data. Sequenced outbreak cases were analyzed together with context strains from GenBank. CICU = Cardiothoracic Intensive Care Unit, No. = number.
| Outbreak | K. aerogenes in the CICU | SARS-CoV-2 superspreading |
|---|---|---|
| Pathogen type | Bacteria | Virus |
| No. outbreak cases (No. sequenced) | 15 (15) | ~100 (28) |
| Outbreak duration | June - November 2017 | February 26 - 27, 2020 |
| No. and description for context strains | 9 epidemiologically unlinked strains from the same hospital collected 2015 - 2017. 110 clinical and surveillance strains from GenBank. | 100 most genetically similar strains from GenBank. 166 strains selected randomly by month and global region from GenBank. |
| Context strain selection method | Context strains are the same as used in the original study. Strains represent nearly all high-quality sequences available at the time. | Context strains selected using augur filter. GenBank data was filtered to collection date before July 1 2020. |
Methods compared
I selected four methods to identify transmission clusters in the case-study data. The selected methods represent a range of assumptions used for molecular cluster detection (Table 2) and are all actively used in public health. Here, each method is briefly introduced.
HIV-TRACE (Pond et al, 2018) is a genetic distance-based clustering tool supported by the U.S. Centers for Disease Control and Prevention. It was conceptualized for HIV and has been successfully applied in this context (Oster et al, 2021). The distance-based approach is generalizable to a range of pathogens and has more recently been implemented in the browser-based tool MicrobeTrace (Campbell et al, 2021). I selected HIV-TRACE for comparison because MicrobeTrace is not yet available as a command-line tool.
ClusterTracker (McBroome et al, 2022) is a recently-developed heuristic method for identifying clusters from a pathogen phylogeny. ClusterTracker was conceptualized to detect clusters corresponding to regional introduction events on very large SARS-CoV-2 phylogenies (up to millions of strains). It is currently used for live SARS-CoV-2 cluster detection in the U.S. (https://clustertracker.gi.ucsc.edu/). I selected ClusterTracker as a representative phylogenetic heuristic method and to evaluate its generalizability to smaller outbreak data sets.
Nextstrain’s augur (Hadfield et al, 2018) utilizes maximum likelihood methods implemented in TreeTime (Sagulenko et al, 2018) to construct a time-scaled phylogeny and then, in a separate step, estimate trait values at ancestral nodes. It has been used for live monitoring of pathogen evolution and geographic spread for a variety of pathogens, including SARS-CoV-2 (https://nextstrain.org/). I selected this method due to its extensive use in public health outbreak monitoring.
BEAST (Drummond & Rambaut, 2007) implements a joint method for phylogenetic inference and estimating trait values at ancestral nodes in a Bayesian framework (Lemey et al, 2009). Markov Chain Monte-Carlo (MCMC) results can be summarized into a consensus tree with information on phylogenetic and trait value uncertainty. This method is extensively used in scientific publications for evaluating pathogen evolution and geographic spread. High-profile SARS-CoV-2 examples include Worobey et al (2020) and Lemieux et al (2021). I selected this method due to its extensive use in research papers with public health implications.
Table 2. Assumptions of different molecular cluster detection methods compared. Note that region refers to a geographic location in this context, though it is possible to use any relevant trait data to inform cluster detection (e.g. host species or risk factor groups). MCMC = Markov Chain Monte-Carlo.
| Method | Category | Clustering assumptions | Limitations |
|---|---|---|---|
| HIV-TRACE | Distance method | Clusters are based on genetic distances under a TN93 model being less than a user-defined distance threshold. | No constraint of an underlying transmission tree. No penalty for unrealistically few/many introductions. |
| ClusterTracker | Phylogenetic discrete trait heuristic method | Ancestral trait inference based on genetic distance to and proportion of descendant tips in each region. Per-sample cluster assignment determined by a heuristic involving ancestral trait estimates. | No penalty for unrealistically few/many introductions. No correction for biased sampling by region. Clusters constrained to be single-region. |
| Nextstrain’s augur | Phylogenetic discrete trait substitution model in Maximum- likelihood framework | Ancestral trait inference based on modeling migration as a continuous-time Markov chain substitution process occurring along the phylogeny. | No priors on the overall or relative migration rates. Region does not influence phylogenetic reconstruction. Complicated to correct for biased sampling by region. Does not directly output cluster assignment. |
| BEAST | Phylogenetic discrete trait substitution model in Bayesian framework | Same as above. Phylogeny and migration history are co-inferred, so that region can influence phylogenetic reconstruction. | MCMC inference procedure does not scale well with many regions, samples. Complicated to correct for biased sampling by region. Does not directly output cluster assignment. |
Method performance
Aim (i) is to evaluate method performance on the case-study outbreaks. The primary evaluation criterion is how well each method groups the known outbreak cases into a singular outbreak transmission cluster. I additionally consider whether any context samples linked to the outbreak transmission clusters are epidemiologically plausible. In light of the methods used, an outbreak transmission cluster is a genetic distance-based cluster containing at least one outbreak strain (HIV-TRACE), a ClusterTracker cluster of outbreak strains, or strains descending from a node where an introduction into the outbreak region is inferred (Nextstrain augur and BEAST).
When comparing results, it is important to note that I used a different geographic resolution for ClusterTracker and Nextstrain augur analysis compared to BEAST. The same samples were analyzed, but for BEAST location information was aggregated to global regions to reduce the number of parameters for MCMC inference. In Figures 1-3, locations are colored by whether they correspond to the outbreak location (the CICU or the business conference), whether they are from a focal context region (the hospital or the state of Massachusetts), or whether they are from another context region (a different country or administrative division). The difference in geographic resolution between BEAST and the other analyses is emphasized by using a fourth color corresponding to other (global) regions.
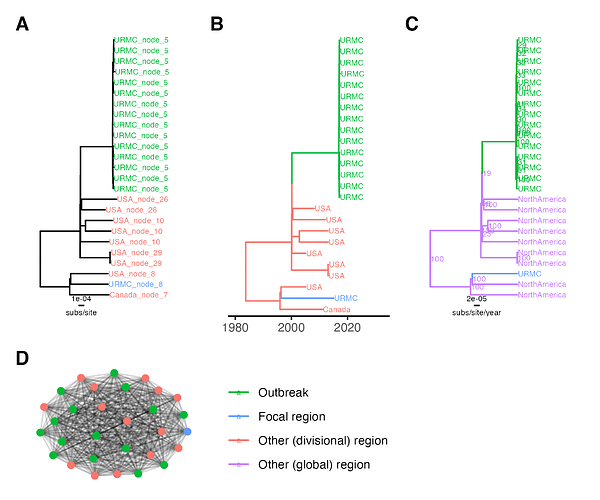
Figure 1. K. aerogenes outbreak transmission cluster results. (A) Outbreak clade in IQ-TREE tree, tip labels are ClusterTracker clusters. (B) Outbreak clade in augur tree, tip labels are sampling location and branch colors are ancestral location. (C) Outbreak clade in BEAST maximum clade credibility tree, node labels are posterior support and branch colors are ancestral location. (D) HIV-TRACE outbreak cluster, edge lengths are arbitrary. Locations are collapsed for tip/branch coloring into outbreak, focal region (unlinked hospital case), or other region. subs/site = substitutions/site.
For the bacterial outbreak, all methods successfully identify a singular outbreak transmission cluster. The HIV-TRACE cluster includes the 15 outbreak strains, one unlinked hospital strain, and 14 other context strains, mostly from North America (Figure 1D). The phylogenetic methods all reconstruct the 15 outbreak strains as a monophyletic clade, with the unlinked hospital strain more distantly related to this clade than other North American context strains (Figure 1). In summary, all methods successfully cluster the K. aerogenes CICU outbreak cases together. The phylogenetic methods successfully cluster known unlinked cases apart, as would the distance-based method with a stricter distance threshold.
Interestingly, ClusterTracker estimates multiple introductions to the USA near the K. aerogenes CICU outbreak clade (Figure 1A). This is because intensive sampling at the hospital combined with a lack of other available context sequences means ClusterTracker infers branches high in the phylogeny are located at the hospital and subsequent strains in the USA are exported clusters. Although this does not affect the outbreak transmission cluster result, it is worth noting the heuristic’s sensitivity to sampling bias.
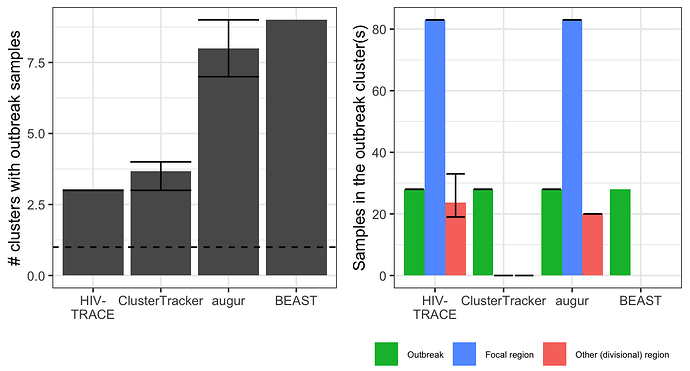
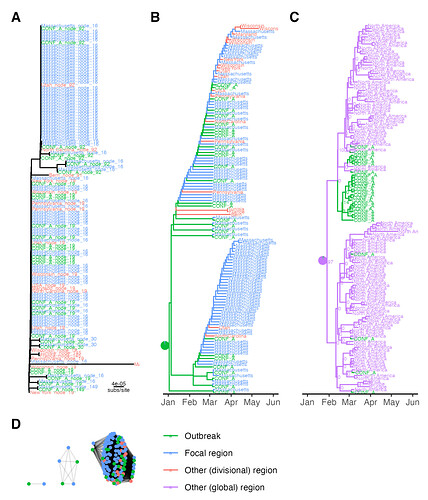
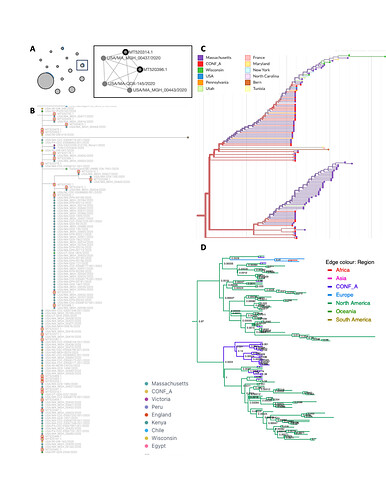
For the SARS-CoV-2 outbreak, the different methods identified between 3 and 9 outbreak transmission clusters (Figure 2). HIV-TRACE was closest to identifying a singular outbreak transmission cluster, with outbreak cases divided into three clusters at the genetic distance threshold used. ClusterTracker performed comparably, identifying 3 - 4 outbreak transmission clusters depending on the context set replicate. In this case, ClusterTracker’s heuristics helped it group same-region strains at and descending from large polytomies (Figure 3A).
Figure 2. Number and composition of SARS-CoV-2 outbreak transmission clusters. Left shows the number of outbreak transmission clusters identified by each method (the dotted line is the epidemiological ground truth at 1). Right shows the composition of these clusters. Strains in the outbreak transmission cluster(s) are grouped by sample type into outbreak samples, focal region samples (from Massachusetts), or other samples (from any other administrative division). Error bars show minimum and maximum values attained across three replicate SARS-CoV-2 alignments (different random context samples). Bars show the mean values across the three replicates. Note that BEAST was only run on one alignment, hence the lack of error bars.
Figure 3. SARS-CoV-2 outbreak transmission cluster results for one context set. (A) Outbreak clade in IQ-TREE tree, tip labels are ClusterTracker introduction. (B) Outbreak clade in augur tree, tip labels are sampling location and branch colors are ancestral location. Pie chart shows location confidence at the clade’s most recent common ancestor (MRCA). (C) Outbreak clade in BEAST maximum clade credibility tree, node labels are posterior support and branch colors are ancestral location. Pie chart shows location confidence at the clade’s MRCA. (D) HIV-TRACE outbreak clusters, edge lengths are arbitrary. Locations are collapsed for tip/branch coloring into outbreak, focal region (Massachusetts), or other (divisional or global) region. subs/site = substitutions/site.
Despite the difference in geographic resolution used and markedly different ancestral trait reconstructions (Figure 3B-C) Nextstrain augur and BEAST each identified up to 9 outbreak transmission clusters. Nextstrain appears to under-cluster outbreak samples due to polytomy resolution irrespective of sample locations, while BEAST over-clusters them into several tight clades near the tips. The Nextstrain result suggests extensive down-stream transmission from the conference, while BEAST suggests no spillover transmission under the default priors used (Figure 3B-C). The original study (Lemieux et al, 2021) described extensive downstream transmission, making the Nextstrain augur result more plausible. It is also notable that HIV-TRACE and augur both link samples predominantly from Massachusetts to the outbreak. This makes sense, since the superspreading event occurred in Boston.
It is somewhat surprising that no method clustered all the SARS-CoV-2 outbreak strains together. Evidently some outbreak strains are more related to context strains than to other outbreak strains (i.e. leading to the HIV-TRACE result). Possible explanations include sequencing errors, within-host mutations in outbreak cases before onward transmission and sampling (outbreak cases were sampled up a week after the conference), or multiple truly independent introductions into the conference. The first two points represent general limitations to the molecular transmission cluster detection approach. The latter shows how it can generate new hypotheses about outbreak origins.
Ease of use
Aim (ii) is to evaluate the ease of use of each method. In this section, I document some of the stumbling blocks I encountered, as well as the more attractive features of each method from a user standpoint. All methods except BEAST ran quite quickly on the relatively small data sets analyzed (Table 3).
Table 3. Benchmarking results on case-study data. The K. aerogenes SNP alignment has 137 taxa and 190,775 sites, while the SARS-CoV-2 whole-genome alignment has 294 taxa and 29,903 sites. All commands were run using a single CPU. s = seconds, m = minutes, h = hours.
| Method | Command run | Runtime K. aerogenes | Runtime SARS-CoV-2 |
|---|---|---|---|
| HIV-TRACE | hiv-trace | 5s | 4s |
| ClusterTracker | usher | 19s | 1s |
| ClusterTracker | matUtils introduce | 3s | 2s |
| augur | augur refine | 5m 36s | 2m 49s |
| augur | augur traits | 9s | 18s |
| BEAST | beast | 11.4h / million states | 0.43h / million states |
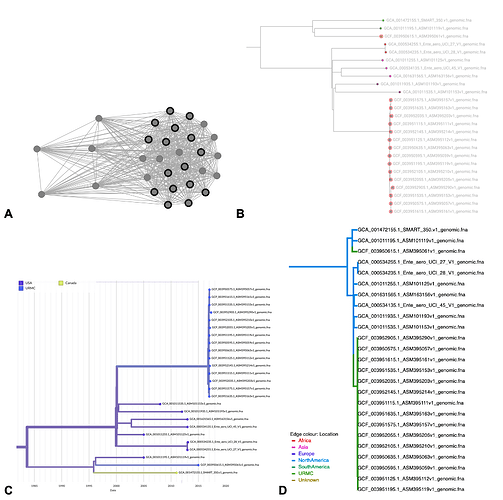
The main challenge for the distance-based method HIV-TRACE was selecting an appropriate distance threshold for each outbreak. It was particularly difficult to a priori select a threshold for K. aerogenes without much information on its evolutionary rate and infectious period. A rough conversion was also required to convert from genome-wide distance to variable-sites-only distance, since the bacterial core-genome alignment tool I used (ParSNP) outputs a variable-sites-only alignment. Finally, HIV-TRACE does not output confidence values to help interpret cluster assignments. HIV-TRACE results can be explored interactively at HIV-TRACE (see example screenshots in Figures S1, S2).
ClusterTracker was straightforward to use via the command line tool suite matUtils. It requires a phylogenetic tree, a VCF file, and a metadata file linking strain names to trait data. ClusterTracker does not require sample date information, simplifying metadata curation. One downside to the heuristic approach is that results interpretation is complicated by multiple heuristics interacting to influence cluster assignments. Furthermore, a polytomy can represent multiple introductions into different regions, confusing interpretation of ancestral trait reconstruction. A primary advantage of both HIV-TRACE and ClusterTracker is that they directly output cluster assignments for each sample. ClusterTracker results can also be exported to formats compatible with interactive phylogenetic visualization at https://taxonium.org/ or https://auspice.us/.
Nextstrain’s augur was also straightforward to use as a command-line tool. The augur traits tool requires only a phylogenetic tree and a metadata file, which may include missing data in pre-specified formats. Using augur did involve a few more hiccups with metadata formatting and updating to the latest version for bug-fixes. In return, I got a one-stop-shop for phylogenetic analysis, including the augur filter tool, which I used to perform repeated down-sampling of context strains for the SARS-CoV-2 superspreading analysis. Nextstrain results can be exported for interactive phylogenetic visualization at https://auspice.us/. Since Nextstrain is not specifically designed for transmission cluster detection, I assigned strains to clusters using custom code based on the node-annotated tree output.
BEAST was the most complicated method to use, and as a result I ran it manually. I set up each analysis using the BEAUti software, which involved several rounds of trial-and-error. I tweaked the model several times to improve MCMC mixing as well (e.g., reduced number of locations). A primary downside to BEAST was the extensive runtime. However, the Bayesian method outputs detailed uncertainty information on ancestral trait values, the phylogeny, and all other free parameters. BEAST results can be summarized into a consensus tree and visualized at https://icytree.org/. BEAST is also not specifically designed for transmission cluster detection, so I assigned strains to clusters using custom code based on the consensus tree output.
Conclusions and caveats
The results presented here are based on only two case study data sets. However, this approach was sufficient to illustrate some of the big-picture advantages and disadvantages of each transmission cluster detection method. The distance-based method (HIV-TRACE), phylogenetic heuristic method (ClusterTracker), and the maximum-likelihood discrete trait substitution method (Nextstrain augur) all ran quickly enough on several hundred sequences to be applicable for real-time analysis of moderately sized outbreaks. Of these, ClusterTracker and augur reconstructed known outbreak clusters well despite a lack of method optimization (HIV-TRACE would require fine-tuning the genetic distance threshold). Nextstrain in particular was useful for identifying downstream community transmission in the SARS-CoV-2 outbreak. Thus, Nextstrain seems to represent a sweet spot between simplistic assumptions and bespoke modeling.
There are two primary caveats to the results presented here. These factors should be carefully considered when applying molecular transmission cluster detection in real outbreak scenarios.
First, the choice of non-outbreak (context) strains used to contextualize an outbreak analysis can strongly influence molecular cluster detection results. For instance, the number of context strains required to evaluate whether outbreak strains are really more related to one another than to generally circulating strains depends on local pathogen diversity, which may vary by region. Including more context strains increases the chances of finding a strain that splits an outbreak into multiple clusters or suggests spillover transmission. It is also important to note that it is impossible to reconstruct ancestral traits not represented in the analyzed data. Using less granular trait information (e.g. global regions rather than administrative divisions) can help avoid spurious confidence in detailed ancestral trait reconstruction when many regions are not represented in the data (like in the K. aerogenes case study). For densely sequenced pathogens like SARS-CoV-2, replicate or alternate down-samplings can be done to assess the robustness of analysis results. Regardless, any transmission cluster links identified by molecular analysis are putative and should ideally be confirmed with independent epidemiological data.
Lastly, molecular cluster detection results depend on subjective data preprocessing choices and method optimization. For heavily recombining pathogens or pathogens under strong selection, one can mask sites that do not reflect vertical inheritance prior to analysis. Masking sites prone to sequencing error vastly improved clustering results for the SARS-CoV-2 case study described here (e.g. masking reduced the number of outbreak clusters using HIV-TRACE from 6 to 3). Finally, each method has tunable parameters that can be optimized for a particular pathogen or outbreak scenario. These include the genetic distance threshold used in HIV-TRACE, a minimum branch length parameter in ClusterTracker to collapse closely related clusters, correction factors to account for biased sampling in Nextstrain, and priors on parameters in BEAST. Minimal tuning was done for the case-study analyses presented here in order to naively evaluate each method. However, incorporating additional information about each pathogen and outbreak would almost certainly improve results further.
Extended methods
Data collection and sequence alignment
Metadata was manually assembled from supplemental material and figures in Malek et al. (2019) and Lemieux et al. (2021) or from GenBank. Sequence data was manually downloaded from GenBank. Metadata files including GenBank identifiers are available on the project GitHub repository at GitHub - SarahNadeau/cluster-detection.
SARS-CoV-2 context strains were selected using Nextstrain augur’s ‘filter’ command, run twice on all SARS-CoV-2 genomes available on GenBank (this is provided as a Nextstrain data resource). The first time was to select a set of most genetically similar context strains to outbreak strains. I used options “–min-length 20000 --max-date ‘2020-07-01’ --subsample-max-sequences 100 --exclude <outbreak strains>”. The second time was to select a set of random context strains stratified by global region and month, to provide clock signal and broader phylogenetic context. I used options “–min-length 20000 --max-date ‘2020-07-01’ --group-by region year month --subsample-max-sequences 200 --exclude <outbreak strains and already selected strains>”.
I aligned the K. aerogenes sequences to reference NC_015663v1 with ParSNP (Treangen et al, 2014) and the SARS-CoV-2 sequences to reference NC_045512v2 with MAFFT (Katoh & Standley, 2013) in the matUtils Docker image. I masked problematic sites in the SARS-CoV-2 alignment using the VCF file provided by de Maio et al. (2020) prior to further analysis.
Method-specific parameters
HIV-TRACE was run with options “–threshold 0.1 --ambiguities average --minoverlap 1 --fraction 0.25” for K. aerogenes and options ““–threshold 0.0000667 --ambiguities skip --minoverlap 1 --fraction 0.25” for SARS-CoV-2. The 10% distance threshold for K. aerogenes corresponds to ~0.5% distance at the whole-genome scale. The 0.00667% distance threshold for SARS-CoV-2 was selected to correspond to ~1 month of independent evolution (assuming a substitution rate of 0.0008 substitutions per site per year).
ClusterTracker requires a phylogenetic tree for input. For K. aerogenes, I used ParSNP with all default options to infer a phylogeny from the core-genome SNP alignment. ParSNP in turn uses FastTree2 (Price et al, 2010). For SARS-CoV-2, I used IQ-TREE 2 (Minh et al, 2020) to infer a phylogeny from the whole-genome alignment with options “-o NC_045512v2 -ntmax 2 -m HKY+F+G4”. I converted the SNP- and whole-genome alignments, respectively, to VCF files using the matUtils script ‘faToVcf’ and then used the tree and VCF files to generate mutation-annotated tree files using the ‘usher’ command. Finally, I ran ‘matUtils introduce’ using all default options to identify introductions from the mutation-annotated tree and metadata files.
Nextstrain’s augur was run starting from the VCF file output by ParSNP for K. aerogenes and from the IQ-TREE 2 output for SARS-CoV-2. I used the ‘refine’ and ‘traits’ commands. For K. aerogenes, I ran ‘refine’ with options “–coalescent opt --root reference_NC_015663v1.fna.ref” and for SARS-CoV-2 I used the options “–coalescent opt --date-confidence --clock-rate 0.0008 --clock-std-dev 0.004 --root NC_045512v2” based on Nextstrain’s ncov build (GitHub - nextstrain/ncov: Nextstrain build for novel coronavirus SARS-CoV-2). I ran ‘traits’ with all default options.
I set up BEAST XML files for both analyses using the BEAUti graphical user interface. For K. aerogenes, I ignored tip dates because many sequences have unknown or incomplete dates. For both analyses, I used a HKY + Γ nucleotide substitution model with empirical base frequencies and 4 categories for rate variation. I used a strict clock fixed to an arbitrary rate 1 for K. aerogenes (branch lengths in substitutions/site/year) and with a very strong Normal(mean = 0.0008, stdev = 4E-10) prior for SARS-CoV-2. Fixing the SARS-CoV-2 clock rate caused an error in the likelihood calculation that I did not debug further. For both analyses, I used a strict clock for the location substitution model, allowed asymmetric rates of location change, and used a CTMC rate reference prior. I used a constant-population-size coalescent tree prior for K. aerogenes and an exponential-growth coalescent tree prior for SARS-CoV-2. I used a UPGMA starting tree for K. aerogenes and a random starting tree for SARS-CoV-2. I manually added information on the number of invariant A, C, T, and G sites to the K. aerogenes XML file. All other priors, operators, and MCMC specifications were left at default values set by BEAUti. The final XML files are available on the project GitHub.
Summarizing BEAST MCMC output
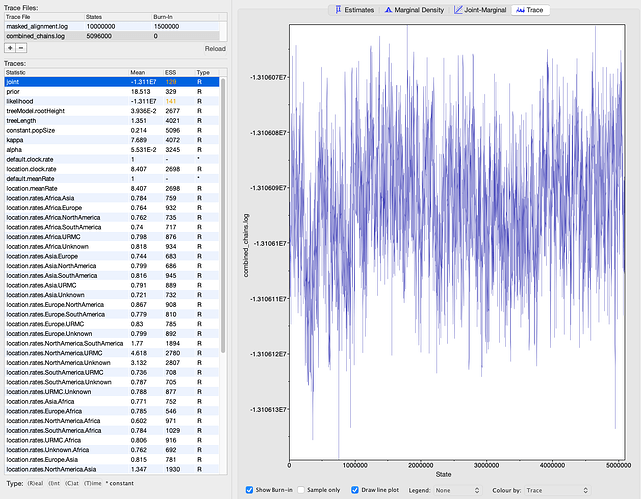
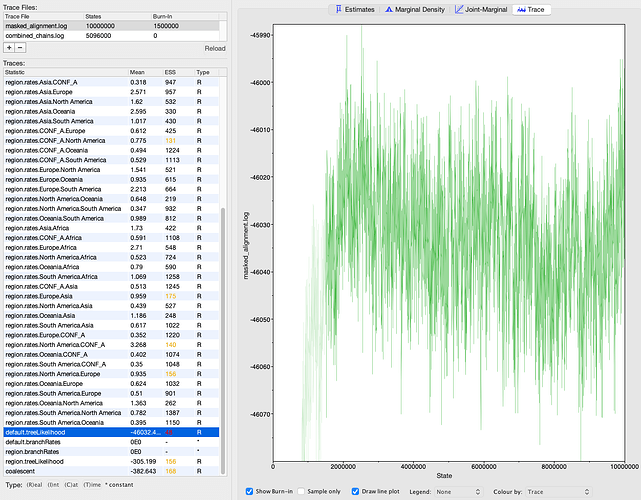
I ran the K. aerogenes analysis for a total of 5.5 million states in two MCMC chains, where the second chain was initialized using a post- burn-in sample from the first chain. I discarded 400,000 states from the first chain as burn-in and combined the chains using BEAST’s LogCombiner tool for a total of 5.1 million states and 5,094 samples. I ran the SARS-CoV-2 analysis for 10 million states in one MCMC chain. I discarded 1.5 million states as burn-in, yielding 8.5 million states and 8,501 samples. I summarized the sampled phylogenies into a maximum clade credibility tree using BEAST’s TreeAnnotator tool. I evaluated MCMC convergence using Tracer (Rambaut et al, 2018). All parameters achieved an effective sample size (ESS) > 100 with one exception (Figures S3, S4). The tree likelihood for the SARS-CoV-2 analysis only achieved an ESS of 48, though the MCMC trace plot does not indicate any major mixing problems like a bimodal distribution or large jumps in the likelihood value (Figure S4).
Benchmarking
I used the Nextflow option “-with-report” to output benchmarking data for HIV-TRACE, ClusterTracker, and Nextstrain’s augur. I used the ‘realtime’ times reported for Table 3. All commands were run on 1 CPU. BEAST runtime is given per million samples as reported by the program’s standard output. BEAST was also run on 1 CPU.
Supplementary Figures
Figure S1. The K. aerogenes hospital outbreak cluster visualized using interactive online tools. (A) HIV-TRACE results with https://veg.github.io/hivtrace-viz/: hospital samples are highlighted in bold. (B) ClusterTracker results with https://taxonium.org/: red circles show hospital samples. (C) augur results with auspice blue represents hospital location, color saturation represents location confidence (D) BEAST results with https://icytree.org/: green represents hospital location. Note that all visualizations include 15 known CICU outbreak samples and one unlinked hospital sample.
Figure S2. The SARS-CoV-2 conference outbreak cluster visualized using interactive online tools. Annotations are as in Figure S1.
Figure S3. MCMC output from BEAST for the K. aerogenes outbreak. Screenshot is from Tracer (Rambaut et al, 2018). The least well-mixed parameter’s trace plot is shown on the right.
Figure S4. MCMC output from BEAST for the SARS-CoV-2 outbreak. Screenshot is from Tracer (Rambaut et al, 2018). The least well-mixed parameter’s trace plot is shown on the right.
