We (https://covid19.galaxyproject.org) perform continuous analyses of all read-level data from short read archives (both SRA and ERA). At this point we have 1,343 distinct Illumina datasets from 22 studies. One study (SRP253798) stands out as highly problematic and likely cannot be used for reliable analysis of intra-host variation. So use caution. Here are details:
Absolute majority of gained stops are from a single study
(Variant list we used for this analysis can be found here).
After applying our variant calling workflow to these data we discovered an unusually high number of substitutions leading to the creation of stop codons – an obvious red flag. Here is a scatterplot of the relationship between total number of variants and variants leading to a stop creation colored by SRA study accessions:
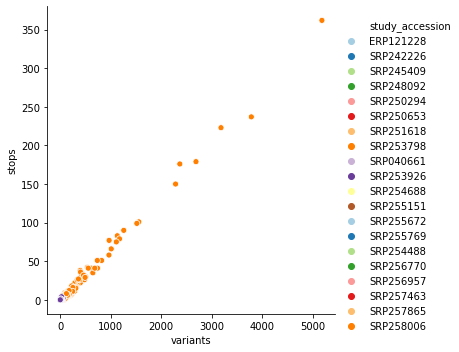
you can see that it is dominated by SRP253798. Removing this one study accession cleans up this picture quite a bit:
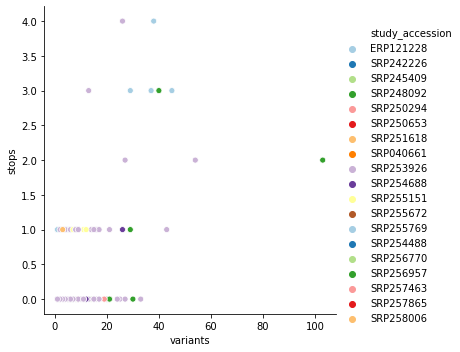
This particular study SRP253798 is also by far the biggest in terms of Sample (raw read datasets):
| study_accession | samples | |
|---|---|---|
| 0 | SRP253798 | 876 |
| 1 | ERP121228 | 227 |
| 2 | SRP253926 | 118 |
| 3 | SRP256957 | 54 |
| 4 | SRP255151 | 15 |
| 5 | SRP258006 | 10 |
| 6 | SRP248092 | 7 |
| 7 | SRP254688 | 6 |
| 8 | SRP251618 | 5 |
| 9 | SRP257865 | 4 |
| 10 | SRP254488 | 4 |
| 11 | SRP250294 | 4 |
| 12 | SRP259532 | 2 |
| 13 | SRP242226 | 2 |
| 14 | SRP040661 | 2 |
| 15 | SRP257463 | 1 |
| 16 | SRP256770 | 1 |
| 17 | SRP255769 | 1 |
| 18 | SRP255672 | 1 |
| 19 | SRP252988 | 1 |
| 20 | SRP250653 | 1 |
| 21 | SRP245409 | 1 |
Most stops are from T-to-C transitions
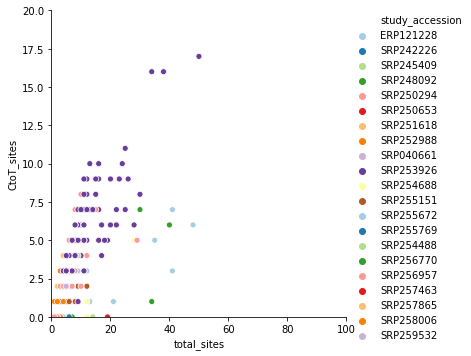
If one plots a very simple relationship between the number of C-to-T transitions (a possible signature of APOBEC-induced RNA modification) to the total number of changes for all study accessions we see this strange 1-to-1 relationship:
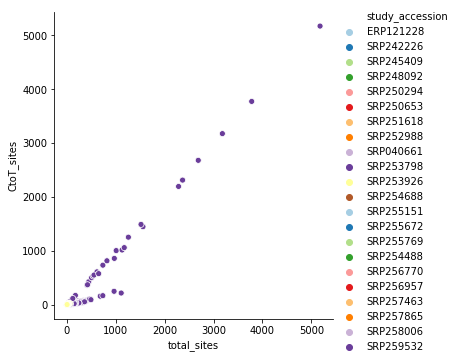
again, it is dominated by SRP253798. Removing it produces a far more reasonable picture:
We are excluding these samples from analyses completely.


