Marius Van Den Beek, Wolfgang Maier, Sergei Kosakowsky Pond, Anton Nekrutenko + DataMonkey and GalaxyProject Teams | galaxyproject.org
This is a part of the join effort between Datamonkey and GalaxyProject teams to provide free, reproducible, and accessible set of workflows for the analysis of SARS-CoV2 data.
This is a preliminary analysis of SARS-CoV2 intra-host variation. It includes SNPs only (no indels at this point) and Illumina data only. This post describes analysis of data publicly available from SRA and ENA between the beginning of the outbreak and May 17, 2020.
Outline
- Dataset overview
- Types of changes
- What’s up with stops?
- Filtering strategy
- Analysis of RNA editing
- APOBEC
- ADAR
- A closer look at variants
- Comparison with sites under selection
Dataset overview
How we call variants
In this study we use lofreq for calling variants. This choice is based on banchmarking described here
Sites, samples, and studies
There are still very few raw read darasets for SARS-CoV2
Despite the fact that the number of complete genomes in places like GISAID has already surpassed 30,000, the number of raw datasets remains relatively modest by comparison:
[‘RNA-Seq’, ‘AMPLICON’, ‘Targeted-Capture’, ‘WGS’, ‘OTHER’]
| Feature | Count | Description |
|---|---|---|
| Total sites | 11,059 | Total number of SNPs across all samples. Since many sites are presented in multiple samples they are counted multiple times here |
| Distinct sites | 4,899 | Distinct variable positions across SARS-CoV2 genome |
| Distinct samples | 1,093 | Distinct SRA or ENA accessions in this dataset |
| Distinct studies | 28 | SRA bundles samples into studies |
| Distinct geographic locations | 24 | ‘Germany’, ‘China:Shanghai’, None, ‘USA:Virginia’,‘USA: Hamilton, MT’, ‘USA’, ‘USA:Minnesota’, ‘USA: Washington’, ‘Peru: Lima’, ‘USA: New York’, ‘Germany: Dusseldorf’, ‘Bangladesh’, ‘USA:Los Angeles’, ‘China: Hubei’, ‘China: Wuhan’, ‘Malaysia’, ‘India: Rajkot’, ‘Israel’, ‘Germany: Heinsberg’, ‘USA: WA’,‘USA: Seattle, WA’, ‘Cambodia:Sihanoukville’,‘Malaysia: Kuala Lumpur’, ‘Egypt’, ‘Nepal: Kathmandu’ |
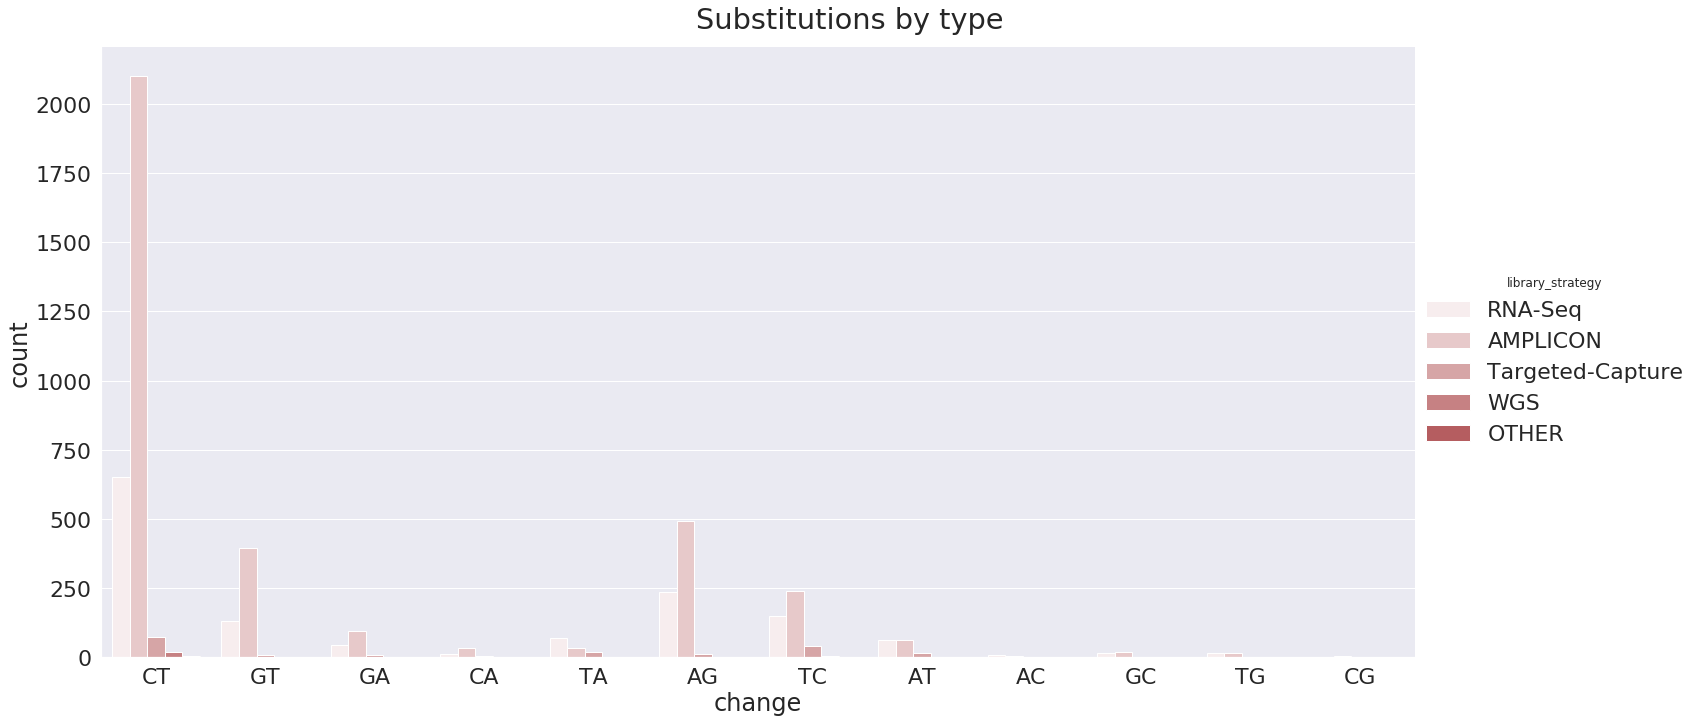
Types of changes
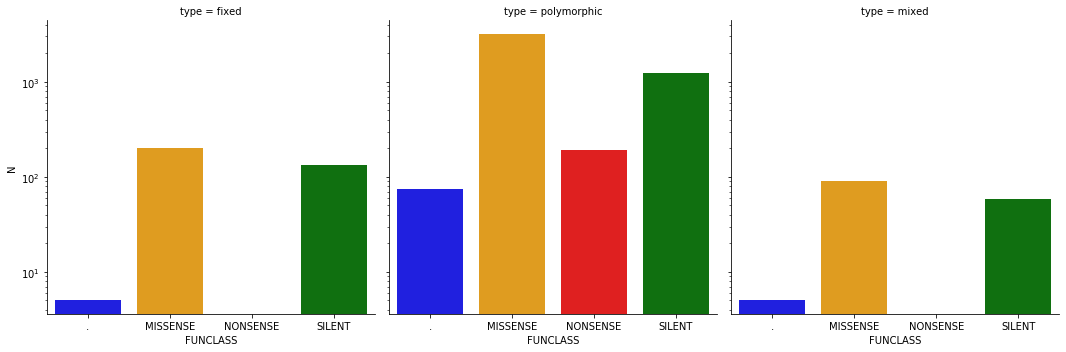
At first sight most variable sites involve non-synonymous changes and have wide range of alternative allele frequencies
We define three types of sites:
- FIXED = alternative allele frequency (AAF) across all samples at a given site >= 95%
- POLYMORPHIC = AAF across all samples at a given site > 5% and < 95%
- MIXED = AAF across all samples at a given site > 5% (these are different from polymorphic in that some samples may have AAF > 95%).
In our data we have (here ‘.’ = non coding regions such as UTRs):
| FUNCLASS | N | type | |
|---|---|---|---|
| 0 | . | 5 | fixed |
| 1 | MISSENSE | 203 | fixed |
| 2 | NONSENSE | 1 | fixed |
| 3 | SILENT | 132 | fixed |
| 4 | . | 74 | polymorphic |
| 5 | MISSENSE | 3207 | polymorphic |
| 6 | NONSENSE | 192 | polymorphic |
| 7 | SILENT | 1243 | polymorphic |
| 8 | . | 5 | mixed |
| 9 | MISSENSE | 90 | mixed |
| 10 | SILENT | 58 | mixed |
or graphically:
These changes are distributed across SARS-CoV2 genes in the following way (here rlen, Y-axis,
is the number of changes with a gene divided by its length):
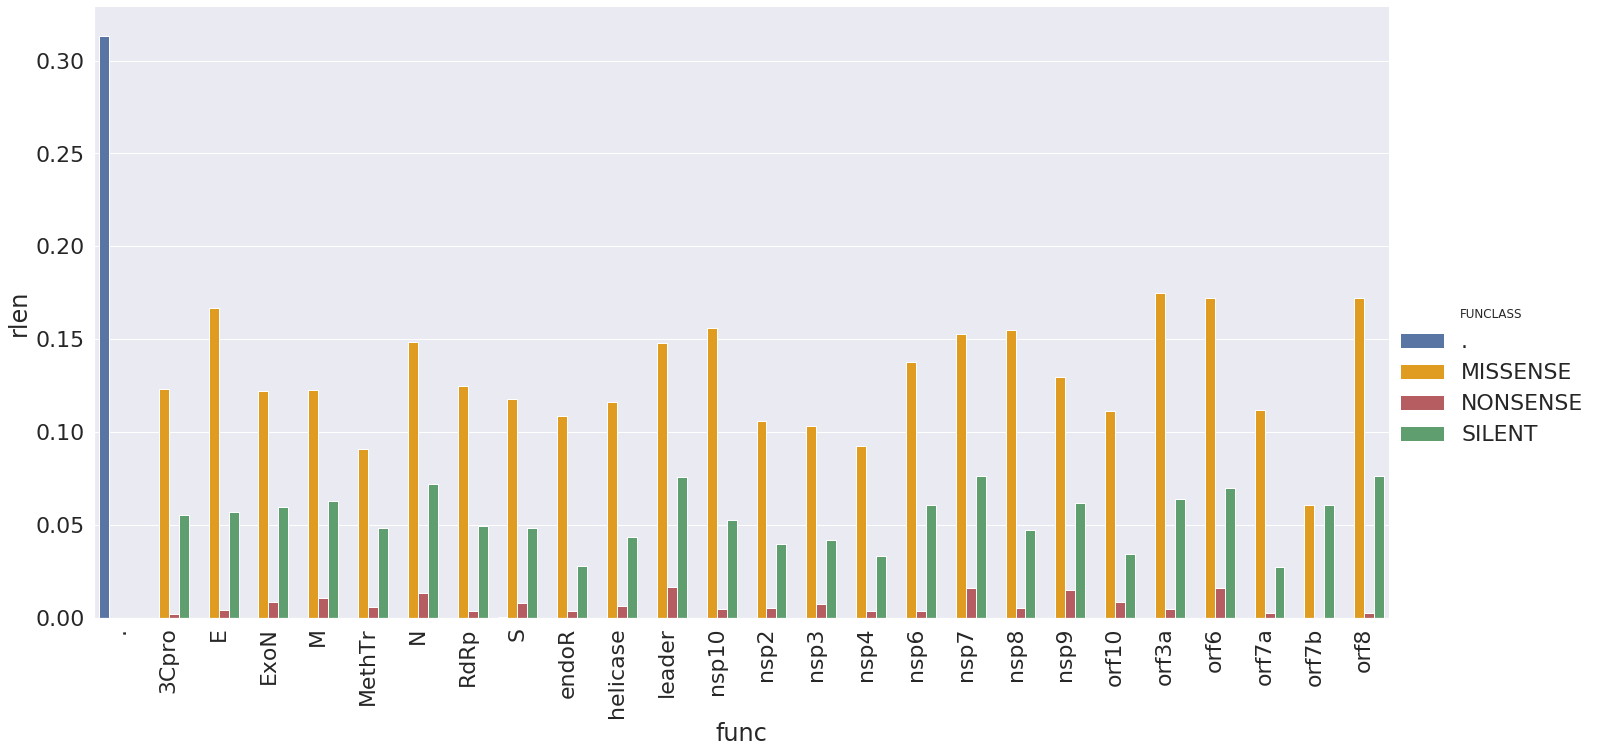
Where’s the data?
What’s up with stops?
There is a number of substitution leading to stops. The most prominent site, 29,039, is dominated by a single study.
The figure above shown a substantial number of nucleotide changes creating stop codons (red bars in the above plot). Our previous analysis showed that stops need to be treated with caution (the study SRP253798 was excluded from this analysis). Let’s see which studies have stops:
| study_accession | Library Strategy | Stops | Samples | |
|---|---|---|---|---|
| 0 | SRP258105 | AMPLICON | 73 | 46 |
| 1 | SRP253926 | AMPLICON | 70 | 38 |
| 2 | SRP251618 | RNA-Seq | 61 | 27 |
| 3 | ERP121228 | AMPLICON | 33 | 22 |
| 4 | SRP261417 | Targeted-Capture | 31 | 19 |
| 5 | SRP256957 | AMPLICON | 8 | 4 |
| 6 | SRP248092 | RNA-Seq | 6 | 3 |
| 7 | SRP255151 | AMPLICON | 3 | 3 |
| 8 | SRP261949 | OTHER | 2 | 1 |
| 9 | SRP258006 | AMPLICON | 1 | 1 |
| 10 | SRP254688 | RNA-Seq | 1 | 1 |
| 11 | SRP254488 | AMPLICON | 1 | 1 |
| 12 | SRP242226 | RNA-Seq | 1 | 1 |
and which of the stops are shared across multiple studies:
| POS | change | Samples | Studies | Strategies | Gene | Function | |
|---|---|---|---|---|---|---|---|
| 0 | 29039 | AT | 29 | 5 | 3 | N | nucleocapsid phosphoprotein |
| 1 | 10718 | CT | 2 | 2 | 1 | orf1ab | 3C-like proteinase |
| 2 | 11357 | AT | 14 | 2 | 2 | orf1ab | nsp6 |
| 3 | 16672 | AT | 2 | 2 | 2 | orf1ab | helicase |
| 4 | 17865 | TA | 6 | 2 | 2 | orf1ab | helicase |
| 5 | 23511 | TG | 3 | 2 | 1 | S | surface glycoprotein |
| 6 | 28209 | GT | 2 | 2 | 1 | ORF8 | ORF8 protein |
| 7 | 29120 | CT | 2 | 2 | 1 | N | nucleocapsid phosphoprotein |
| 8 | 29642 | CT | 2 | 2 | 2 | ORF10 | ORF10 protein |
| 9 | 269 | GT | 1 | 1 | 1 | orf1ab | leader protein |
| 10 | 329 | CT | 1 | 1 | 1 | orf1ab | leader protein |
| 11 | 374 | GT | 1 | 1 | 1 | orf1ab | leader protein |
| 12 | 404 | AT | 1 | 1 | 1 | orf1ab | leader protein |
| 13 | 536 | GT | 1 | 1 | 1 | orf1ab | leader protein |
| 14 | 728 | GT | 1 | 1 | 1 | orf1ab | leader protein |
here is a genome view:

let’s look at position 29,039 (a subset of rows shown; see notebook for full dataset) – largest cross on the image above (below all columns are self explanatory with the exception of DP4, which contains strand-specific counts: (1) reference observations on forward, (2) reference observations on reverse, (3) alternative observations on forward, and (4) alternative observations on reverse) :
| Sample | DP | AF | SB | DP4 | GENE | CODON | study_accession | library_strategy | library_source | library_selection | |
|---|---|---|---|---|---|---|---|---|---|---|---|
| 0 | SRR11597150 | 52 | 0.057692 | 2 | 31,18,3,0 | N | Aag/Tag | SRP258105 | AMPLICON | VIRAL RNA | PCR |
| 1 | SRR11597171 | 62 | 0.096774 | 2 | 43,12,6,0 | N | Aag/Tag | SRP258105 | AMPLICON | VIRAL RNA | PCR |
| 2 | SRR11597195 | 53 | 0.056604 | 5 | 32,16,1,2 | N | Aag/Tag | SRP258105 | AMPLICON | VIRAL RNA | PCR |
| 3 | SRR11783573 | 2015 | 0.074442 | 146 | 834,1003,28,148 | N | Aag/Tag | SRP261417 | Targeted-Capture | VIRAL RNA | RT-PCR |
| 4 | SRR11783615 | 1095 | 0.204566 | 291 | 530,317,53,189 | N | Aag/Tag | SRP261417 | Targeted-Capture | VIRAL RNA | RT-PCR |
| 5 | SRR11783623 | 5373 | 0.051182 | 223 | 2603,2420,272,75 | N | Aag/Tag | SRP261417 | Targeted-Capture | VIRAL RNA | RT-PCR |
| 6 | SRR11771993 | 105 | 0.066667 | 0 | 50,48,4,3 | N | Aag/Tag | SRP251618 | RNA-Seq | VIRAL RNA | unspecified |
| 7 | SRR11772009 | 140 | 0.064286 | 0 | 64,67,4,5 | N | Aag/Tag | SRP251618 | RNA-Seq | VIRAL RNA | unspecified |
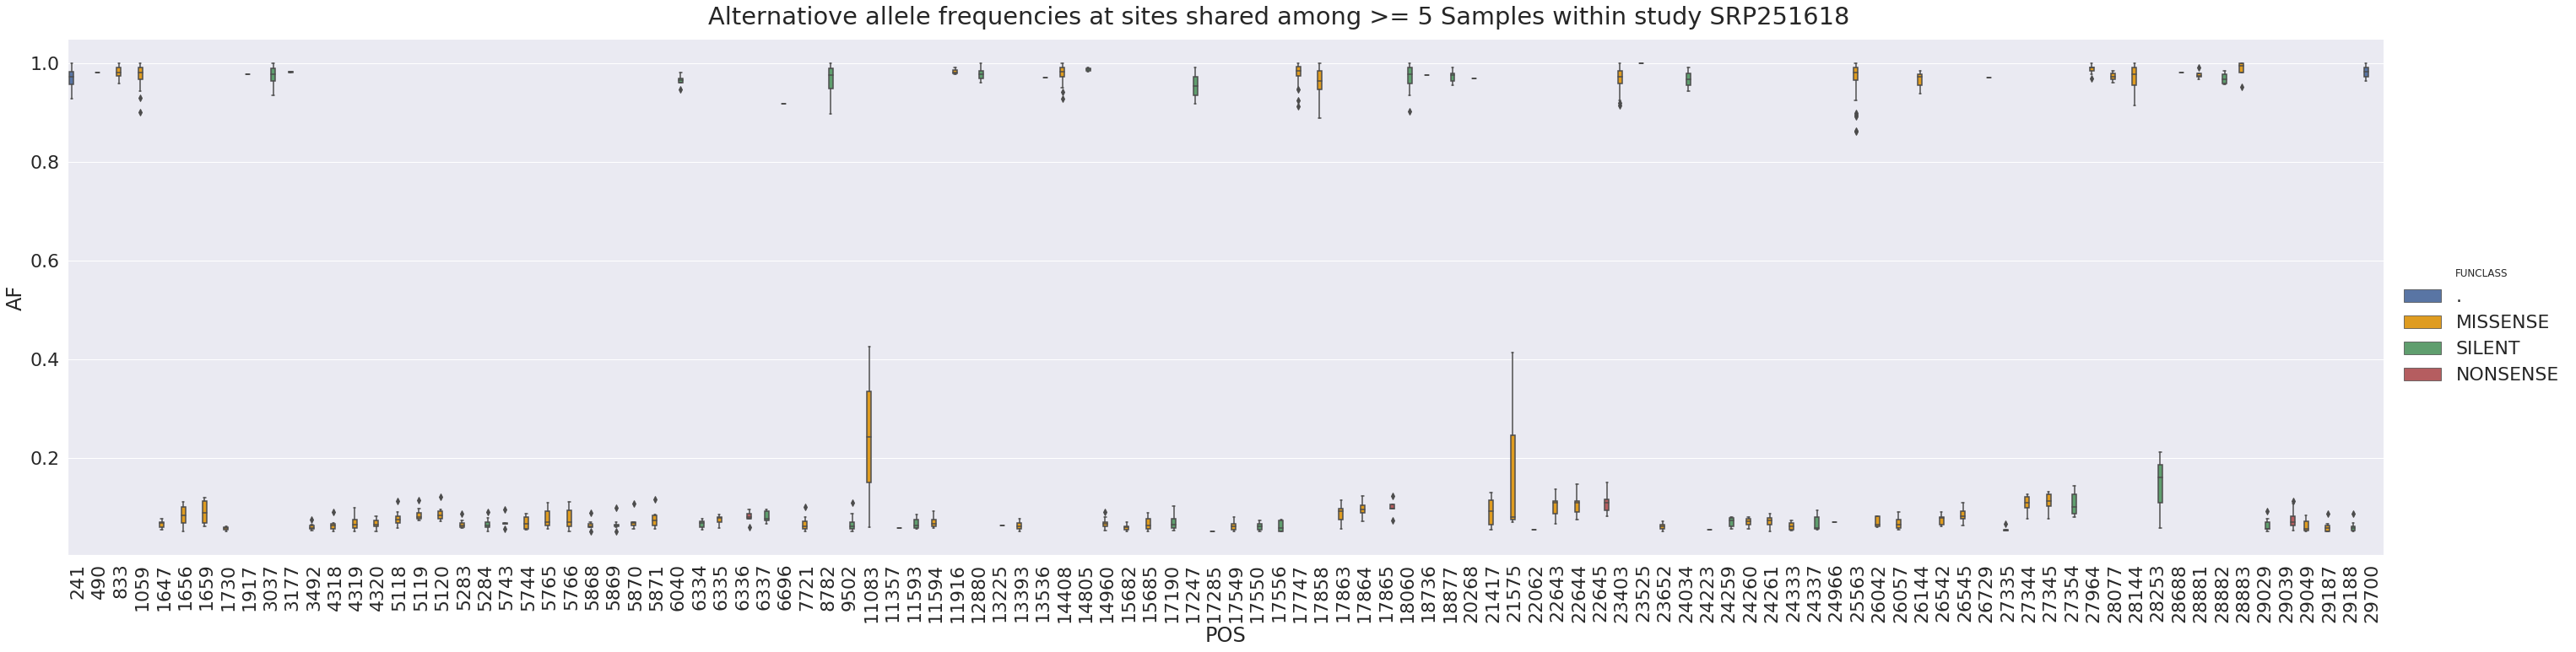
it is interesting to note that most rows in the above table come from SRP251618 and this one study has a relatively tight distribution of alternative allele frequencies at this site:

in general, a tight distribution of allele frequencies within a single study may potentially suggest contamination (e.g., see Dickins 2014). Here is the distribution of alternative allele frequencies for all SNPs within SRP251618 where a site is shared across at least 5 samples (as you can see it is a little tight):
To gain another perspective let’s plot frequency of nucleotide changes leading to a stop versus that number of Samples, Studies, and Library preparation strategies they appear in:


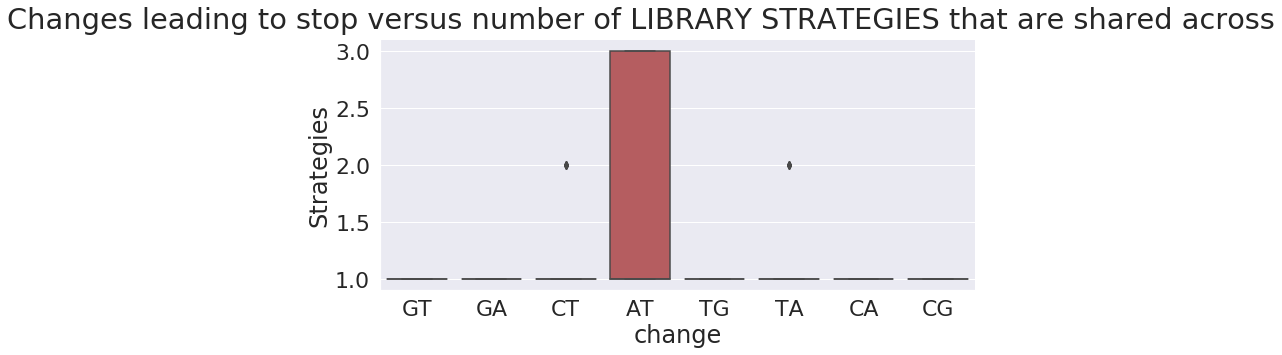
as you can see the absolute majority of changes leading to stops are restricted to just one sample, study, or strategy.
Filtering strategy
We restrict downstream analyses to only those sites that are shared across at least 2 studies (e.g.,
SRPidentifiers).
At this point we can afford being on a conservative side of things. For all subsequent analyses we will only use variants that are shared across at least two Studies. This reduces the number of 5,210 distinct sites to 458.
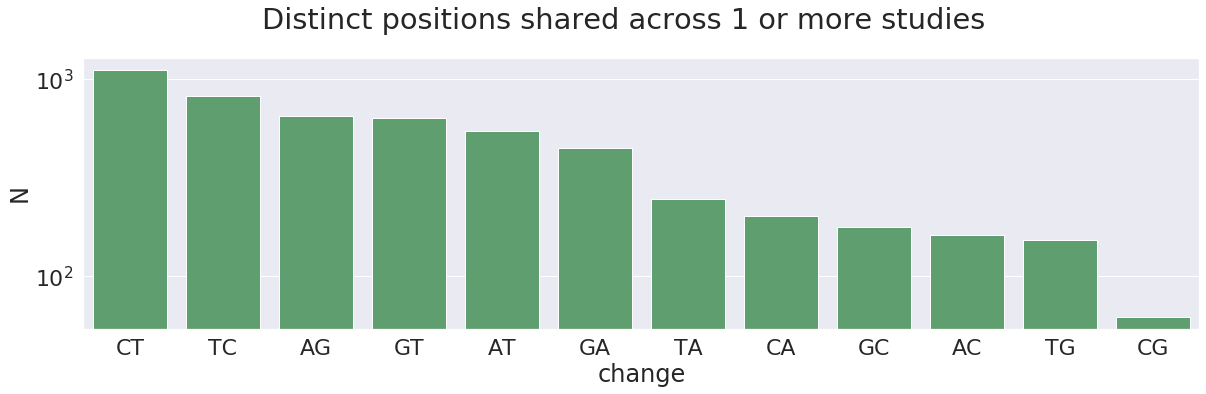
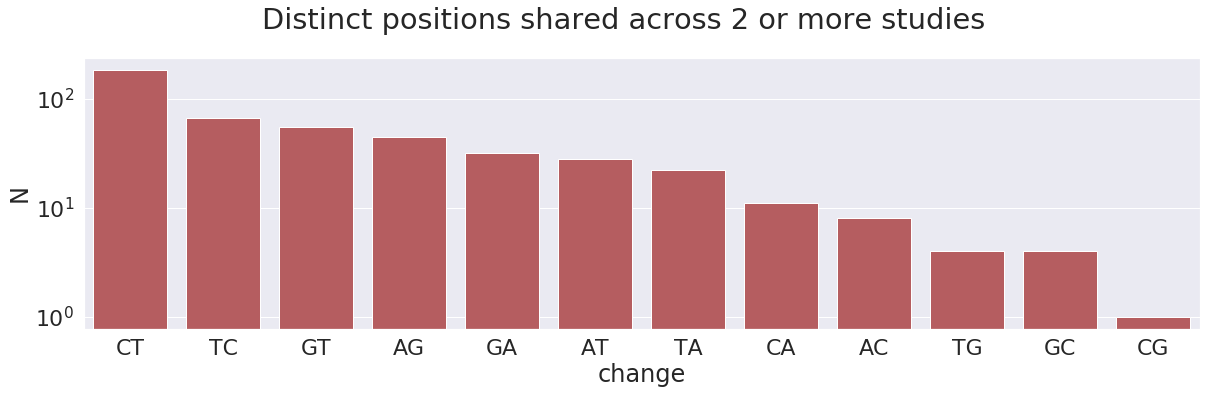
This charts highlight another interesting observations. The total number of C-to-T changes (together with complementary G-to-A) is 215, which is ~47% of the total (458). These changes can potentially be results of APOBEC3-mediated RNA editing of single stranded RNA. In addition, there are 110 A-to-G changes (along with complementary T-to-C), which is ~24% of the total. These can be results of ADAR-mediated A-to-I RNA editing. Below we try to make sense of these numbers:
Analysis of potential RNA editing
There is evidence of RNA editing by APOBEC3 and ADAR systems.
Here we look for signatures of APOBEC- and ADAR-mediated RNA editing.
APOBEC signatures
APOBEC (apolipoprotein B mRNA editing enzyme, catalytic polypeptide-like) converts C in single stranded stretches of DNA or RNA to U resulting C → T transition. Members of APOBEC family target specific sequence motifs: TC , CCC , TTC where the last base mutated to T , or TCW ( W = A / T ) where the middle base mutates to T (see Chen and MacCarthy 2014).
The majority of mutations observed on this data are T to C :
Plus strand
Let’s plot upstream context (two upstream nucleotides plus the SNP) of C-to-T substitutions versus number of distinct sites with a C-to-T change:
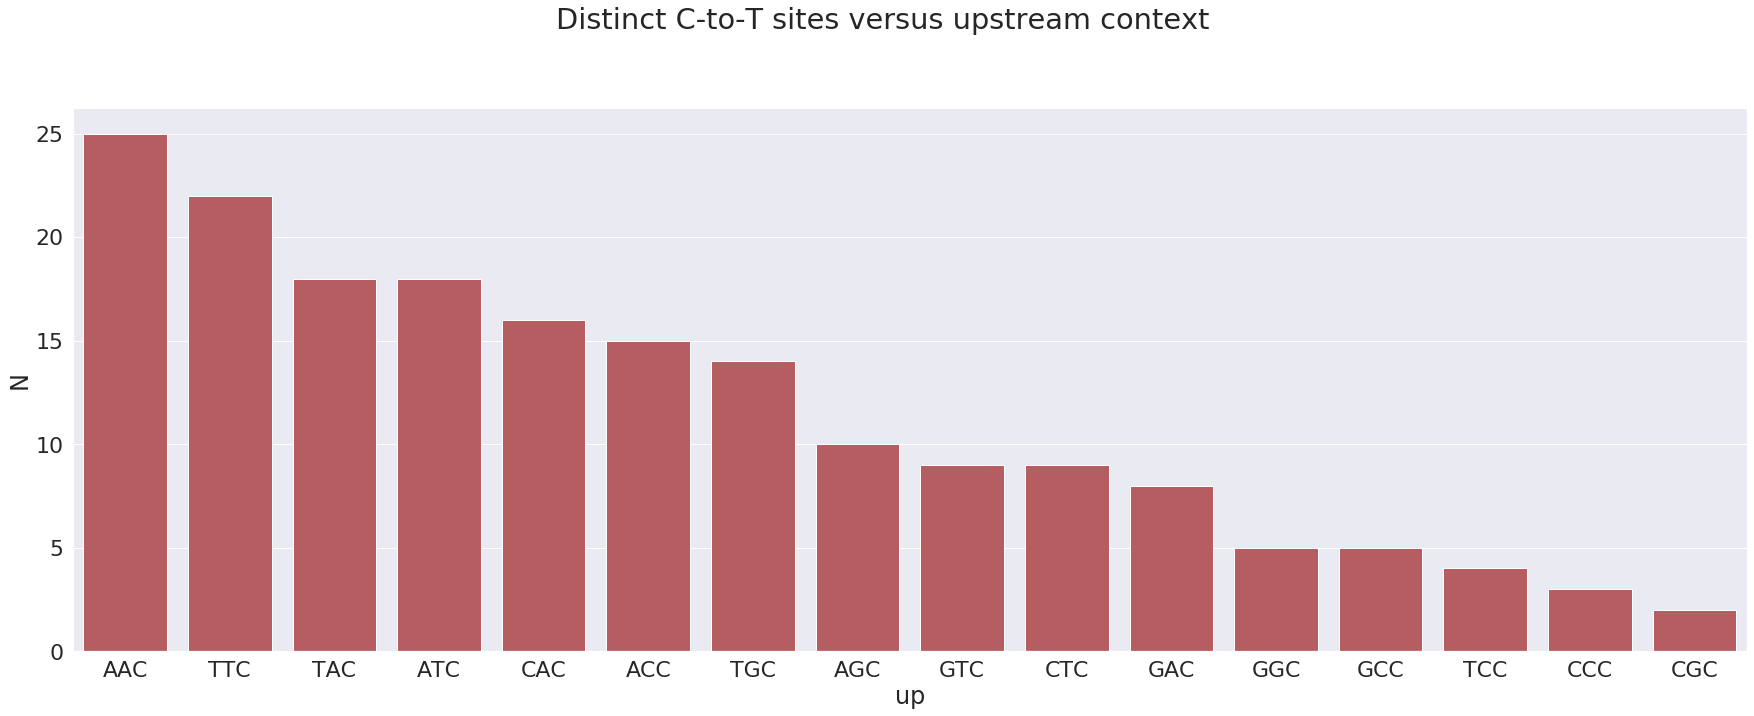
most sites have context AAC which is not an APOBEC3 motif. At the same time the next most frequent motif is TTC which is an APOBEC3 motif.
Which motifs correspond to sites that are most frequently changed:
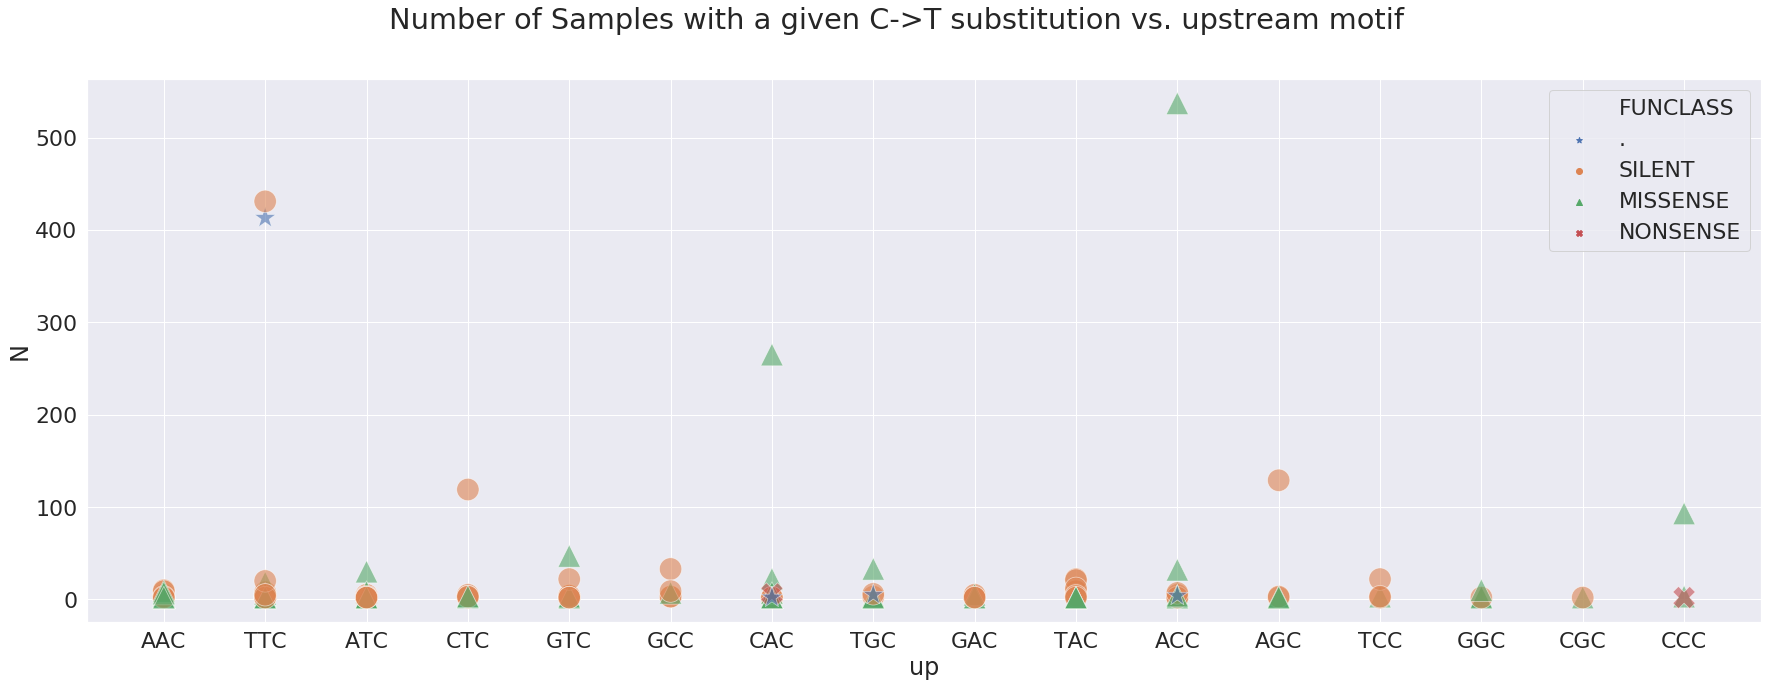
here, N is the number of Samples sharing a particular change. For example, a green triangle above ACC is a non-synonymous change shared by over 500 samples in our dataset. Here is a look at sites wihere N is above 100:
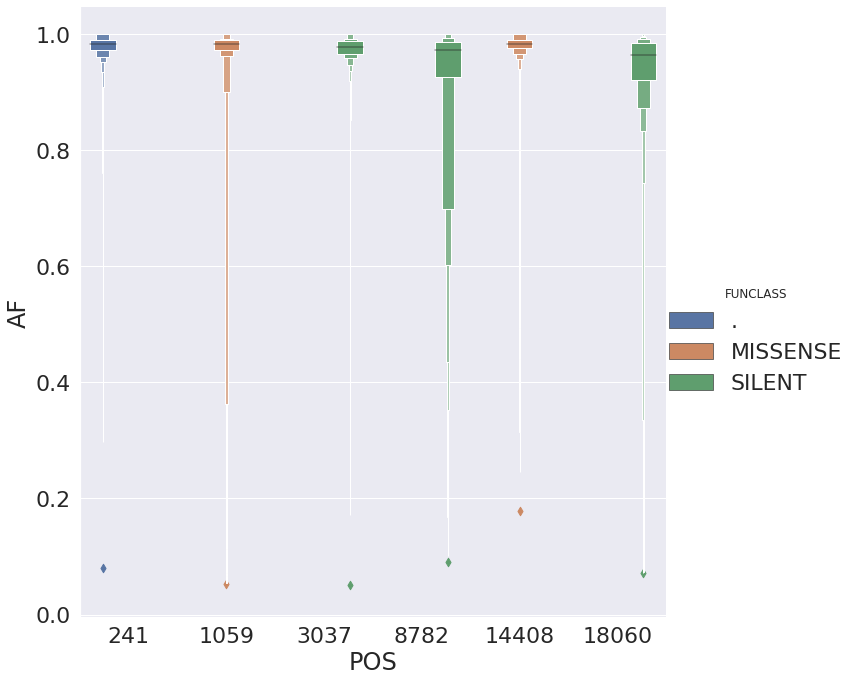
| POS | N | Samples | Studies | change | GENE | FUNCLASS | type | func | up | down | mid | |
|---|---|---|---|---|---|---|---|---|---|---|---|---|
| 0 | 241 | 413 | 413 | 12 | 5 | . | . | 5’UTR | . | TTC | CGT | TCG |
| 1 | 1059 | 265 | 265 | 5 | 3 | orf1ab | MISSENSE | mat_peptide | nsp2 | CAC | CCT | ACC |
| 2 | 3037 | 431 | 431 | 13 | 5 | orf1ab | SILENT | mat_peptide | nsp3 | TTC | CTA | TCT |
| 3 | 8782 | 129 | 129 | 11 | 4 | orf1ab | SILENT | mat_peptide | nsp4 | AGC | CCA | GCC |
| 4 | 14408 | 537 | 537 | 11 | 5 | orf1ab | MISSENSE | mat_peptide | RNA-dependent RNA polymerase | ACC | CTA | CCT |
| 5 | 18060 | 119 | 119 | 7 | 4 | orf1ab | SILENT | mat_peptide | 3’-to-5’ exonuclease | CTC | CTT | TCT |
and the allele frequency distribution for these suggests that in most cases they are fixed:
Minus strand
For the opposite strand edits we will plot the downstream context (SNP base plus two downstream nucleotides):
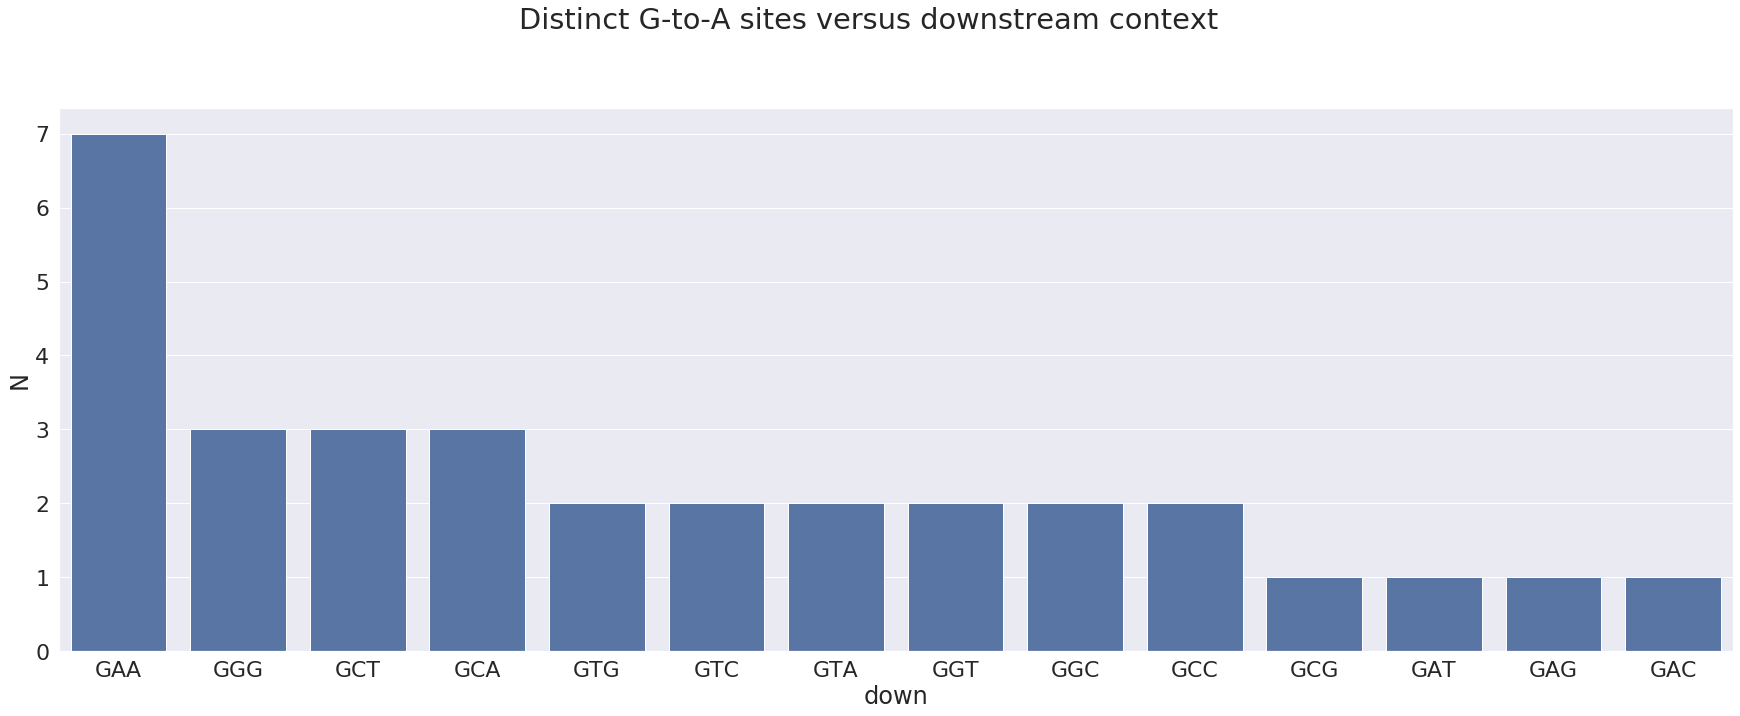
here 3’-GAA-5’ (or 5’-TTC-3’ in the proper 5’-to-3’ orientation) is the most prominent motif. It is an APOBEC3 motif.
The motif corresponding to the sites that are most frequently changed is:

and the most prominent sites look like this:
| POS | N | change | GENE | FUNCLASS | type | func | up | down | mid | |
|---|---|---|---|---|---|---|---|---|---|---|
| 3 | 1730 | 23 | GA | orf1ab | MISSENSE | mat_peptide | nsp2 | TGG | GAA | GGA |
| 26 | 28881 | 17 | GA | N | MISSENSE | CDS | nucleocapsid phosphoprotein | TAG | GGG | AGG |
| 27 | 28882 | 17 | GA | N | SILENT | CDS | nucleocapsid phosphoprotein | AGG | GGG | GGG |
with allele frequencies distributed in the following way:
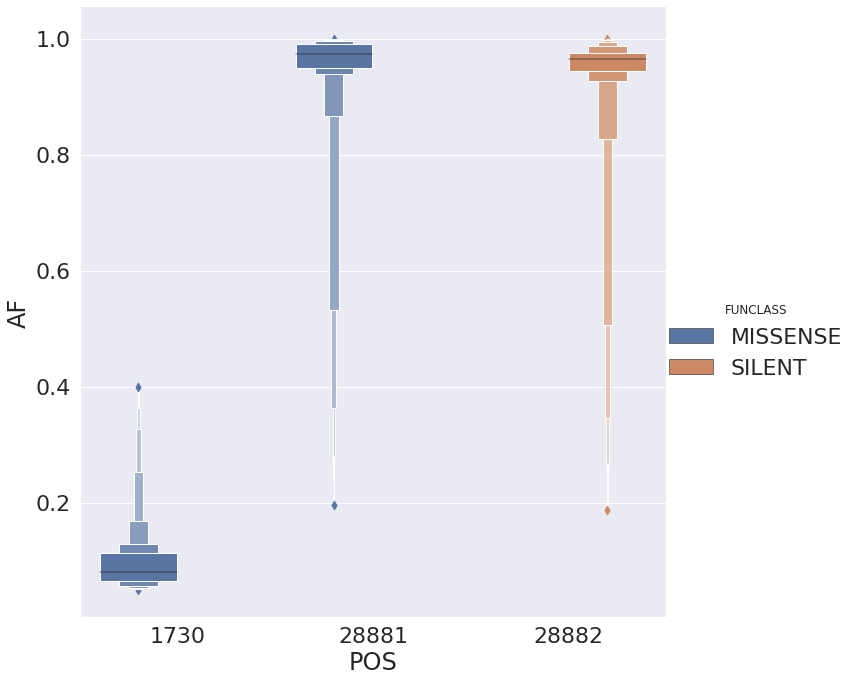
There are several interesting things here:
- Site 1,730 is always polymorphic despite the fact that it is present in 23 samples. Sites 28,881 and 28,882 are adjacent to each other and both have upstream context
CCC(complement ofGGG).
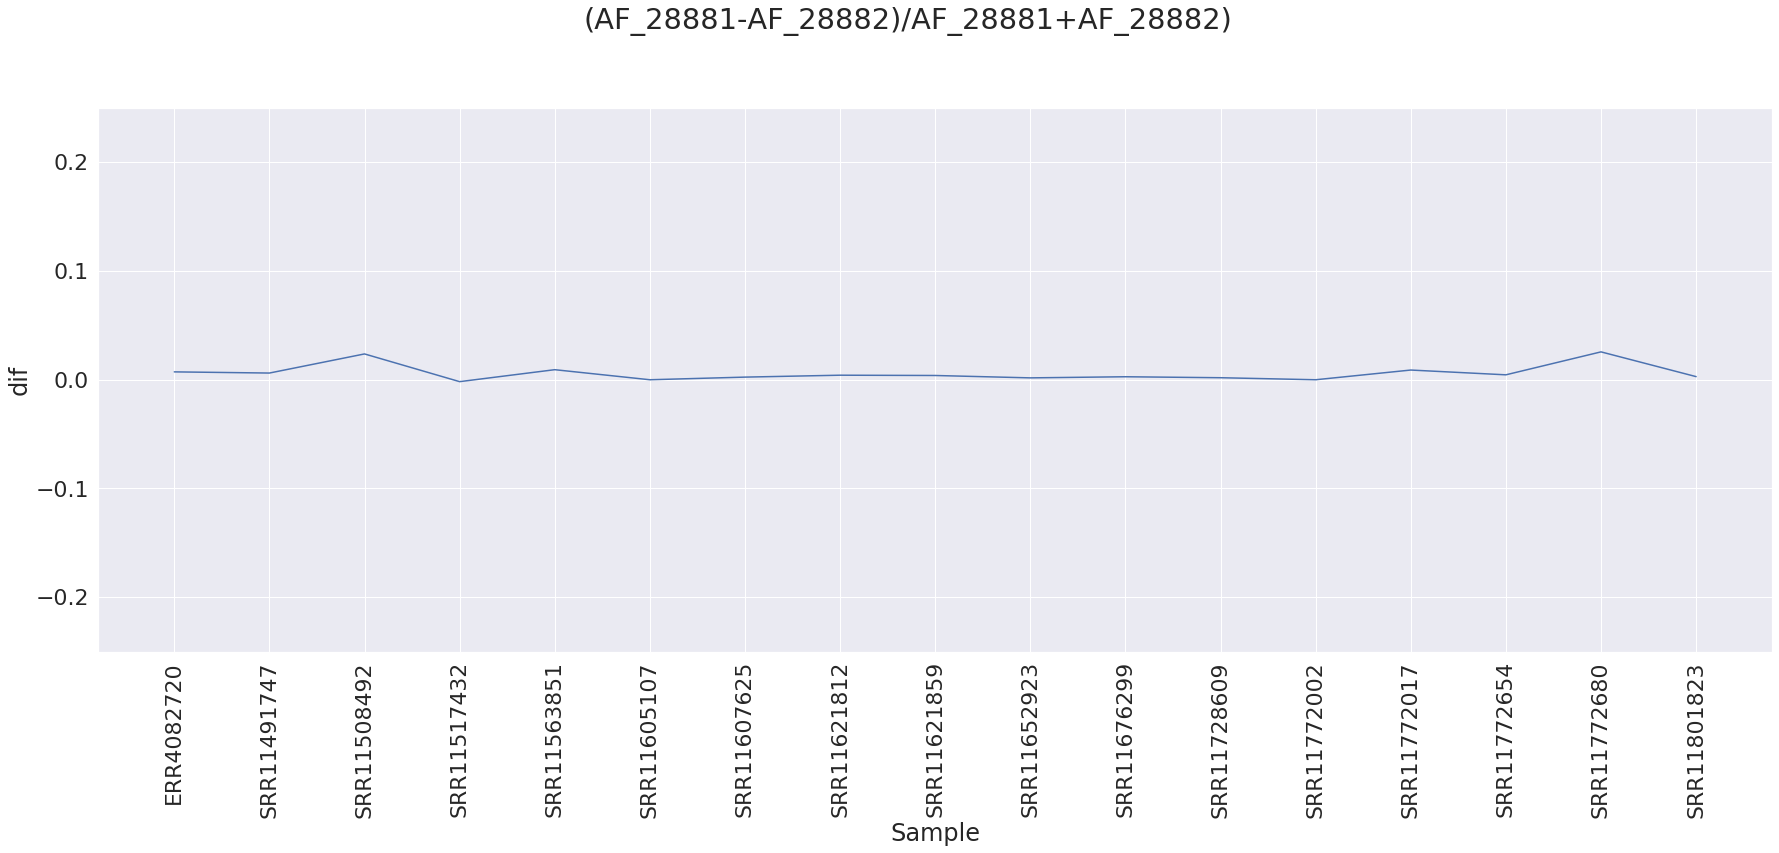
The sites appear to be linked (we need to look at alignments) based on the difference between alternative allele frequencies for site 28,881 and 28,882 for all samples that have that change as there the alternative allele frequencies are essentially equal between site 28,881 and 28,882:
ADAR editing
ADAR changes A to I within double stranded stretches, which reads as an A to G change. Bazak et al. 2014 report the following context for ADAR-edited sites:

Plus strand
For plus strand A-to-G changes have the following surrounding context:
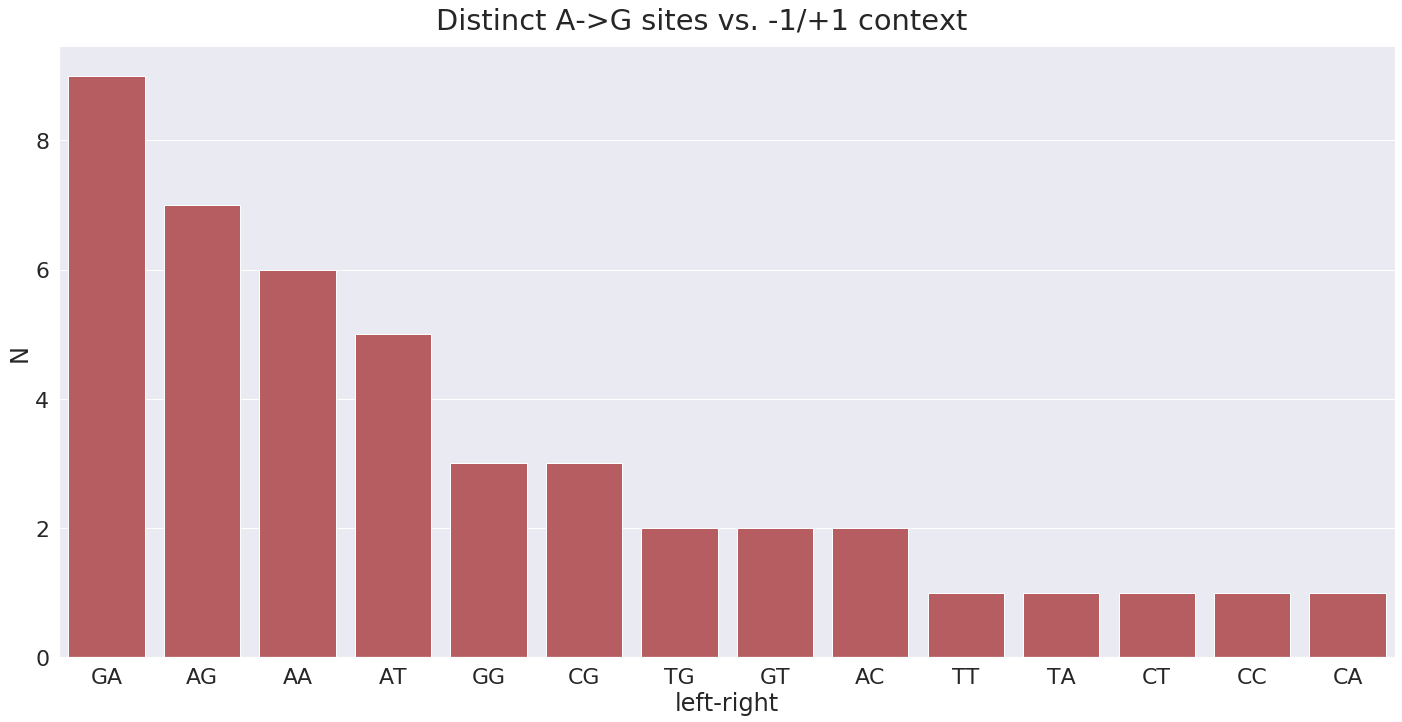
Here the GA means G is -1 position and A in +1 position. In terms of A-to-G substitution context present in the highest number of samples, it is GT and TT:
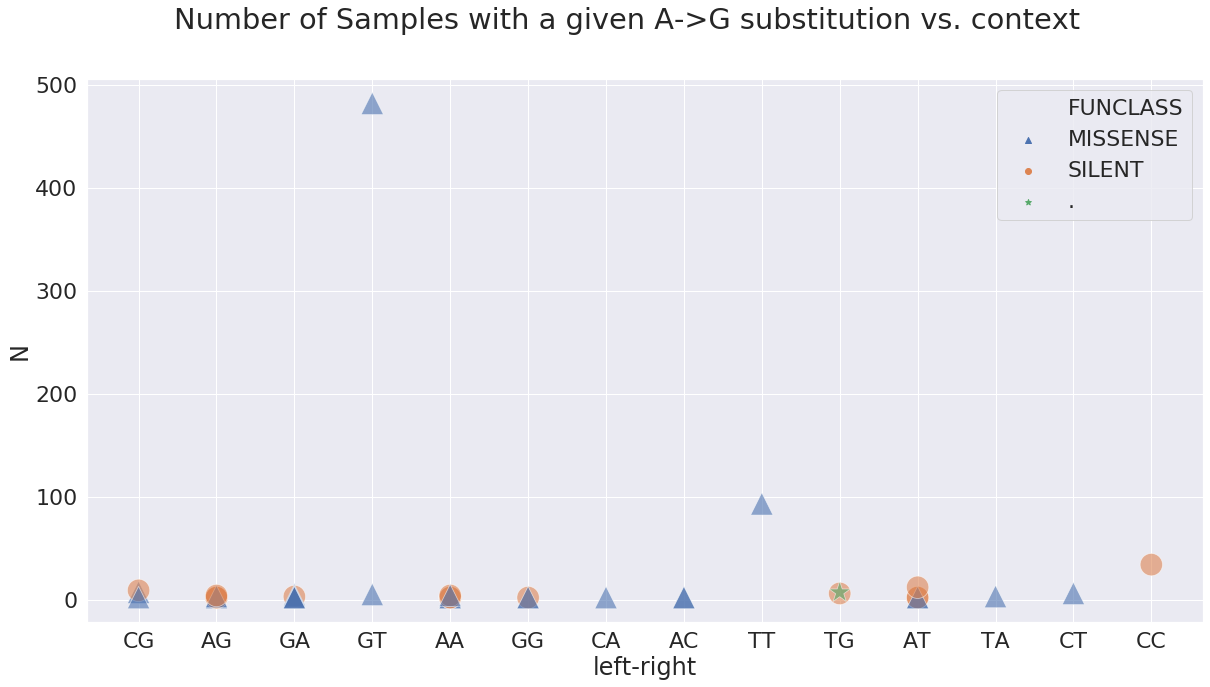
at these sites:
| POS | N | change | GENE | FUNCLASS | type | func | mid | left | right | left-right | |
|---|---|---|---|---|---|---|---|---|---|---|---|
| 23 | 17858 | 93 | AG | orf1ab | MISSENSE | mat_peptide | helicase | TAT | T | T | TT |
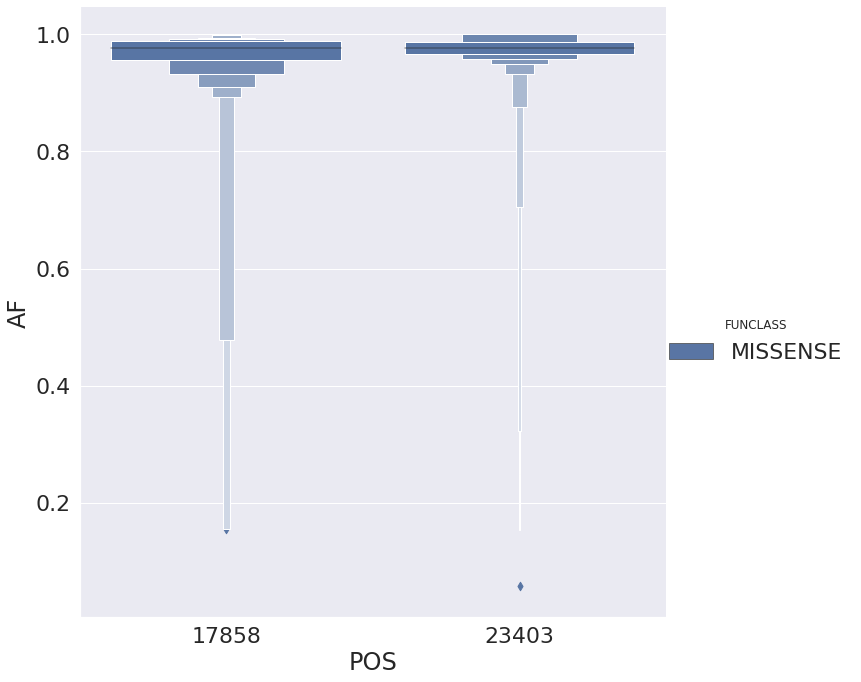
| 30 | 23403 | 482 | AG | S | MISSENSE | CDS | surface glycoprotein | GAT | G | T | GT |
with allele frequencies distributed like this:
Minus strand
On the minus strand we would expect T-toC substitutions with the following contexts:
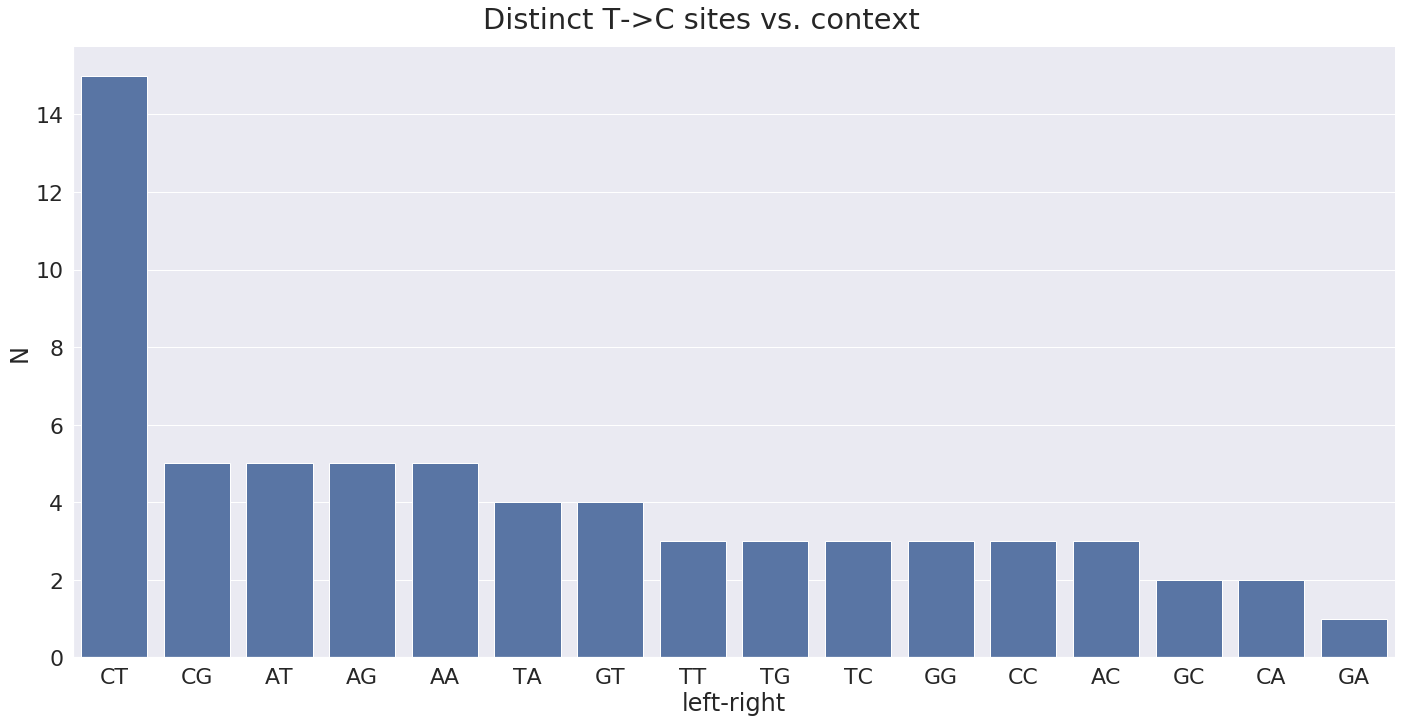
The distribution of most widely observed contexts:
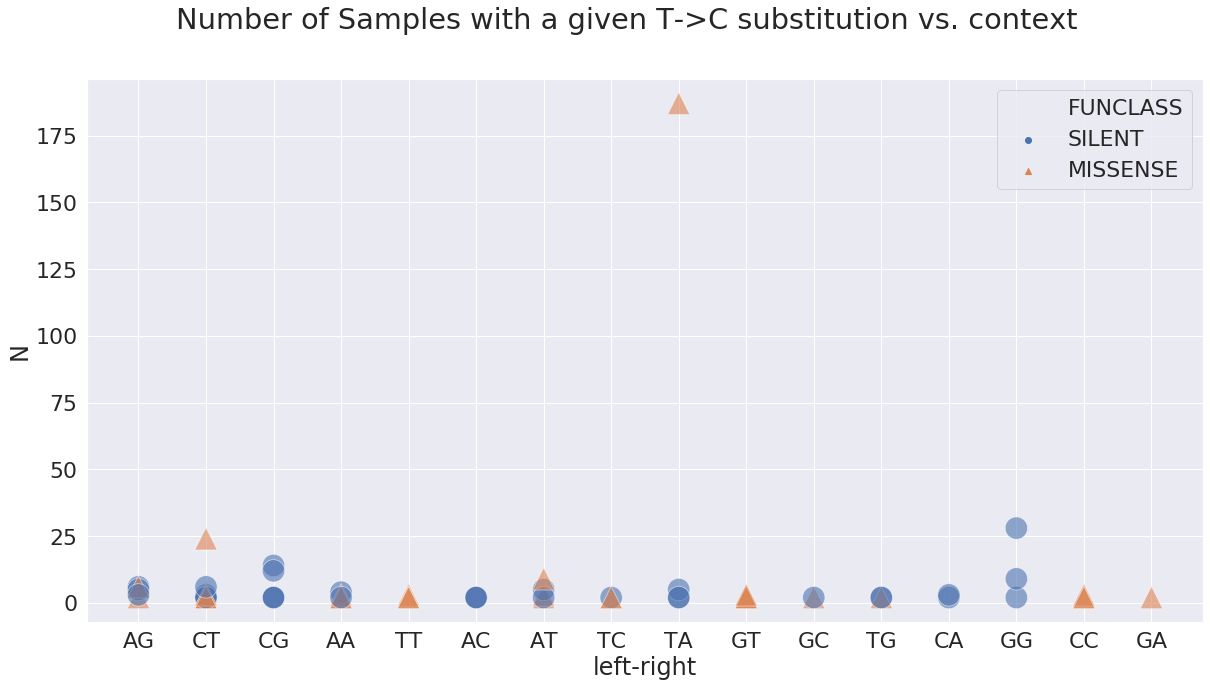
where the most prominent sites are:
| POS | N | change | GENE | FUNCLASS | type | func | mid | left | right | left-right | |
|---|---|---|---|---|---|---|---|---|---|---|---|
| 1 | 833 | 24 | TC | orf1ab | MISSENSE | mat_peptide | nsp2 | CTT | C | T | CT |
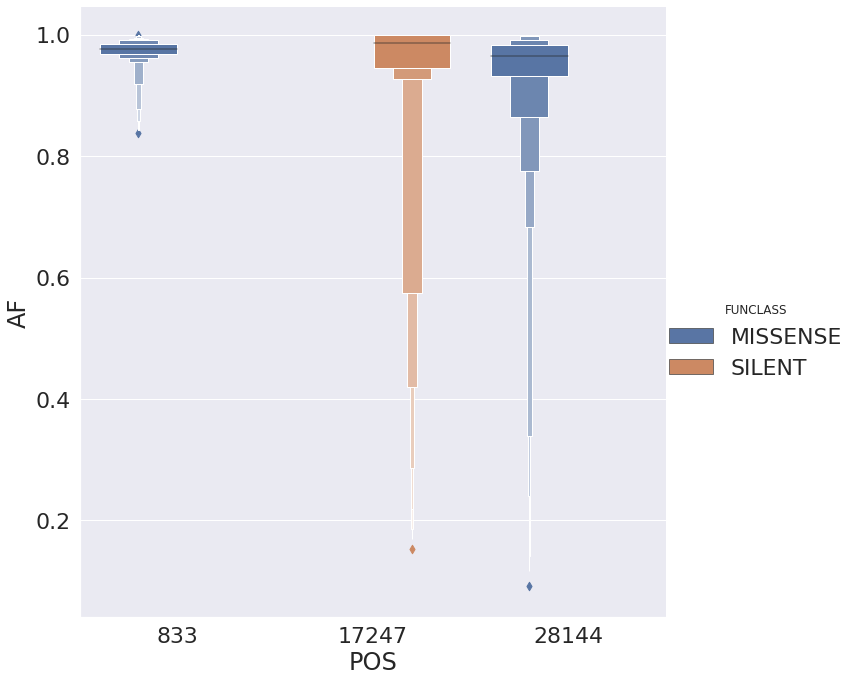
| 41 | 17247 | 28 | TC | orf1ab | SILENT | mat_peptide | helicase | GTG | G | G | GG |
| 61 | 28144 | 187 | TC | ORF8 | MISSENSE | CDS | ORF8 protein | TTA | T | A | TA |
with the following distribution of allele frequencies:
A closer look at variants
There is a group of mixed sites with a wide allele frequency range shared across multiple studies. Such sites are fixed in some sample and polymorphic in others. Some of these sites are supported by multiple experimental strategies (highlighted by different colors; strategies are: RNA-Seq, AMPLICON, Targeted-Capture, WGS, OTHER.)
The following image shows nonsynonymous sites supported by at least two studies versus alternative allele frequency for individual samples. You can see a handful of sites where frequency is stretched across the entire 0 to 1 range:

Here we take a look at the three categories of sites – (1) fixed, (2) polymorphic, and (3) mixed. In the following graphs we shown missense and nonsense sites only. The size of the marker is proportional to the number of distinct studies supporting each site. The Y axis the range of alternative allele frequences across all samples at a given site.
Fixed sites
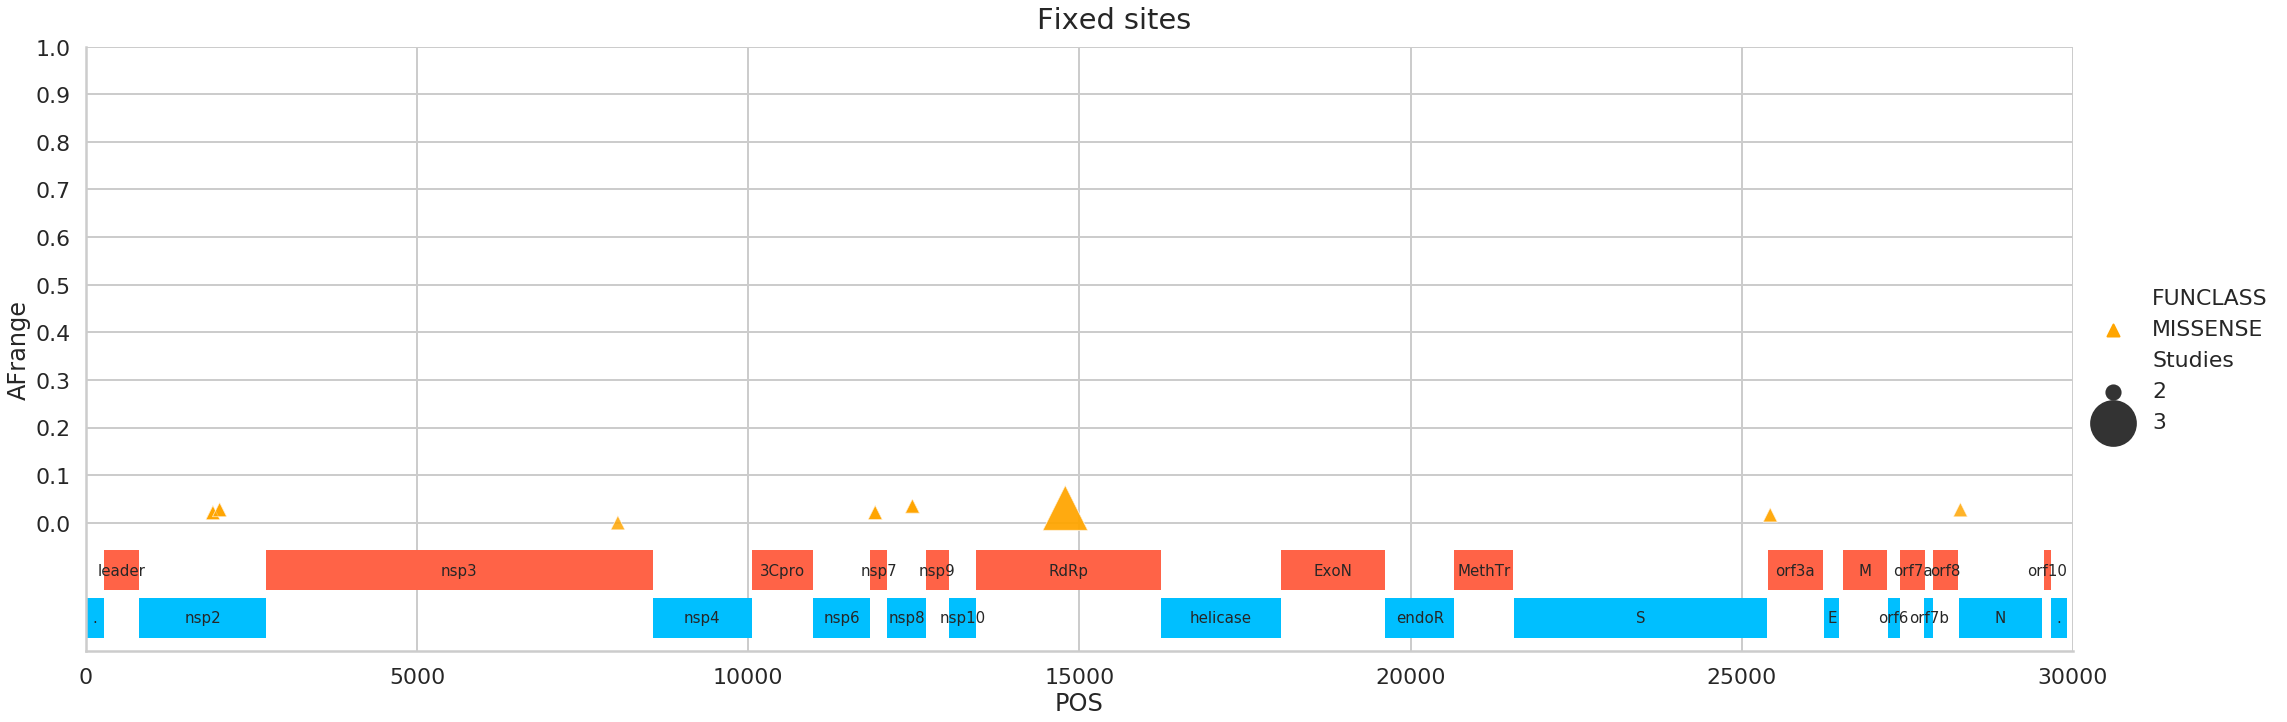
Here is a list of these sites (in all tables of this kind below Samples = # of SRR datasets supporting this site, Studies = # of SRP accessions supporting this site, Strategies = # of library preparation strategies such as RNA-Seq, AMPLICON, Targeted-Capture, WGS, OTHER, AFRange is the range of alternative allele frequency values across all samples at this site with this change):
| POS | change | FUNCLASS | func | Samples | Studies | Strategies | AFrange | |
|---|---|---|---|---|---|---|---|---|
| 0 | 1917 | CT | MISSENSE | nsp2 | 22 | 2 | 2 | 0.021277 |
| 1 | 2018 | AG | MISSENSE | nsp2 | 5 | 2 | 2 | 0.027568 |
| 2 | 8031 | AG | MISSENSE | nsp3 | 2 | 2 | 2 | 3.5e-05 |
| 3 | 11916 | CT | MISSENSE | nsp7 | 7 | 2 | 2 | 0.021583 |
| 4 | 12478 | GA | MISSENSE | nsp8 | 5 | 2 | 2 | 0.035075 |
| 5 | 14786 | CT | MISSENSE | RNA-dependent RNA polymerase | 3 | 3 | 2 | 0.031151 |
| 6 | 25429 | GT | MISSENSE | ORF3a protein | 3 | 2 | 1 | 0.016583 |
| 7 | 28300 | GT | MISSENSE | nucleocapsid phosphoprotein | 2 | 2 | 2 | 0.027397 |
Polymorphic sites
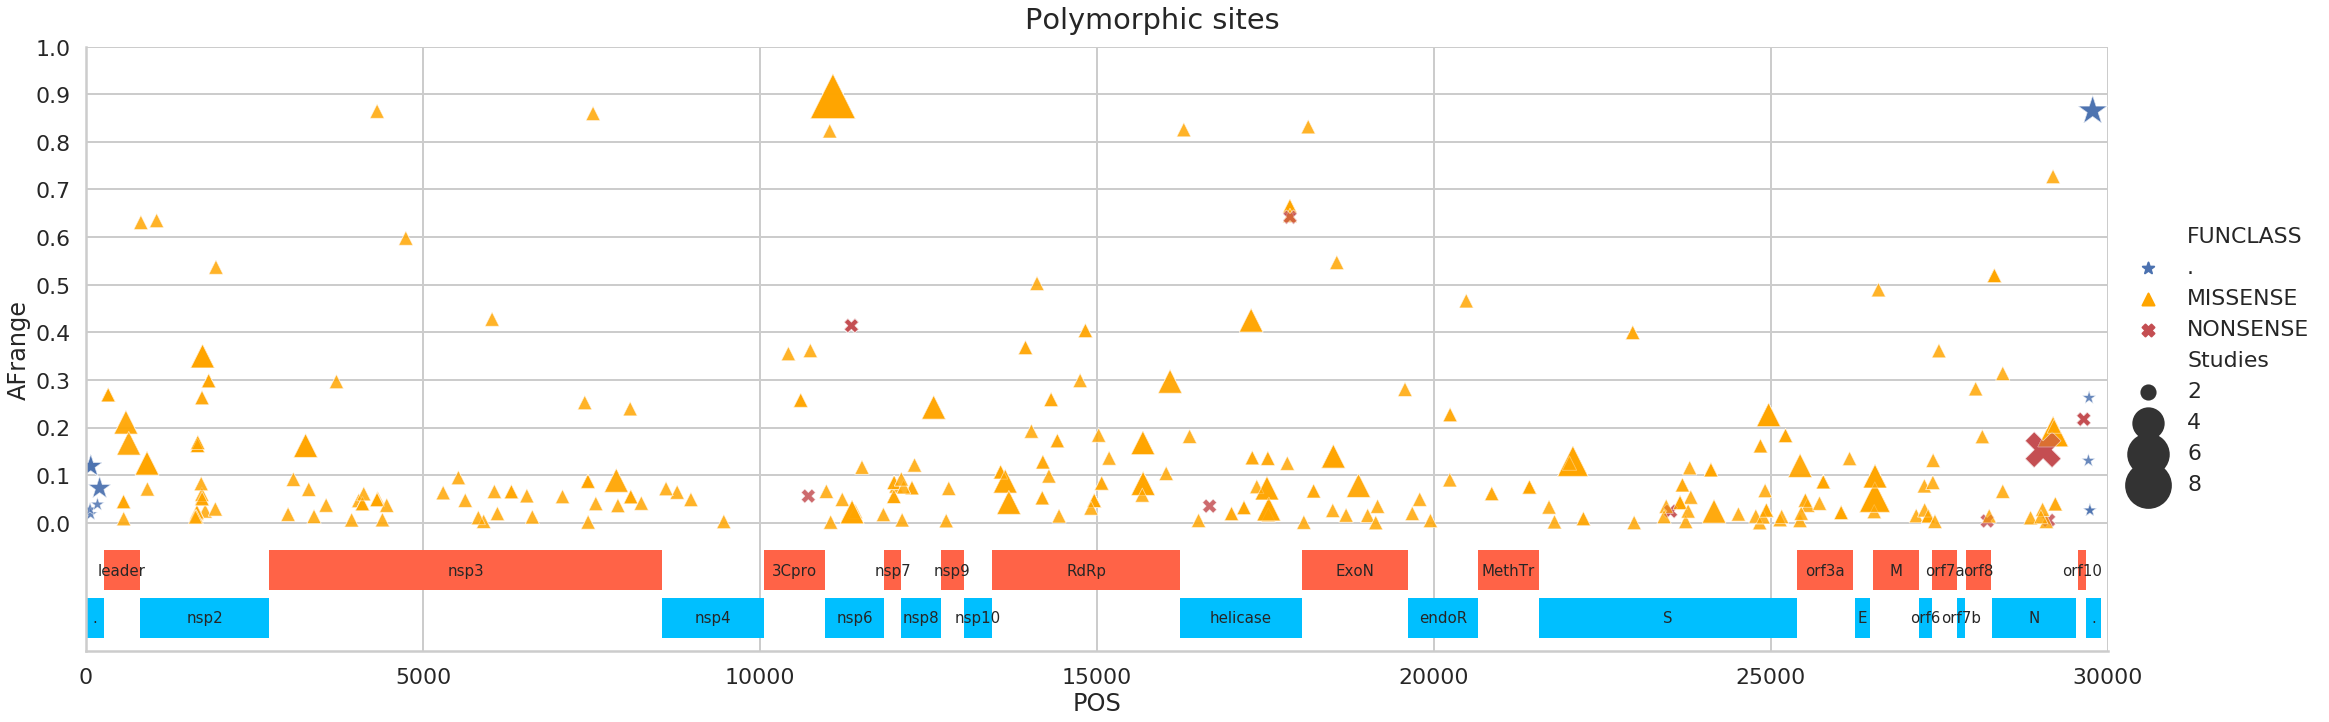
There are many polymorphic sites, so here is a partial list containing only sites supported by >= 3 Studies (the NONSENSE call here is the same that we discussed above):
| POS | change | FUNCLASS | func | Samples | Studies | Strategies | AFrange | |
|---|---|---|---|---|---|---|---|---|
| 0 | 72 | GA | . | . | 5 | 3 | 1 | 0.11878 |
| 1 | 203 | CT | . | . | 3 | 3 | 2 | 0.072665 |
| 2 | 593 | CT | MISSENSE | leader protein | 3 | 3 | 2 | 0.211161 |
| 3 | 635 | CT | MISSENSE | leader protein | 3 | 3 | 2 | 0.166995 |
| 4 | 906 | CT | MISSENSE | nsp2 | 7 | 3 | 2 | 0.125 |
| 5 | 1730 | GA | MISSENSE | nsp2 | 23 | 3 | 2 | 0.35 |
| 6 | 3259 | GT | MISSENSE | nsp3 | 5 | 3 | 1 | 0.162266 |
| 7 | 7869 | CT | MISSENSE | nsp3 | 3 | 3 | 2 | 0.089 |
| 8 | 11083 | GT | MISSENSE | nsp6 | 24 | 7 | 3 | 0.895846 |
| 9 | 11367 | AT | MISSENSE | nsp6 | 5 | 3 | 1 | 0.022661 |
| 10 | 12578 | GT | MISSENSE | nsp8 | 4 | 3 | 1 | 0.24249 |
| 11 | 13640 | AT | MISSENSE | RNA-dependent RNA polymerase | 4 | 3 | 3 | 0.087245 |
| 12 | 13693 | AT | MISSENSE | RNA-dependent RNA polymerase | 4 | 3 | 2 | 0.042662 |
| 13 | 15682 | TA | MISSENSE | RNA-dependent RNA polymerase | 14 | 3 | 3 | 0.167971 |
| 14 | 15685 | TA | MISSENSE | RNA-dependent RNA polymerase | 15 | 3 | 3 | 0.082486 |
| 15 | 16085 | AT | MISSENSE | RNA-dependent RNA polymerase | 3 | 3 | 2 | 0.296992 |
| 16 | 17288 | CT | MISSENSE | helicase | 4 | 3 | 1 | 0.425314 |
| 17 | 17523 | GA | MISSENSE | helicase | 4 | 3 | 2 | 0.072694 |
| 18 | 17549 | TG | MISSENSE | helicase | 9 | 3 | 2 | 0.028718 |
| 19 | 18508 | CT | MISSENSE | 3’-to-5’ exonuclease | 5 | 3 | 2 | 0.139676 |
| 20 | 18881 | CT | MISSENSE | 3’-to-5’ exonuclease | 3 | 3 | 1 | 0.078217 |
| 21 | 22062 | CT | MISSENSE | surface glycoprotein | 7 | 4 | 3 | 0.129441 |
| 22 | 24156 | TC | MISSENSE | surface glycoprotein | 3 | 3 | 3 | 0.024088 |
| 23 | 24966 | AT | MISSENSE | surface glycoprotein | 6 | 3 | 3 | 0.226931 |
| 24 | 25433 | CT | MISSENSE | ORF3a protein | 3 | 3 | 1 | 0.120255 |
| 25 | 26542 | CA | MISSENSE | membrane glycoprotein | 9 | 4 | 3 | 0.053911 |
| 26 | 26545 | TG | MISSENSE | membrane glycoprotein | 9 | 3 | 3 | 0.09785 |
| 27 | 29039 | AT | NONSENSE | nucleocapsid phosphoprotein | 29 | 5 | 3 | 0.153384 |
| 28 | 29187 | CT | MISSENSE | nucleocapsid phosphoprotein | 33 | 4 | 2 | 0.191402 |
| 29 | 29774 | CT | . | . | 5 | 4 | 2 | 0.865321 |
Mixed sites
This is perhaps the most interesting category:
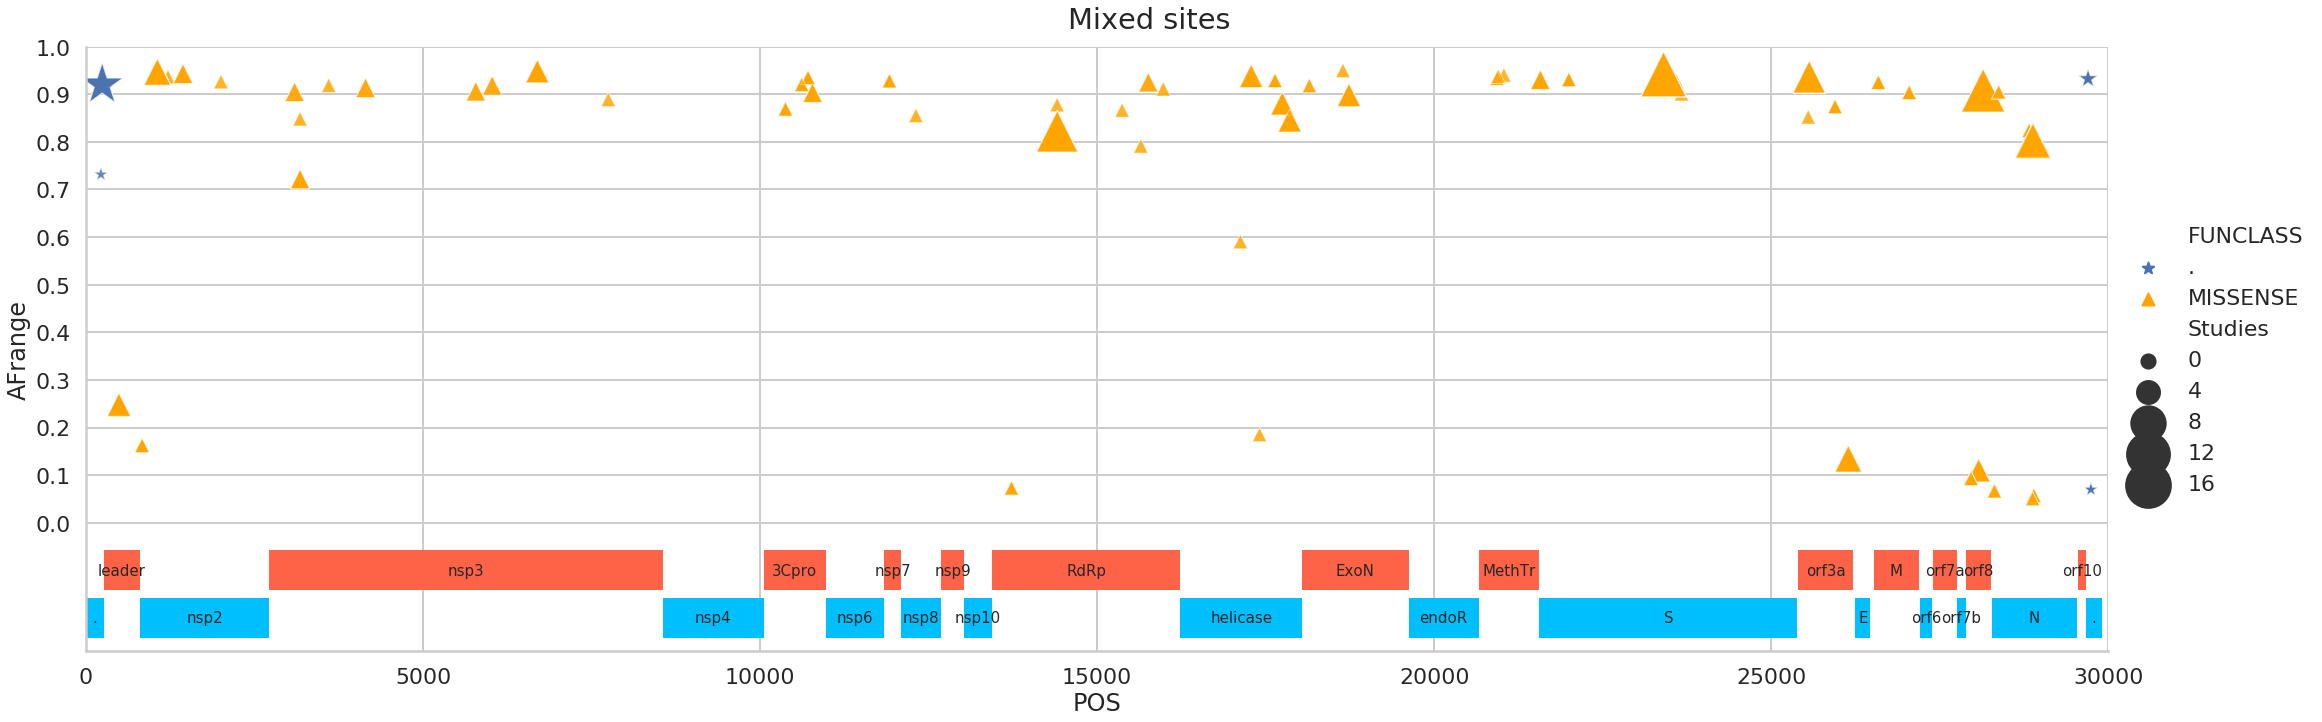
Here is a partial list of sites supported by at least four Studies:
| POS | change | FUNCLASS | GENE | func | Samples | Studies | Strategies | AFrange | |
|---|---|---|---|---|---|---|---|---|---|
| 0 | 241 | CT | . | . | . | 413 | 12 | 5 | 0.92 |
| 1 | 490 | TA | MISSENSE | orf1ab | leader protein | 11 | 4 | 2 | 0.247869 |
| 2 | 1059 | CT | MISSENSE | orf1ab | nsp2 | 265 | 5 | 3 | 0.946809 |
| 9 | 6696 | CT | MISSENSE | orf1ab | nsp3 | 7 | 4 | 2 | 0.948255 |
| 10 | 10779 | TA | MISSENSE | orf1ab | 3C-like proteinase | 10 | 3 | 1 | 0.90319 |
| 11 | 14408 | CT | MISSENSE | orf1ab | RNA-dependent RNA polymerase | 537 | 11 | 5 | 0.821792 |
| 12 | 15760 | GA | MISSENSE | orf1ab | RNA-dependent RNA polymerase | 3 | 3 | 2 | 0.924901 |
| 13 | 17285 | CT | MISSENSE | orf1ab | helicase | 6 | 4 | 2 | 0.938289 |
| 14 | 17747 | CT | MISSENSE | orf1ab | helicase | 93 | 4 | 3 | 0.880492 |
| 15 | 17858 | AG | MISSENSE | orf1ab | helicase | 93 | 4 | 3 | 0.844828 |
| 16 | 18736 | TC | MISSENSE | orf1ab | 3’-to-5’ exonuclease | 9 | 4 | 2 | 0.898305 |
| 18 | 23403 | AG | MISSENSE | S | surface glycoprotein | 482 | 13 | 5 | 0.941878 |
| 20 | 25563 | GT | MISSENSE | ORF3a | ORF3a protein | 340 | 7 | 3 | 0.936221 |
| 21 | 26144 | GT | MISSENSE | ORF3a | ORF3a protein | 30 | 5 | 2 | 0.134199 |
| 22 | 28077 | GC | MISSENSE | ORF8 | ORF8 protein | 11 | 4 | 2 | 0.109966 |
| 23 | 28144 | TC | MISSENSE | ORF8 | ORF8 protein | 187 | 12 | 4 | 0.907761 |
| 24 | 28881 | GA | MISSENSE | N | nucleocapsid phosphoprotein | 17 | 8 | 4 | 0.803922 |
| 25 | 28883 | GC | MISSENSE | N | nucleocapsid phosphoprotein | 17 | 8 | 4 | 0.80198 |
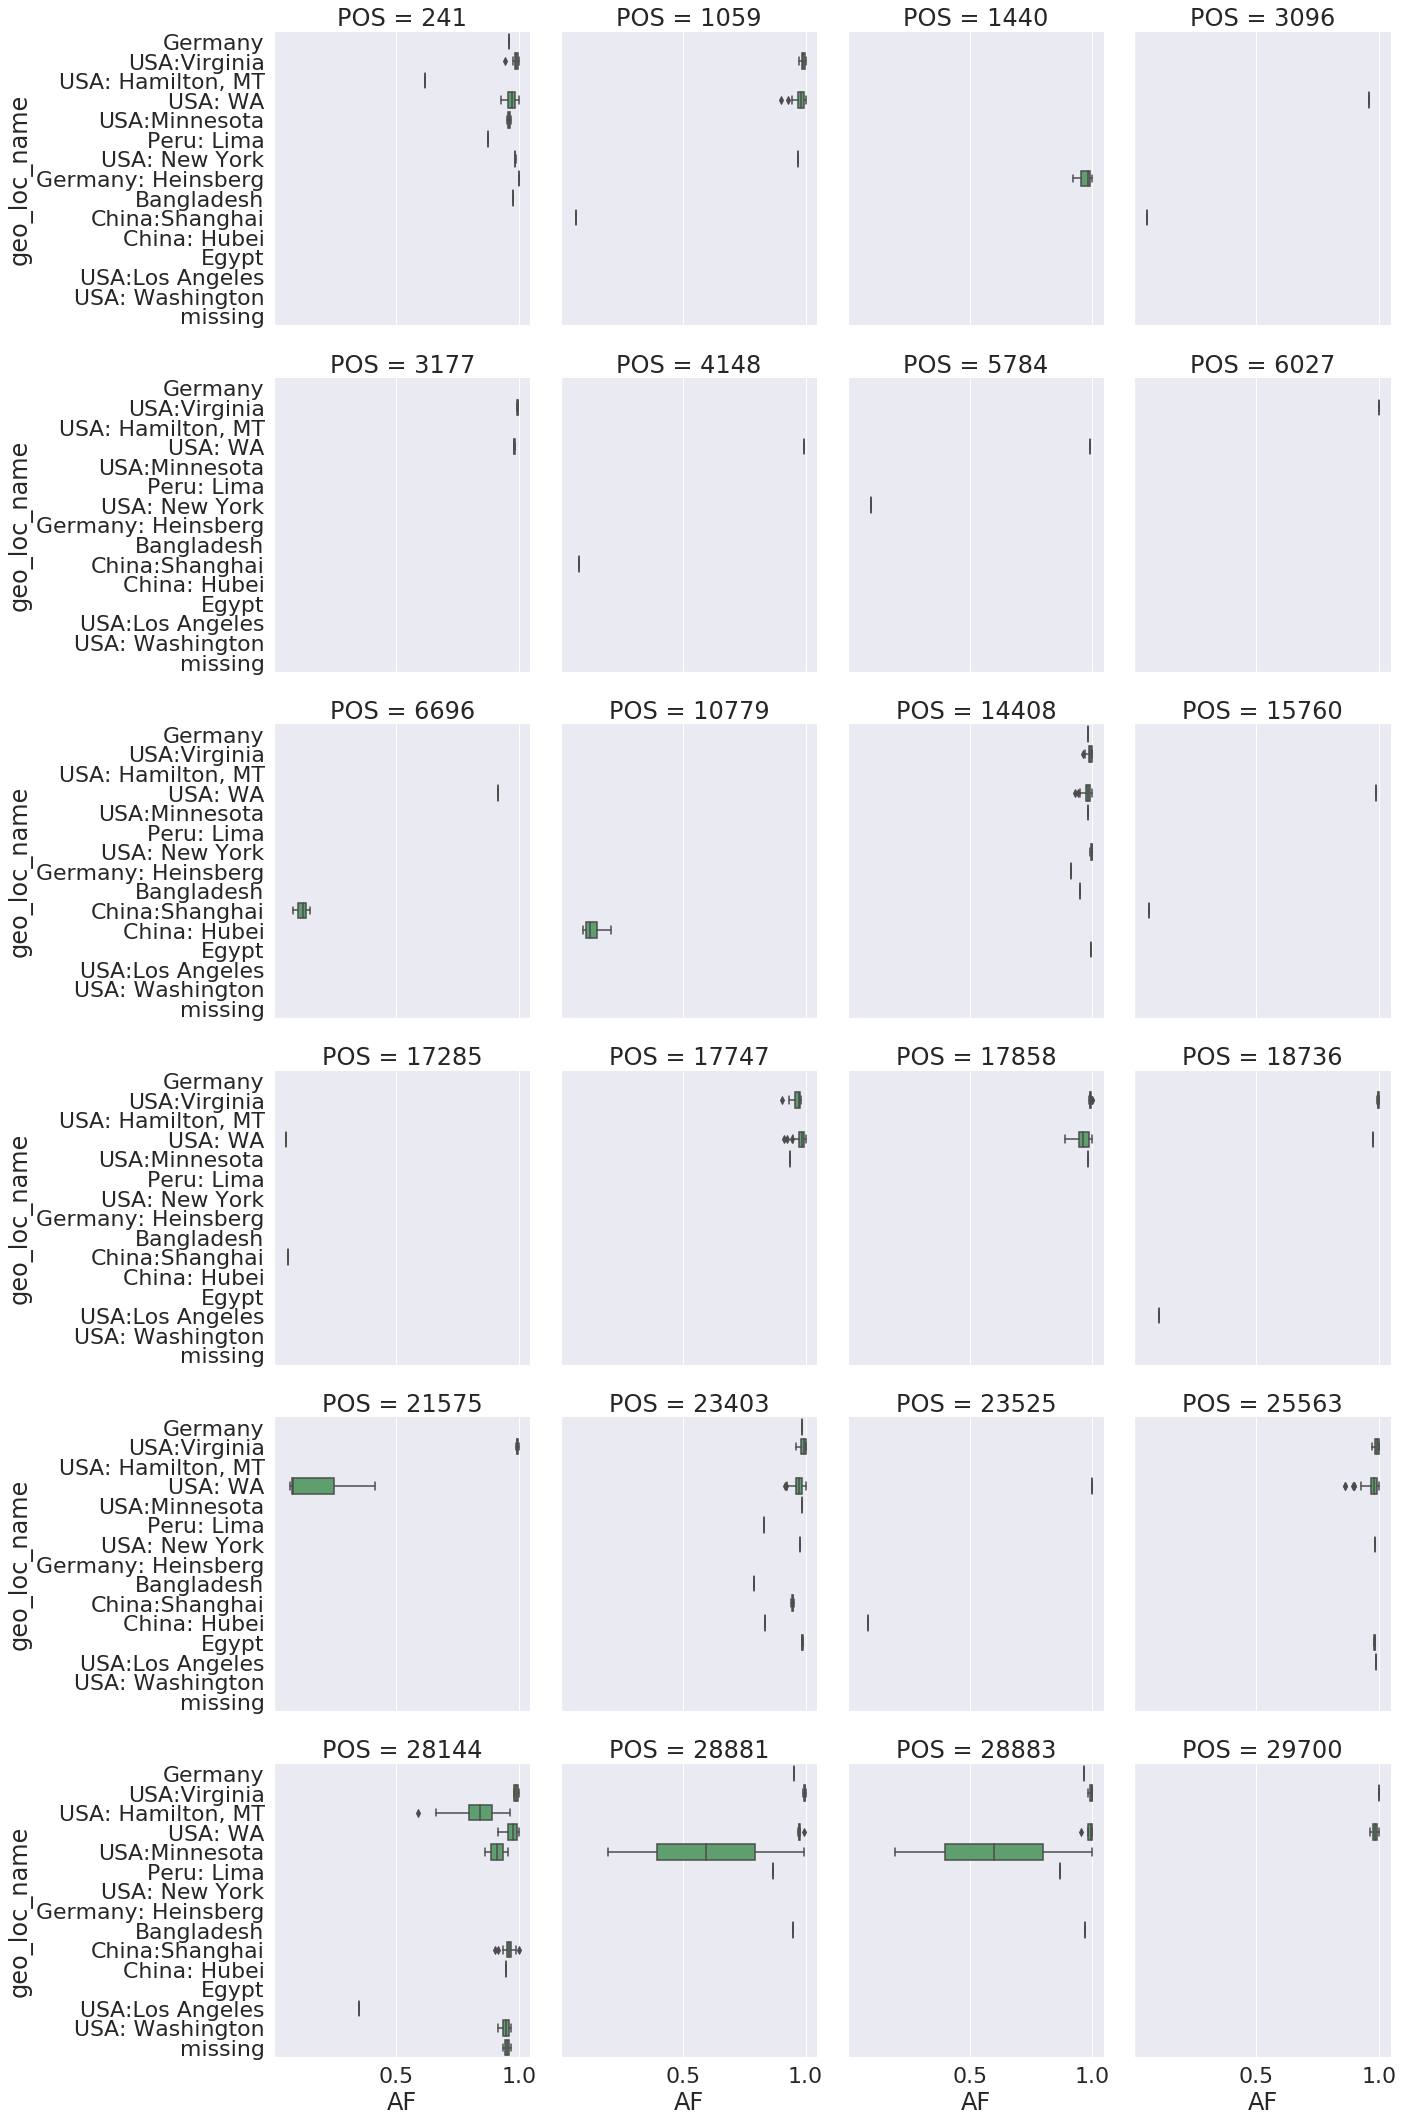
Here is another view showing distribution of alternative allele frequencies for top mixed sites across sample collection locations:
.
Comparison with sites under selection
There is a good concordance between intrahost variable sites and sites under selection
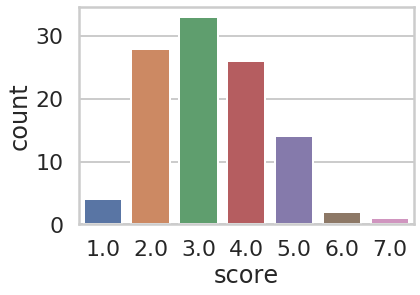
Finally we wanted to see how our results compare with the selection analysis descrtibed here. The selection analysis ranks sites based on belonging to one of more of the following categories (see this for detailed description:
- evidence of selection (pervasive, episodic, or negative)
- multiple selective events
- increase in the allele frequency
- high frequency variants
- evolutionary unexpected variants
- non-neutral evolution at that site in other coronoviruses
- belonging to CTL-epitopes
Based on these criteria each site is given a score between 1 and 7 (a TSV representation of this dataset is available here). Among 142 sites with score > 0 it is distributed in the following way:
We first intersected all selected sites with
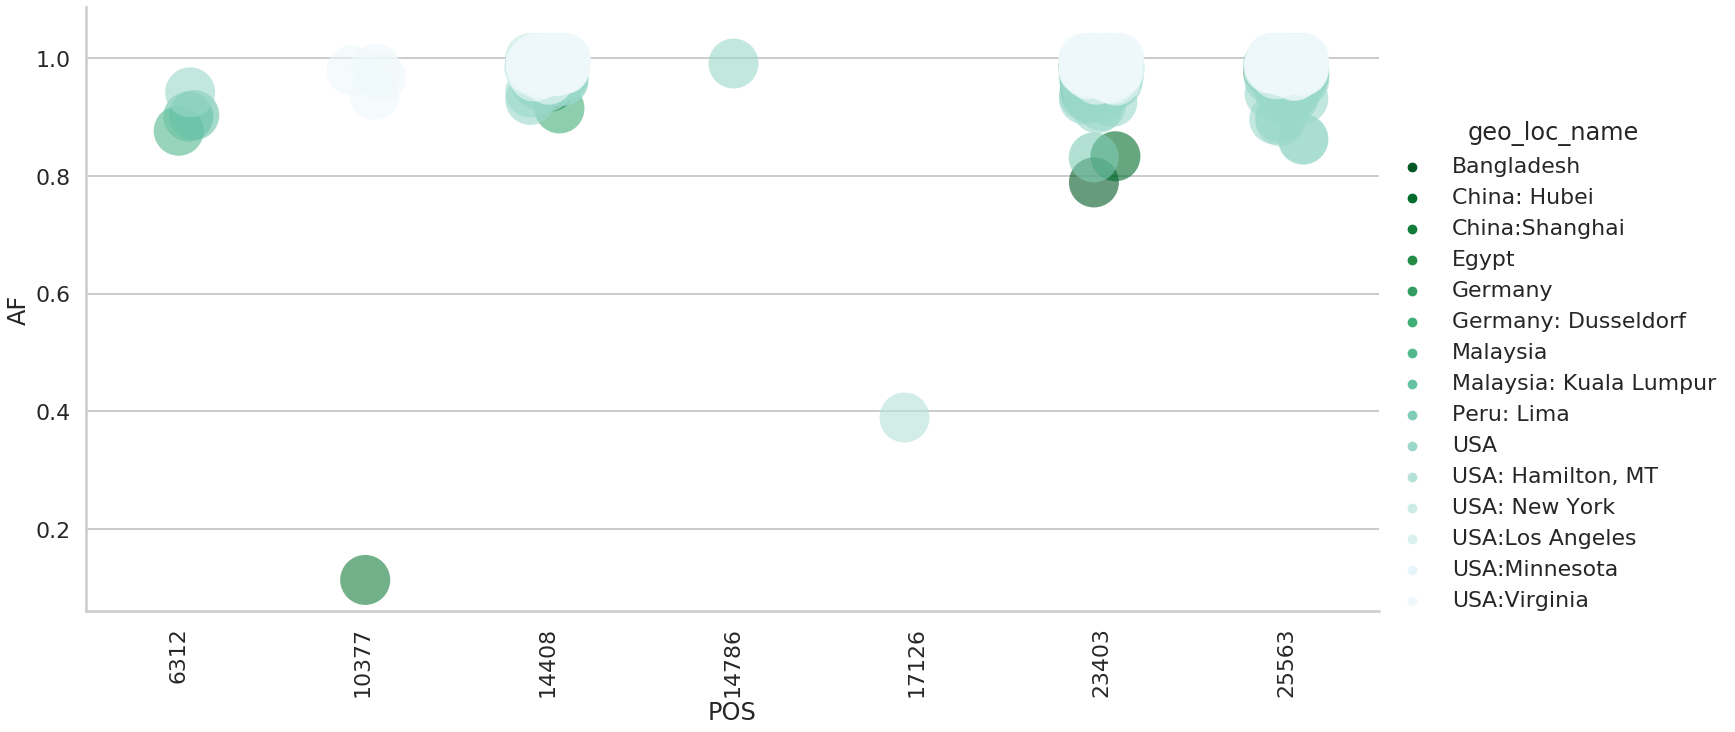
score > 0 with variants on our dateset. Among 286 nonsynonymous sites 27 (~10%) were under selection. We then restricted our analysis to 17 most reliable sites under selection with score > 4. Seven of these sites were shared with our dataset:
| POS | change | func | Samples | Studies | Strategies | score | multiple_clades | related_selection | |
|---|---|---|---|---|---|---|---|---|---|
| 0 | 6312 | CA | nsp3 | 4 | 2 | 2 | 5 | 5 | 1 |
| 1 | 10377 | CT | 3Cpro | 5 | 2 | 1 | 5 | 2 | 1 |
| 2 | 14408 | CT | RdRp | 537 | 11 | 5 | 7 | 15 | 1 |
| 3 | 14786 | CT | RdRp | 3 | 3 | 2 | 5 | 4 | 0 |
| 4 | 17126 | TC | helicase | 2 | 2 | 2 | 6 | 2 | 1 |
| 5 | 23403 | AG | S | 482 | 13 | 5 | 5 | 31 | 0 |
| 6 | 25563 | GT | orf3a | 340 | 7 | 3 | 6 | 7 | 1 |
and the variation in allele frequencies across these sites:
More to come …