Epidemiological data from the 2019 nCoV outbreak: early descriptions
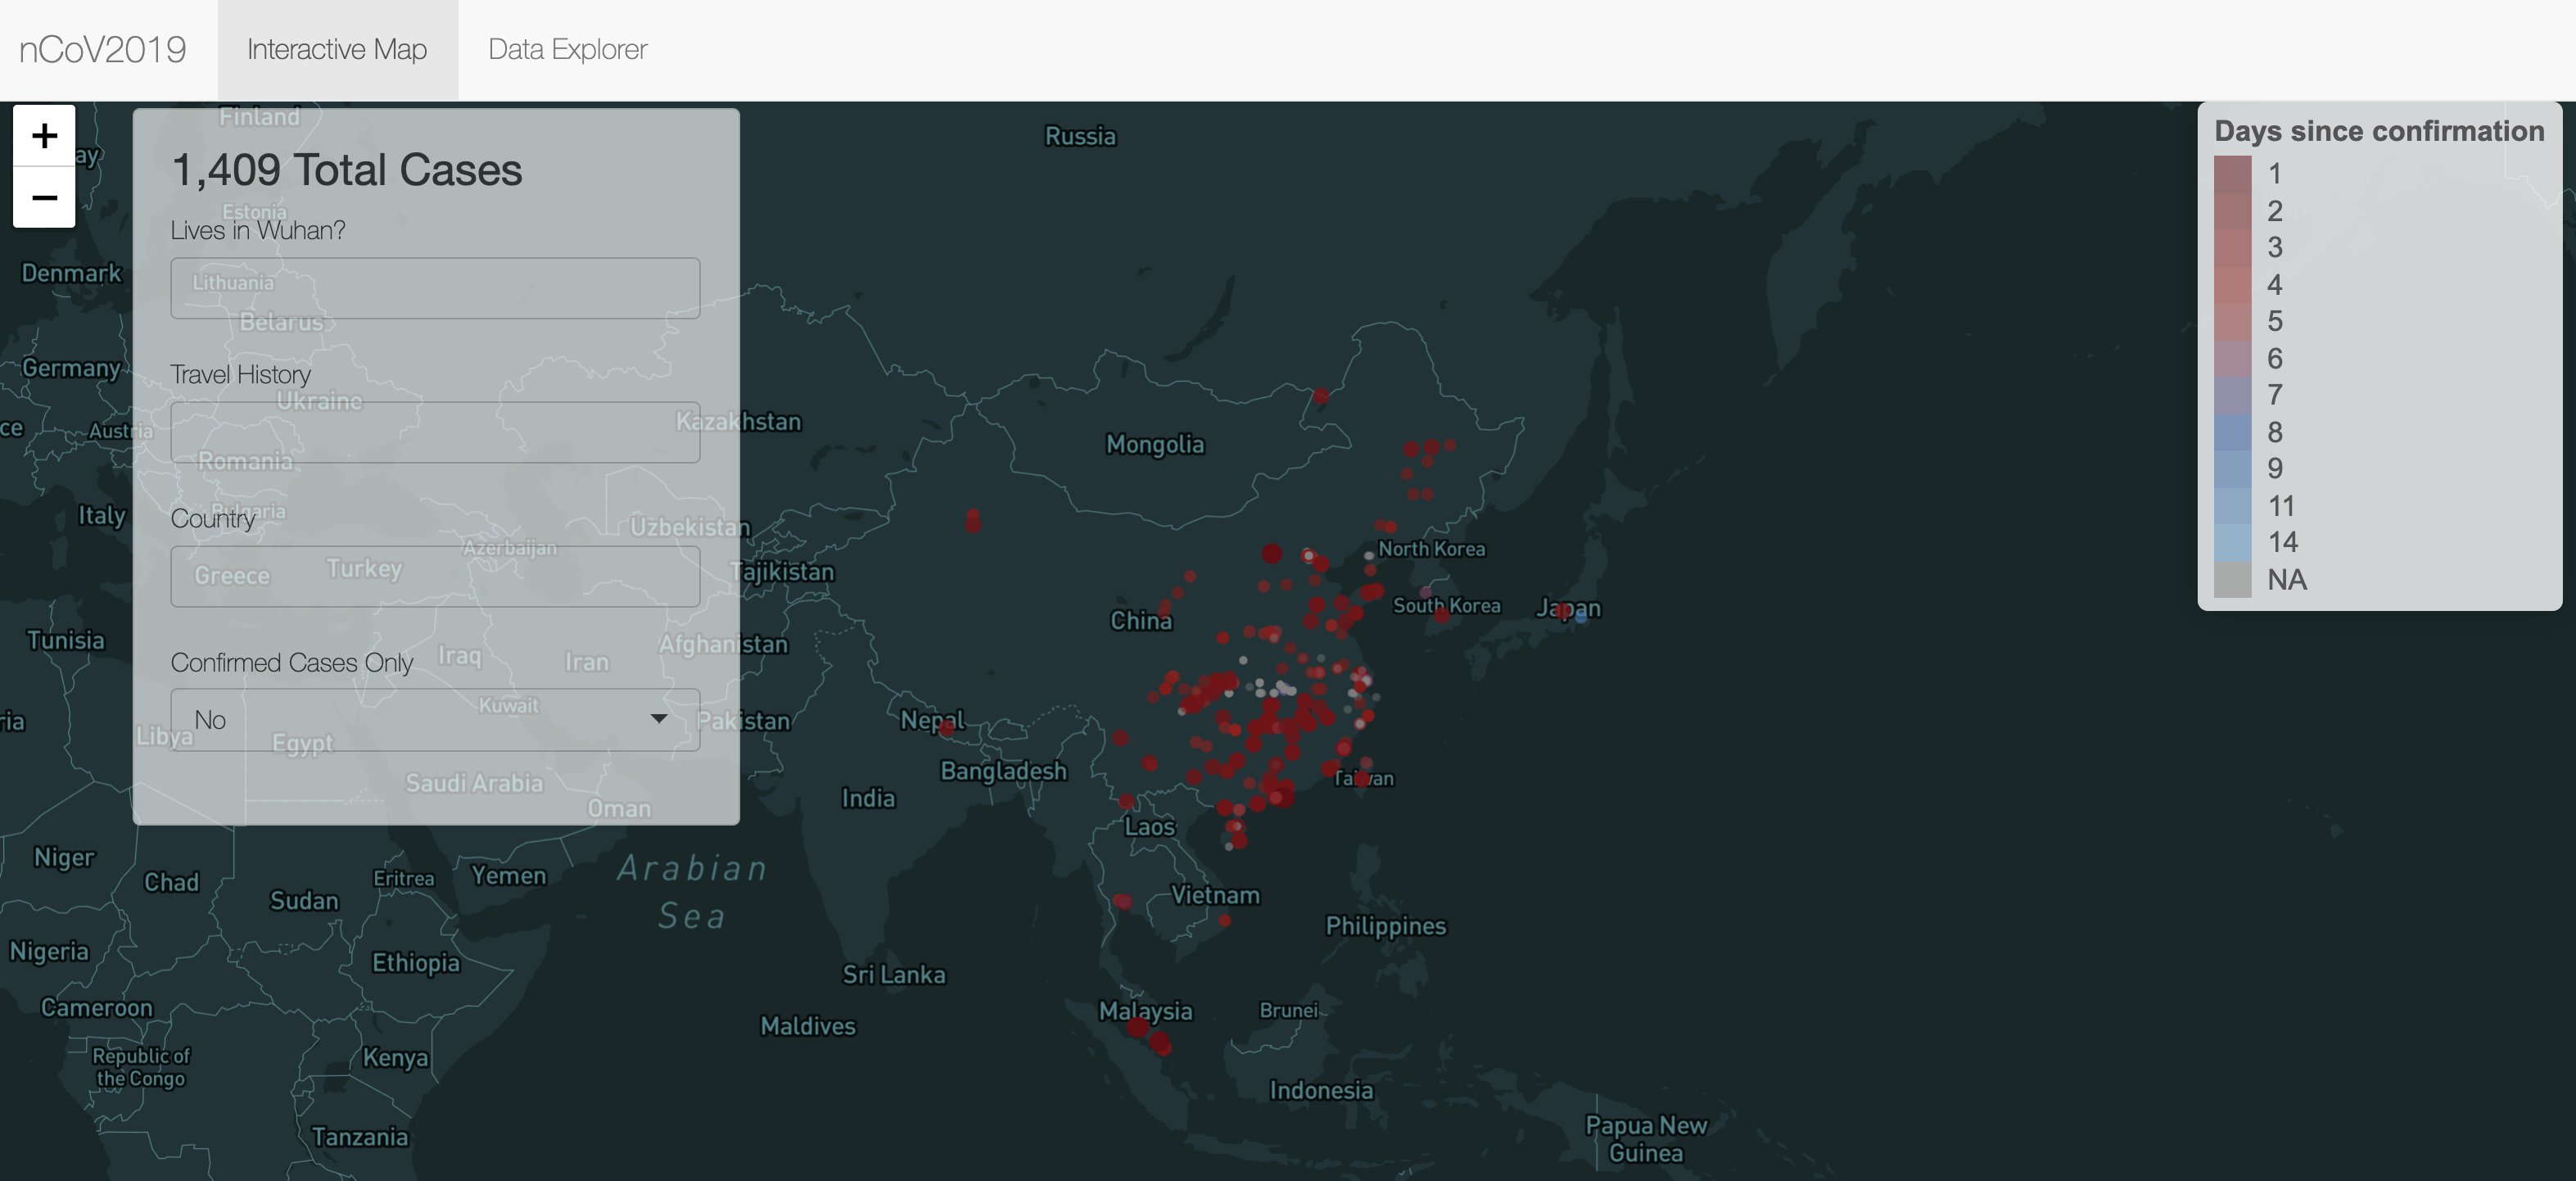
We have collected publicly available information on cases confirmed during the ongoing nCoV-2019 outbreak. Data were entered in a spreadsheet with each line representing a unique case, including age, sex, geographic information, history and time of travel where available. Sources were included as a reference for each entry. Data is openly available here: COVID19_2020_open_line_list - Google Sheets and was last updated at 5pm, GMT, January 23, 2020. We encourage the use of these data, which is intended as a resource for the community.
In this initial release we focus on cases that were reported outside of Wuhan (202) and fatal cases in Wuhan that had good metadata (18). An initial timeline of events is published below which was last updated on January 21, 7:50pm GMT (Figure 1).
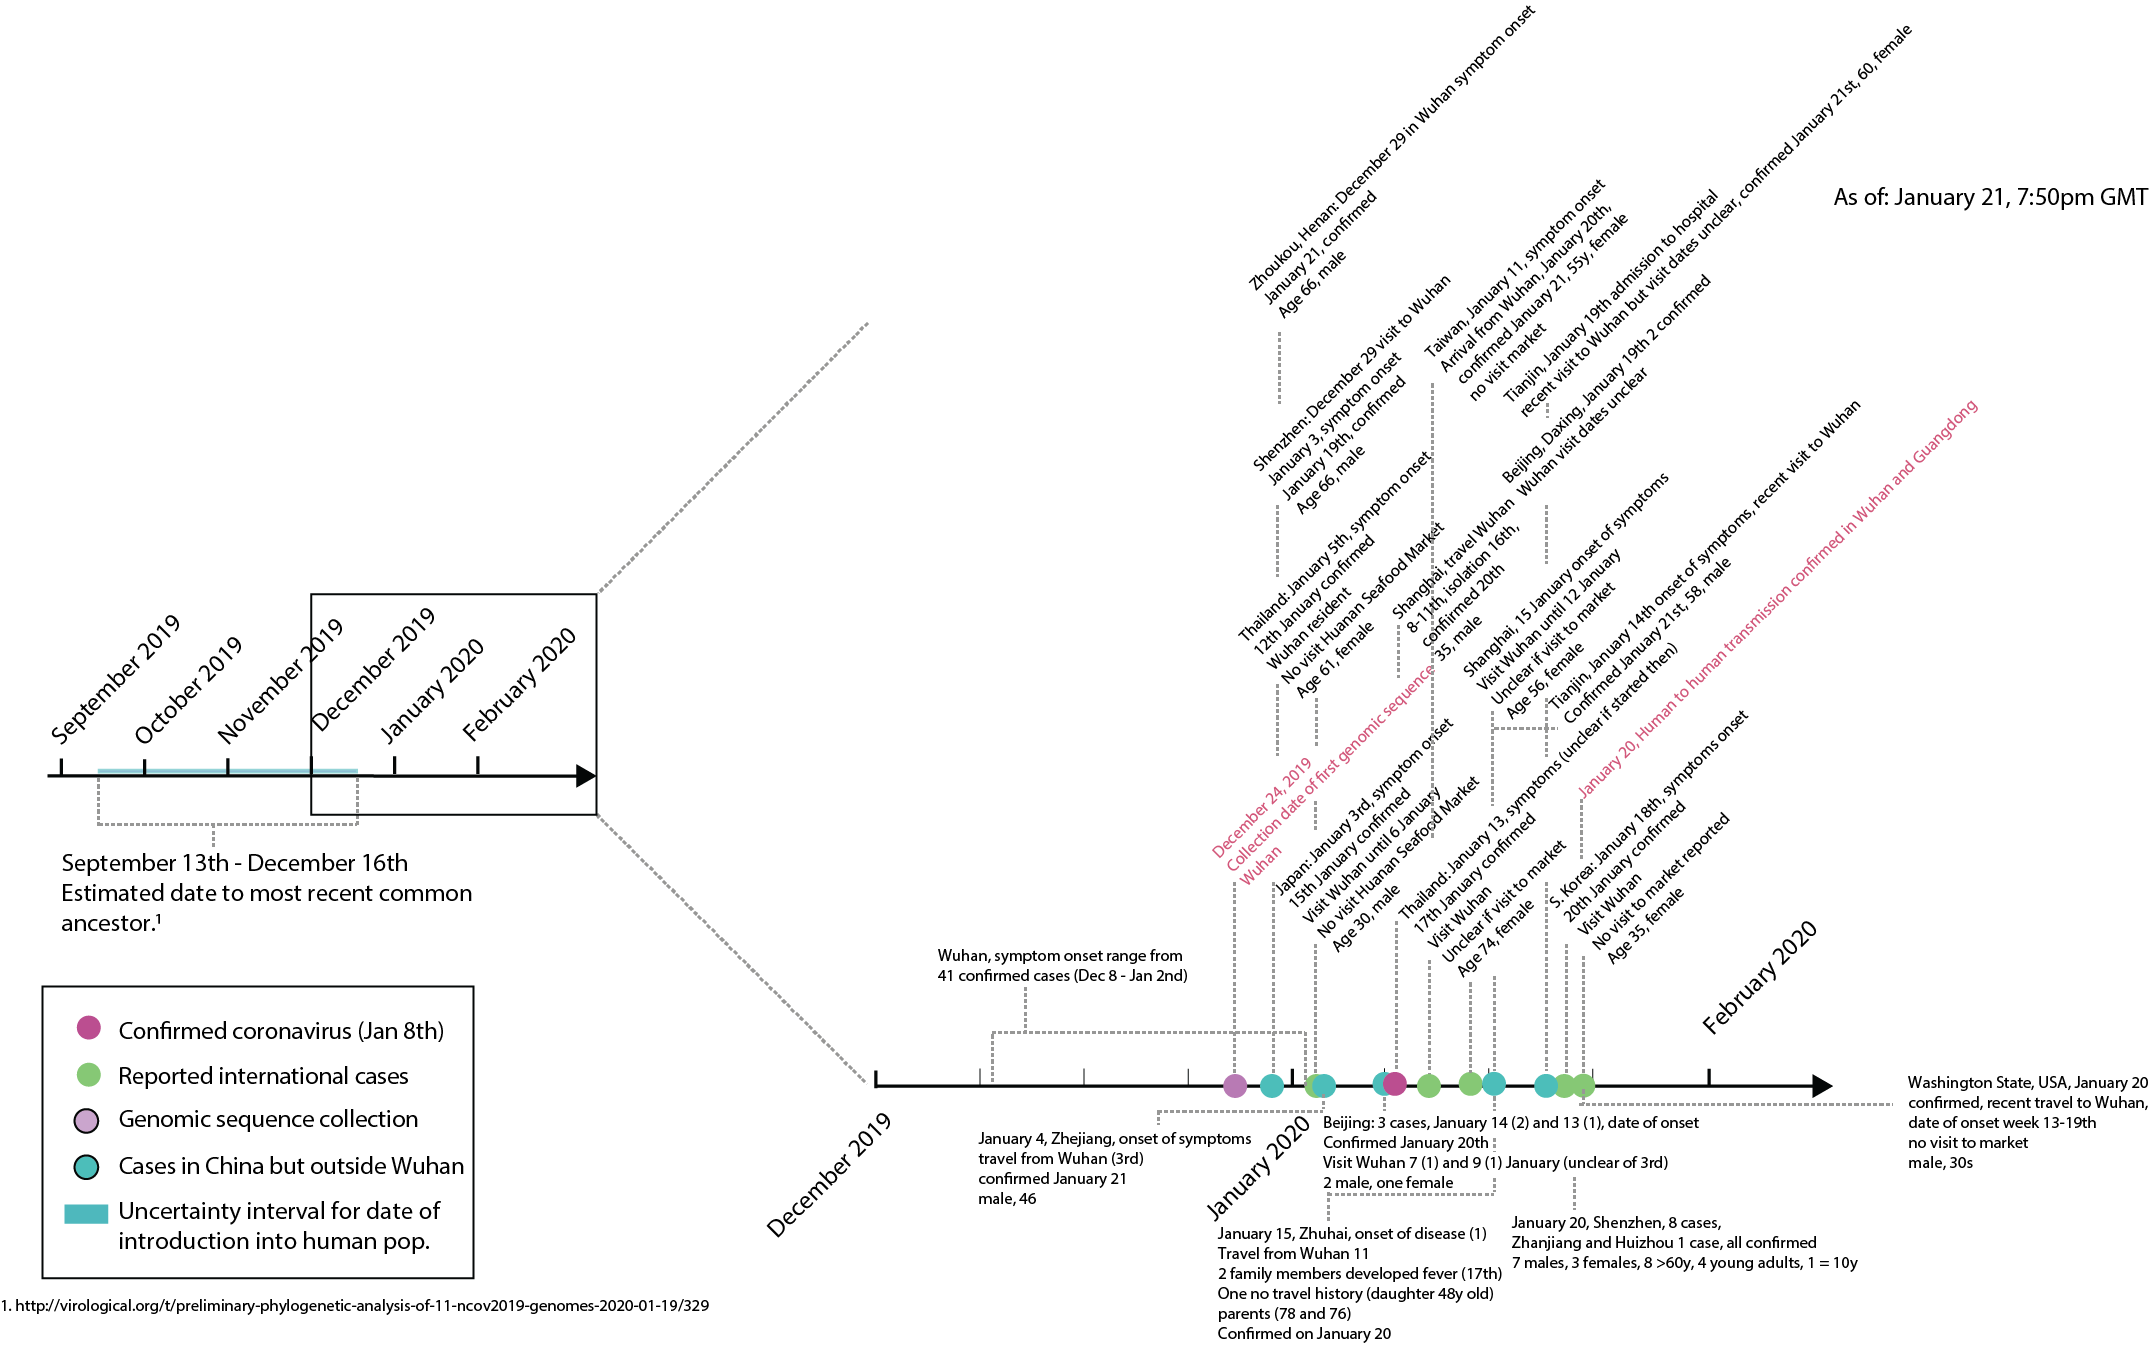
Figure 1: Timeline of events during the ongoing nCoV 2019/2020 outbreak. Last update January 21.
In the current database 202 cases of confirmed nCoV are entered from 27 provinces in China and all cases that were reported outside of mainland China (Japan (1), South Korea (1), Macau (2), Hong Kong (2), Taiwan (1), Thailand (4), Singapore (1)). Of the cases outside of Wuhan (from which we only have detailed information for the fatal cases), about half (88, 45%) contain demographic information and 133 contain information about the date of confirmation. Of those cases the mean age of infection was 47 years of age ranging from 15 - 88 (Figure 2). 37% of cases were female and 63% male. Age distributions recorded here in are based almost exclusively on those patients reporting disease outside Wuhan, of which the majority with known travel history report travel to Wuhan (business, study trip, family visits, tourism, among others). It should therefore not be assumed that this age distribution is necessarily representative of the affected residents within Wuhan.

Figure 2: Age distribution of 106 confirmed cases.
Reported symptoms included fever, respiratory symptoms, cough, discomfort, trouble breathing, fatigue, chills, sore throat, cold, dizziness, chest tightness, body soreness, headache, dyspnea, running nose, and muscle aches. The average time from reported date of onset of symptoms to date of hospital admission was 2.96 days (median = 1). The average time from date of onset of symptoms to date of confirmation was 6.17 days (median = 5) (Figure 3).
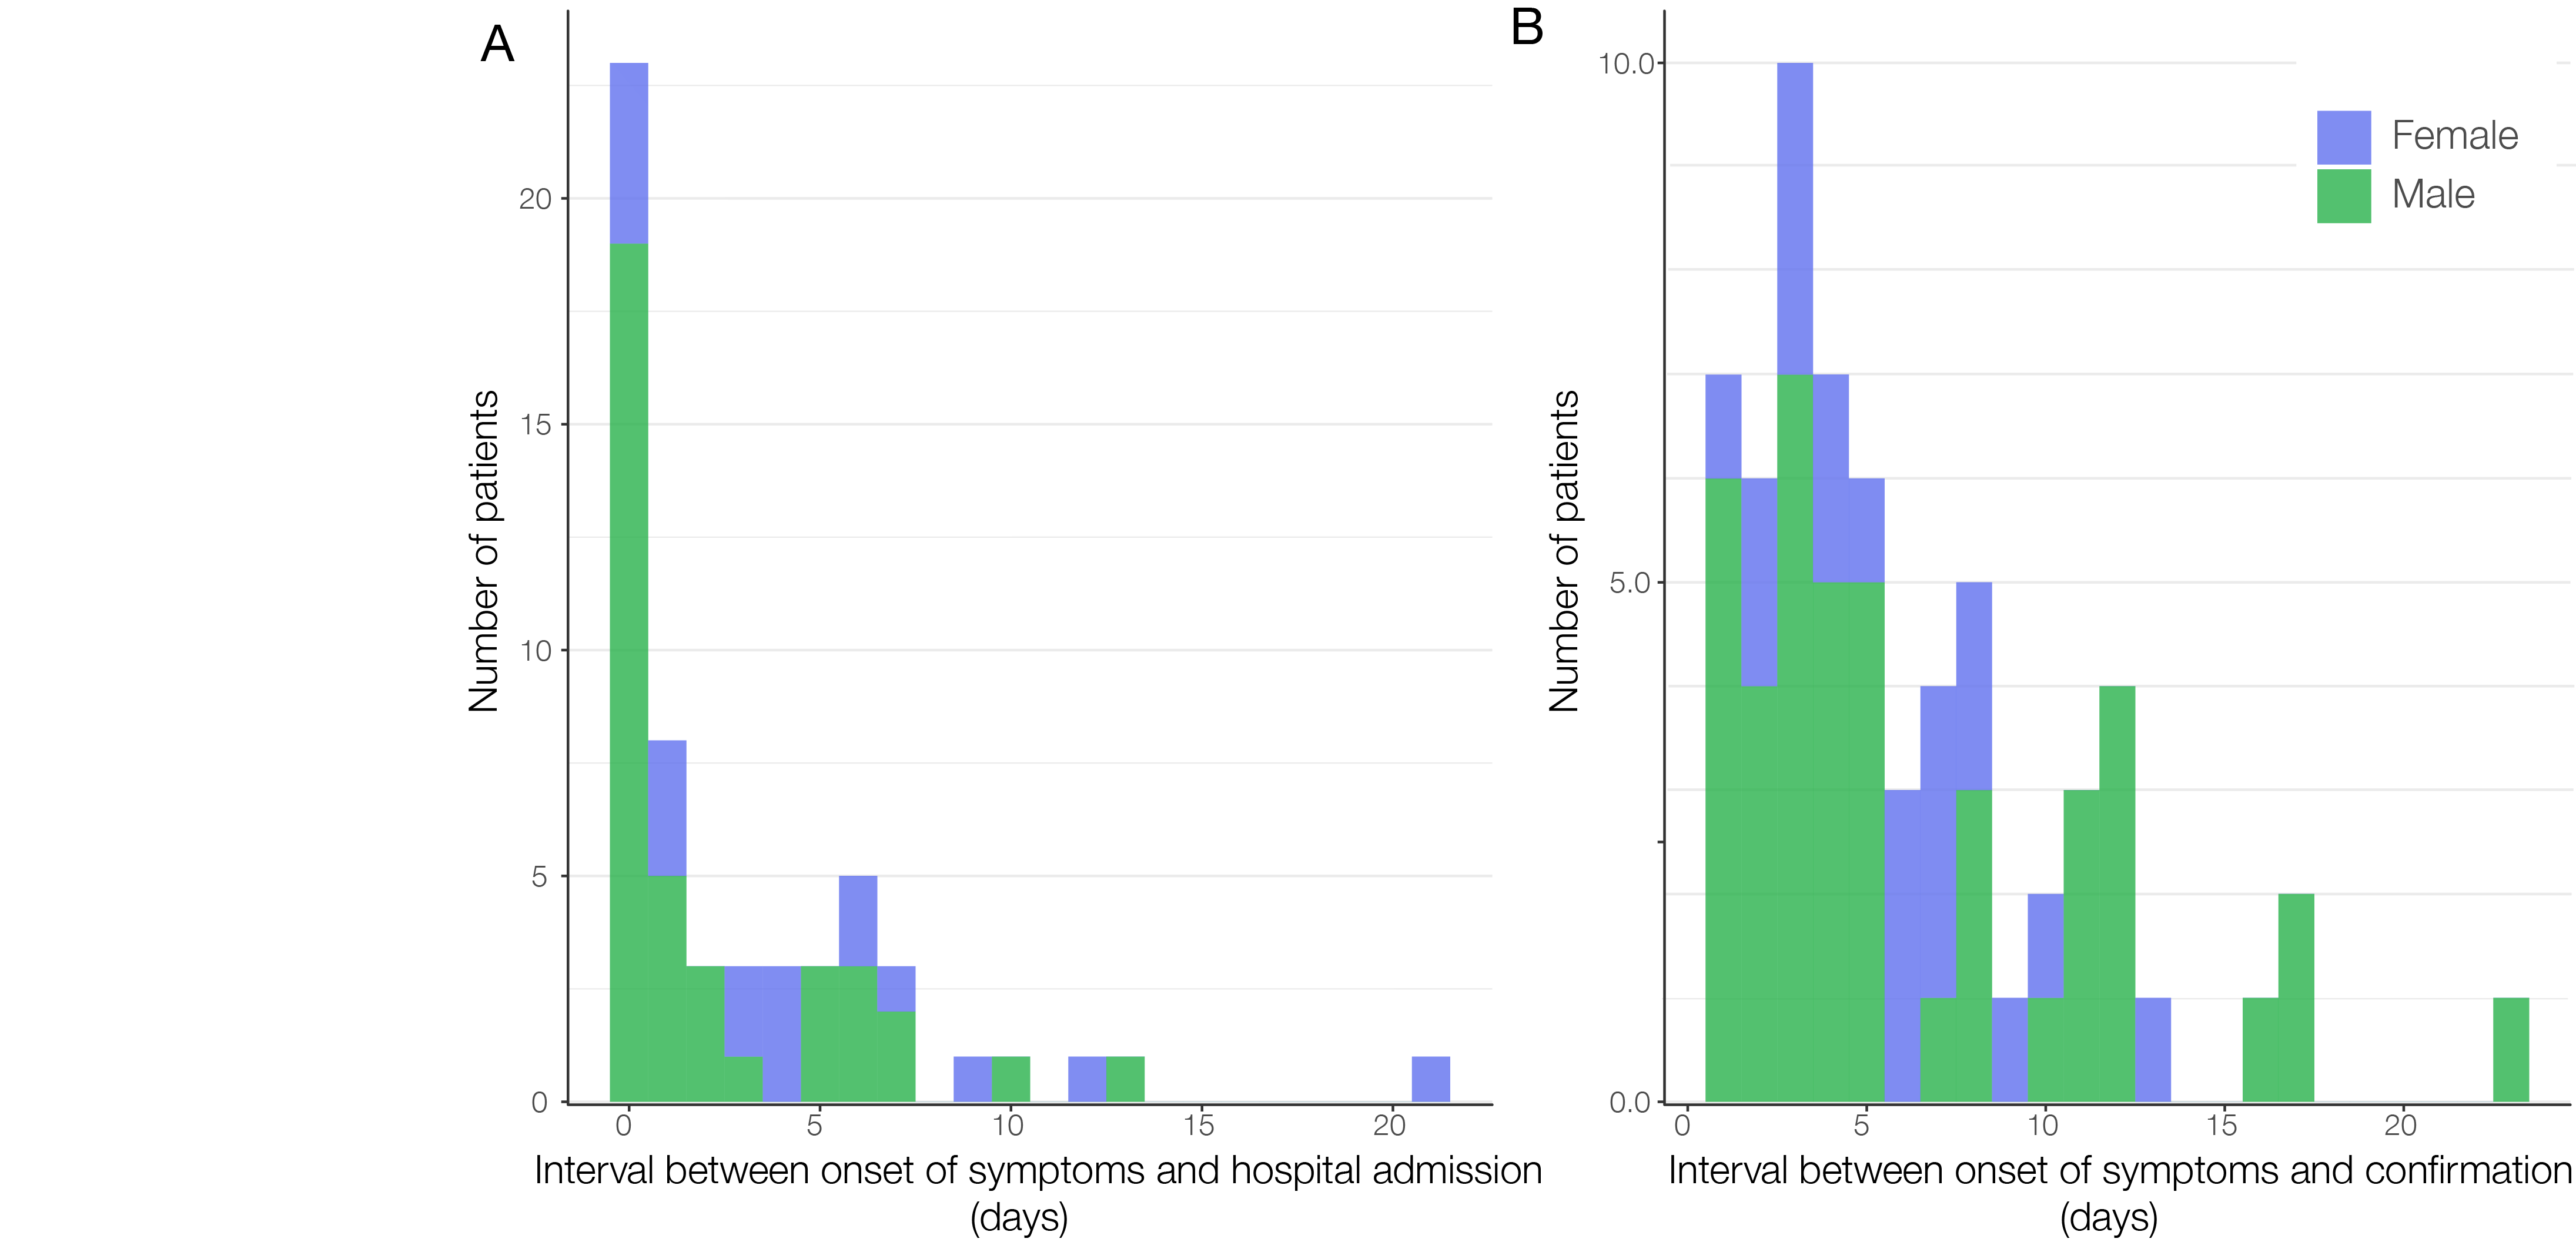
Figure 3: Summary of data showing the interval between date of onset of disease and date of admission to hospital (56 patients) (A) and date of onset of disease and data of confirmation (63 patients) (B).
Data availability
This database is being updated regularly and epidemiological information about Wuhan will be included over the coming days. Data are compiled from openly available sources only. We have tried to ensure accuracy of data compilation, but cannot take responsibility for any unintentional errors that may have occurred. Please email us if you have any additional information that would be useful to be include, or any suggested edits. Those information may include updates on recorded cases, especially demographics, clinical outcome, and details on the clusters in Wuhan and Guangdong.
Moritz Kraemer, University of Oxford, UK: [email protected]
David Pigott, University of Washington, USA: [email protected]
Bo Xu, Tsinghua University, China and University of Oxford, UK:
[email protected]
Sarah Hill, University of Oxford, UK
Bernardo Gutierrez, University of Oxford, UK
Oliver Pybus, University of Oxford, UK