Transmission of SARS-CoV-2 Lineage B.1.1.7 in England: Insights from linking epidemiological and genetic data
Erik Volz1*+, Swapnil Mishra1*, Meera Chand4*, Jeffrey C. Barrett5*, Robert Johnson1*, Lily Geidelberg1, Wes R Hinsley1, Daniel J Laydon1, Gavin Dabrera4, Áine O’Toole3, Roberto Amato5, Manon Ragonnet-Cronin1, Ian Harrison4, Ben Jackson3, Cristina V. Ariani5, Olivia Boyd1, Nicholas J Loman4,6, John T McCrone3, Sónia Gonçalves5, David Jorgensen1, Richard Myers4, Verity Hill3, David K. Jackson5, Katy Gaythorpe1, Natalie Groves4, John Sillitoe5, Dominic P. Kwiatkowski5, The COVID-19 Genomics UK (COG-UK) consortium7, Seth Flaxman2, Oliver Ratmann2, Samir Bhatt1, Susan Hopkins4, Axel Gandy2*, Andrew Rambaut3*, Neil M Ferguson1*+
- MRC Centre for Global Infectious Disease Analysis, Jameel Institute for Disease and Emergency Analytics, Imperial College London, St Mary’s Campus, Norfolk Place, London, W2 1PG, UK
- Department of Mathematics, Imperial College London, South Kensington Campus, London SW7 2AZ, UK
- Institute of Evolutionary Biology, University of Edinburgh, Ashworth Laboratories, Charlotte Auerbach Road, Edinburgh, EH9 3FL, UK
- Public Health England, Wellington House, Waterloo Road, London SE1 8UG
- Wellcome Sanger Institute, Wellcome Genome Campus, Hinxton, Cambridge, CB10 1SA, UK
- Institute of Microbiology and Infection, University of Birmingham, Edgbaston, Birmingham, B15 2TT, UK
- https://www.cogconsortium.uk
*Equal contribution.
+ Correspondence: [email protected] and [email protected]
Abstract
The SARS-CoV-2 lineage B.1.1.7, now designated Variant of Concern 202012/01 (VOC) by Public Health England, originated in the UK in late Summer to early Autumn 2020. We examine epidemiological evidence for this VOC having a transmission advantage from several perspectives. First, whole genome sequence data collected from community-based diagnostic testing provides an indication of changing prevalence of different genetic variants through time. Phylodynamic modelling additionally indicates that genetic diversity of this lineage has changed in a manner consistent with exponential growth. Second, we find that changes in VOC frequency inferred from genetic data correspond closely to changes inferred by S-gene target failures (SGTF) in community-based diagnostic PCR testing. Third, we examine growth trends in SGTF and non-SGTF case numbers at local area level across England, and show that the VOC has higher transmissibility than non-VOC lineages, even if the VOC has a different latent period or generation time. Available SGTF data indicate a shift in the age composition of reported cases, with a larger share of under 20 year olds among reported VOC than non-VOC cases. Fourth, we assess the association of VOC frequency with independent estimates of the overall SARS-CoV-2 reproduction number through time. Finally, we fit a semi-mechanistic model directly to local VOC and non-VOC case incidence to estimate the reproduction numbers over time for each. There is a consensus among all analyses that the VOC has a substantial transmission advantage, with the estimated difference in reproduction numbers between VOC and non-VOC ranging between 0.4 and 0.7, and the ratio of reproduction numbers varying between 1.4 and 1.8. We note that these estimates of transmission advantage apply to a period where high levels of social distancing were in place in England; extrapolation to other transmission contexts therefore requires caution.
Introduction
A novel SARS-CoV-2 lineage, originally termed variant B.1.1.7, is rapidly expanding its geographic range and frequency in England. The lineage was detected in November 2020, and likely originated in September 2020 in the South East region of England. As of 20 December 2020, the regions in England with the largest numbers of confirmed cases of the variant are London, the South East, and the East of England. The variant possesses a large number of non-synonymous substitutions of immunologic significance1. The N501Y replacement on the spike protein has been shown to increase ACE2 binding 2,3 and cell infectivity in animal models4, while the P618H replacement on the spike proteins adjoins the furin-cleavage site5. The variant also possesses a deletion at positions 69 and 70 of the spike protein (Δ69-70) which has been associated with diagnostic test failure for the ThermoFisher TaqPath probe targeting the spike protein6. Whilst other variants with Δ69-70 are also circulating in the UK, the absence of detection of the S gene target in an otherwise positive PCR test increasingly appears to be a highly specific marker for the B.1.1.7 lineage. Surveillance data from national community testing (“Pillar 2”) showed a rapid increase in S-gene target failures (SGTF) in PCR testing for SARS-CoV-2 in November and December 2020, and the B.1.1.7 lineage has now been designated Variant of Concern (VOC) 202012/01 by Public Health England (PHE).
Phylogenetic studies carried out by the UK COVID-19 Genomics Consortium (COG-UK)7 provided the first indication that the VOC has an unusual accumulation of substitutions and was growing at a large rate relative to other circulating lineages. Here we analyse VOC whole genomes collected between October and 5 December 2020 and find that the rate of increase in the frequency of VOC is consistent with a transmission advantage over other circulating lineages in the UK. To substantiate these findings, we investigate time trends in the proportion of PCR tests exhibiting SGTF across the UK on ~275,000 test results as a biomarker of VOC infection, and examine the relationship between local epidemic growth and the frequency of the VOC. We demonstrate that increasing reproduction numbers (‘R’ values) are associated with increased SGTF frequency among reported cases, our biomarker of VOC infection, and confirm this association through a variety of analytical approaches. Critically, we find evidence that non-pharmaceutical interventions (NPIs) were sufficient to control non-VOC lineages to reproduction numbers below 1 during the November 2020 lockdown in England, but that at the same time the NPIs were insufficient to control the VOC.
Origins and expansion of VOC 202012/01
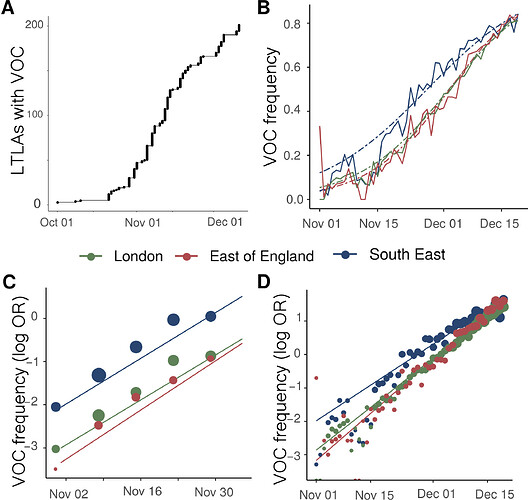
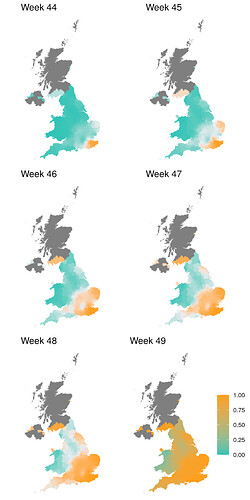
We examined the time and location of sampling of 1,904 VOC whole genomes collected between October and 5 December 2020, combined with a genetic background of 48,128 genomes collected over the same period. Sequences of the VOC were widely distributed across 199 lower tier local authorities (LTLAs) in England, but highly concentrated in the South East (n=875), London (n=636) and East of England (n=293). Relative to this genetic background, the growth of the VOC lineage is consistent with it having a selective advantage over circulating SARS-CoV-2 variants in England (Figure 1A). While rapid growth of the variant was first observed in the South East, similar growth patterns are observed later in London, East of England, and now more generally across England. Across these regions, we estimate similar growth differences between the VOC and non-VOC lineages of +49% to 53% per generation (Supporting Table S1) by fitting a logistic growth model to the frequency of VOC sequence samples through time and adjusting for an approximate mean generation time of SARS-CoV-2 of 6.5 days (see Supporting Methods) 8,9.
S gene target failure in SARS-CoV-2 testing as a biomarker for the VOC
The UK has a high throughput national testing system for community cases, based in a small number of large laboratories. We were able to extend our genomic analyses to epidemiologic case data, because the VOC lineage is not detected in the S-gene target in an otherwise positive PCR test (ThermoFisher TaqPath as performed in the UK national testing system). Several SARS-CoV-2 variants can result in SGTF, but since mid-November, more than 97% of Pillar 2 PCR tests showing SGTF are due to the VOC lineage10. Before mid-November 2020, the frequency of SGTF among PCR positives was a poorer proxy for frequency of the VOC. We therefore developed a Gaussian Markov Random Field model (see Supplementary Information, Figure S1) to predict the proportion of SGTF cases attributable to the VOC lineage by area and week, here termed the true positive rate (TPR), and the number of SGTF cases attributable to the VOC. In turn, the corresponding false-positives were attributed to the S-gene positive case (S+) category.
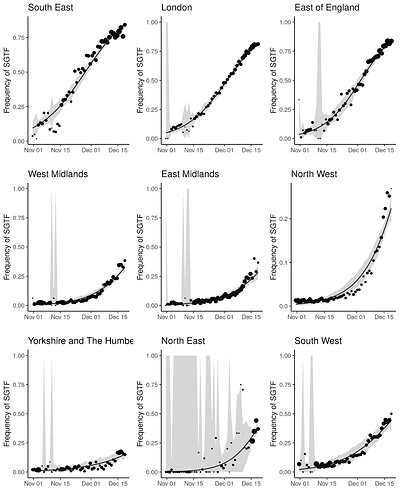
Figure 1 | Expansion and growth of the VOC 202012/01 lineage. A) The number of UK LTLAs reporting at least one sampled VOC genome. B) Empirical (solid) and estimated (dash) frequency of TPR-adjusted SGTF in three regions of England. C) Empirical (points) and estimated (line) frequency (log odds) of VOC inferred from genomic data by epidemiological week. D) Empirical (points) and estimated (line) frequency (log odds) of SGTF based on the same data as B.
Trends in SARS-CoV-2 cases with S gene target failure that are attributed to the VOC
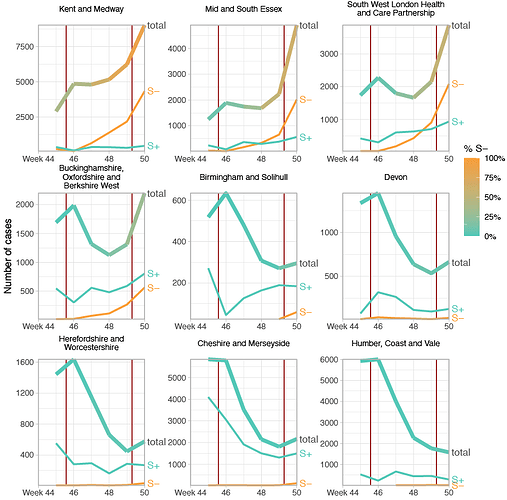
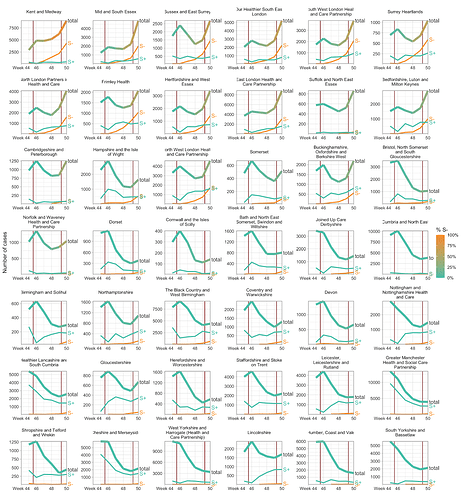
SGTF data were available for 35% of Pillar 2 positive test results between November 26 to December 13, 2020. Given the greater abundance of SGTF data, a more detailed picture of the VOC frequency over time can be discerned after our TPR adjustments. Overall, empirical and estimated frequencies of TPR-adjusted SGTF cases show a similar pattern of expansion as frequencies estimated from genetic data in terms of time, region, and rate of growth (Figure 1D). As of December 13, SGTF is detected in all regions of England (Figure S2), and the estimated frequency of TPR-adjusted SGTF ranges from 15% in Yorkshire and the Humber to 85% in the South East, where the VOC was first detected. Changes in COVID-19 infections correlate with raw (not adjusted for TPR) SGTF cases on a regional basis. Figures 2 and S3 shows the time trends of SGTF (S-) cases, S-gene positive cases (S+) and total PCR positive cases by NHS England Sustainability and Transformation Plan (STP) areas (a geographic subdivision of NHS Regions). Visually, it is clear that while lockdown successfully controlled S+ cases in virtually every STP, S- case numbers increased during lockdown.
Figure 2 | Case trends in a subset of NHS STP areas. Total cases reported are shown as a thick line. A subset of these - those tested in the 3 largest “Lighthouse” laboratories - were tested for SGTF. The total cases line is coloured according to percentage S- among those tested. Counts of S+ and S- reported via the PHE SGSS system are shown by the thin lines. The dates of the second lockdown are indicated by the vertical red lines. Nine representative NHS STP areas from all regions of England are ordered by decreasing percentage S- in the most recent week of data. Raw SGTF data are shown here (not adjusted for TPR), so S- cases in earlier weeks include other non-VOC lineages, especially outside the East and South East of England. Plots for all STP areas are shown in Figure S3.
Transmission advantage of the VOC
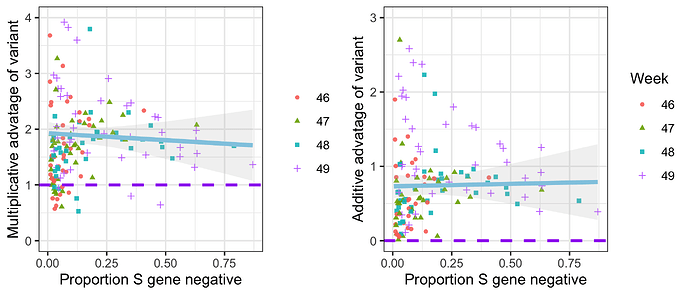
To examine the differences between S- and S+ growth rates, we focus on epidemiological weeks 46-50 (8th November-12th December). We estimate the total S- and S+ in each STP and week by adjusting counts upwards in proportion to total cases reported in each STP and week. We then calculate the week on week growth factor in both S- and S+ cases by dividing the case numbers in week t+1 by the case numbers in week t. Given an assumed mean generation time of SARS-CoV-2 of 6.5 days9, we correct these weekly growth factors by raising them to the power of 6.57to ensure they can be interpreted as approximate reproduction numbers. For each STP and week, we compute both the ratio and difference of the resulting empirical reproduction number of the S-negative cases to that of the S-positive cases (Figure 3). Overall, the median multiplicative advantage is 1.74 for the VOC, and the median additive advantage is 0.63, showing a clear advantage of the VOC for both metrics.
Figure 3 | Empirical data analysis of the advantage in weekly growth factors (cases in week t+1 divided by cases in week t) for the VOC versus non-VOC lineages. Each point represents either the ratio (left) or difference (right) of weekly growth factors for the VOC versus non-variant for an NHS England STP area and week, using the raw SGTF data shown in Figure S1 (not correcting for TPR). Colours and shapes differentiate epi weeks. Numbers above 1 on the top plot and above 0 on the bottom plot show a transmission advantage. The blue line represents the mean advantage for a particular proportion of VOC among all cases, and the grey lines the 95% envelope. Scatter at low frequencies largely reflects statistical noise due to low counts.
Paired growth rate trends of the VOC and non-VOC lineages demonstrate an increase in the reproduction number
We next tested the hypothesis that the higher growth rates of the VOC compared to other circulating lineages might be due solely to shorter generation times (e.g. a shorter incubation period), rather than increased transmissibility (R). To this end, we compared the number of NHS STP areas in which both VOC and non-VOC cases increased or decreased (Table 1). If the VOC had the same reproduction number as non-VOC but a shorter generation time, VOC cases are expected to grow faster than non-VOC cases in areas where non-VOC grew. However VOC cases are expected to decline faster than non-VOC cases where non-VOC declined. Furthermore, areas where VOC grew but non-VOC declined would, on average, be equally balanced by areas where the opposite was true. That is, if only the generation interval of the VOC had shortened , the proportion of areas with positive growth of the VOC and negative growth of the non-VOC would be highly correlated with the proportion of areas with negative growth of the VOC and positive growth of the non-VOC. However, of 168 STP-weeks (42 STP areas, weekly growth factors for weeks 46-49) there were 97 STP-weeks where growth was observed in S- and decline was observed in S+, but only 1 STP-week where the opposite was true (Table 1), indicating strong evidence against S+ and S- reproduction numbers being equal (McNemar’s Chi-square test with continuity correction test statistic 92.02, p < 1e-15). Comparing the empirical distribution of growth factors from S+ and S- with the nonparametric Kolmogorov–Smirnov test results in rejecting the null hypothesis (p < 1e-15) that the two arise from the same probability distribution.
| VOC>1 | VOC1 | |
|---|---|---|
| non-VOC>1 | 34 | 1 |
| non-VOC1 | 97 | 36 |
Table 1 | Contingency table of VOC and non-VOC weekly growth factors derived from raw SGTF data within 42 NHS STP areas for weeks 46-49, stratified by increasing (>1) and declining incidence(1). The imbalance in off-diagonal elements gives strong evidence of increased transmissibility, even if the VOC had an altered generation time distribution.
Share of age groups among VOC and non-VOC cases
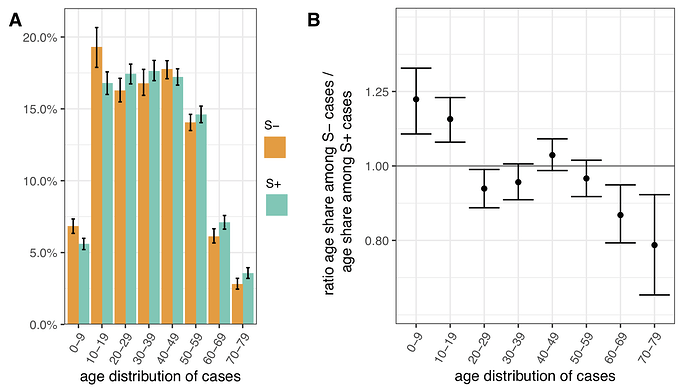
To assess differences in the age distribution of VOC versus non-VOC cases, we considered S- and S+ case numbers in weeks 46-51 across NHS STP regions. Case numbers were standardised for differences in the population age composition in each area, weighted to compare S- cases from each NHS STP region and each epidemiological week with an equal number of S+ cases from that same STP and week (a case-control design), and aggregated over STP weeks. Accounting for binomial sampling variation and variation by area and week, we observe significantly more S- cases, our biomarker of VOC cases, among individuals aged 0-19 as compared to S+ cases, and significantly fewer S- cases among individuals aged 60-79 (Figure 4). This trend is seen in each of the regions of England most affected by the VOC thus far (East of England, London, South East and Midlands), and similar differences are seen between the raw (non-case control weighted, and non-age-standardised) age distributions of S+ and S- cases.
Figure 4 | Age distribution of S-gene negative (S-) and S-gene positive (S+) PCR-positive pillar 2 cases from the SGSS dataset (not adjusted for TPR). Case numbers are weighted to compare S- cases from each NHS STP region and epidemiological week with an equal number of S+ cases from that STP and week (a case-control design), and standardised for differences in the age composition of each STP area. (A) Age distribution of S- and S+ cases. (B) Ratio of S- to S+ proportions of cases in each 10 year band. Results shown are for weeks 46-51. Ages were capped at 80. 95% empirical confidence intervals calculated by bootstrapping over STP areas and weeks, and sampling variation within STP areas and weeks.
Regression analysis of VOC transmissibility
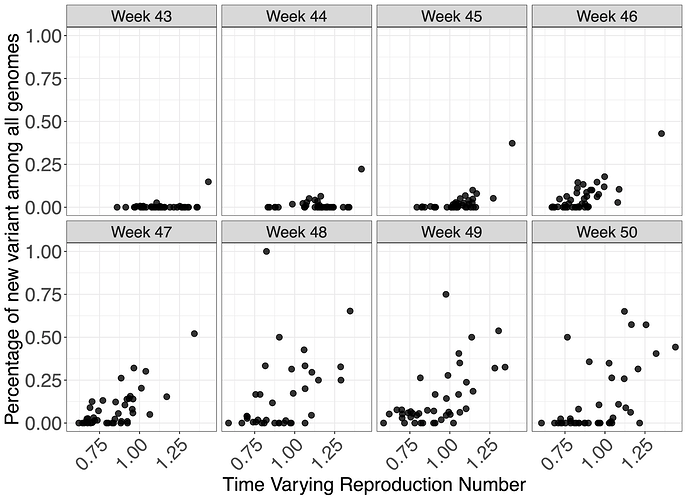
To investigate the effect of VOC frequency on the overall time-varying reproduction number, Rt, we undertook a number of regression analyses. We conduct our analyses at two different spatial scales - lower tier local authority (LTLA) and NHS STP areas. For each, we estimated Rt by week and area using data on pillar 2 testing, deaths and hospitalisations using a previously described model9,11. Figure 5 shows the empirical relationship between weekly estimates of Rt at STP level and the frequency of the VOC estimates using genomic data.
Figure 5 | Relationship between genomic frequency of the VOC lineage among all genomes plotted against the time varying reproduction number for each week. Each datapoint is an STP area.
We apply a range of frequentist models with a bootstrapping procedure to account for non-normality in responses, as well as a Bayesian regression which explicitly models VOC frequency, such that it simultaneously informs the parameter for binomially-distributed observations of frequency and the Rt estimates. The role of geography in explaining variance of Rt was examined using both fixed and random effects. These models were applied to both genomic-based frequency estimates and TPR-adjusted SGTF proportions of pillar 2 cases for which S-gene data was available. Given this definition and the approximately 1 week generation time of SARS-CoV-2, we expect Rt to have stronger association with VOC frequency 1 week earlier. We therefore present regressions of Rt against frequency at week t-1 for our default analysis (where t spans weeks 44-50), and a regression of Rt against frequency at week t is provided in the Supplementary Information.
Regression results are reported in Table 2 (Table S2 for sensitivity analysis). We estimate the additive effect on Rt, i.e., the increase or decrease in Rt (using Rt as response in the linear model) due to the variant. As an example, with an additive effect size of 0.4, an area with an Rt of 0.8 without the VOC would have an Rt of 1.2 if only the VOC was present. As expected, models which allow for fixed effects of week and region give lower effect sizes for the VOC than random effect models, given the latter constrain week and time effects more than fixed effect models, due to the assumptions that such effects arise from normal distributions. The Bayesian model results closely resemble those from the frequentist random effects model.
The results in Table 2 show a clear association between the VOC and Rt. However, this analysis cannot prove causality. The estimated additive effect is specific to the conditions that prevailed in England during the time period examined.
| Model | Spatial Resolution | Data for Variants | Estimated effect [95% CI] |
|---|---|---|---|
| Fixed | STP | Genomic | 0.48 [0.31, 0.85] |
| Random | STP | Genomic | 0.67 [0.52, 1.11] |
| Bayes | STP | Genomic | 0.68 [0.44, 0.93] |
| Fixed | LTLA | TPR-adjusted SGTF | 0.42 [0.33, 0.58] |
| Random | LTLA | TPR-adjusted SGTF | 0.52 [0.45, 0.69] |
| Fixed | STP | TPR-adjusted SGTF | 0.36 [0.11, 0.58] |
| Random | STP | TPR-adjusted SGTF | 0.47 [0.25, 0.70] |
| Bayes | STP | TPR-adjusted SGTF | 0.48 [0.31, 0.63] |
Table 2 | Estimated additive change of reproduction numbers of VOC compared with other variants for different regression models, spatial resolutions, and data used to estimate the prevalence of the VOC. Analysis uses Rt estimates from weeks 44-50 and data on the proportion of the VOC one week earlier, to take account of the generation time of SARS-CoV-2.
Estimating reproduction numbers for VOC and non-VOC independently
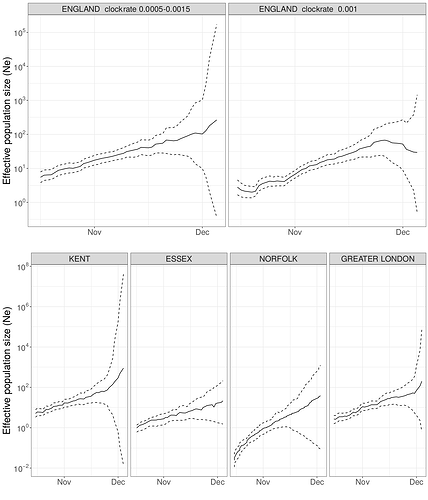
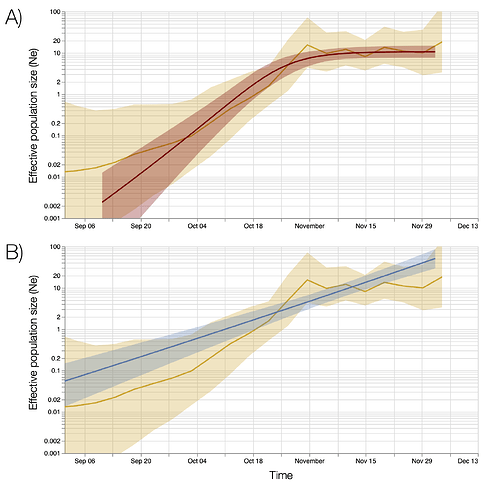
We estimated the reproduction number of the VOC via phylodynamic analysis of whole genome sequences from Pillar 2 national SARS-CoV-2 testing, sampled up to December 6, 2020. First, we fitted a non-parametric skygrowth model 12 by maximum likelihood to 776 genomes that we selected from England in inverse proportion to the number of diagnosed cases sequenced in each region by week (see Supporting Methods). This model indicates that the effective population size of VOC 202012/01 grew at a relatively stable rate of 58% per week from September 20 to December 6, corresponding to a reproduction number of 1.59. Estimates of growth rate were insensitive to uncertainty in the molecular clock rate of evolution. Second, we fitted the model to genomes from four regions with more than fifty sequences, Kent (n=701), Greater London (n=606), Essex (n=131), and Norfolk (n=81). This regional analysis indicated growth rates ranging from 58% to 92% per week, corresponding to reproduction numbers between 1.56 and 1.95 (Figure S6). Finally, we carried out a Bayesian non-parametric coalescent analysis using the Skygrid model13 using the same set of 776 genomes. This analysis showed growth until the start of November followed by a plateau for the month of November coincident with the second English lockdown (Figure S7). This suggests the lockdown constrained growth of the VOC, but was insufficient to cause a reduction in incidence. To estimate parameter values we also estimated the initial growth rate of the VOC lineage under a parametric logistic growth coalescent model14. Under this model we estimated a growth rate of 71.5 per year, corresponding to a doubling time of 3.7 days (95% CrI: 2.4 – 4.9) and a reproduction number of 2.27 (1.84 – 2.73). By comparison, a simple exponential growth model over this entire period yields a growth rate of 27.9 with a doubling time of 9.1 days (7.4, 11.2) and reproductive number of 1.50 (1.40 – 1.60).
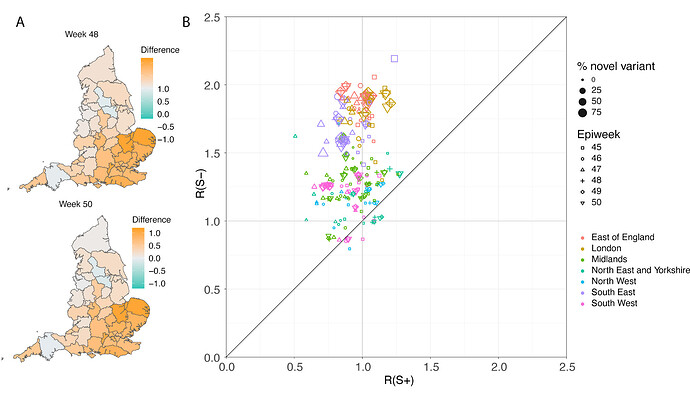
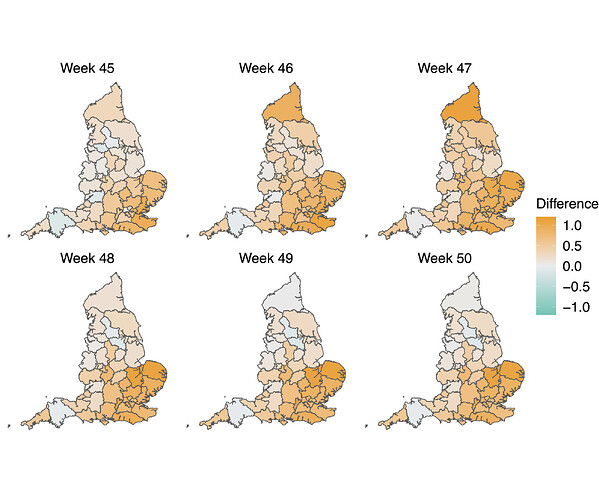
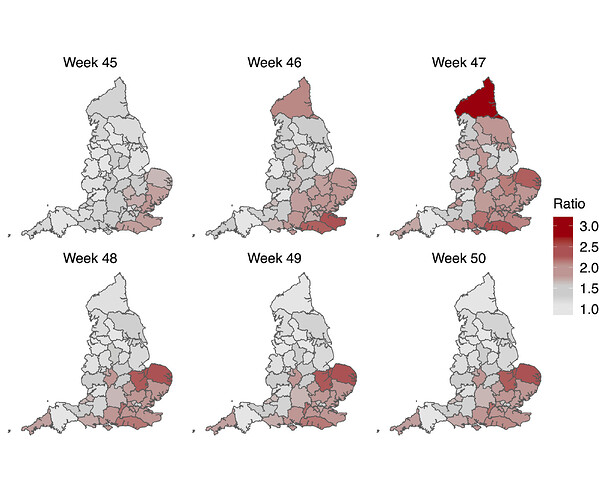
In a parallel epidemiological analysis, we estimated VOC and non-VOC pillar 2 case numbers by STP area using TPR-corrected SGTF frequencies applied to overall PHE pillar 2 case numbers. We then estimate Rt by week separately for VOC and non-VOC, using the same model previously used to generate overall (non lineage-stratified) Rt estimates11. We first fit the unstratified model to estimate the infection ascertainment ratio (numbers of infections being identified as positive cases) and infection seeding (initial infections in each region). For seeding, we use the estimated infections from our unstratified model. The mean number of daily infections for week 42 and 43 are used for seeding both VOC and non-VOC models. The fraction of SGTF cases is used to distribute infections for seeding between VOC and non-VOC in weeks 42 and 43. We then compute Rt estimates for weeks 45-50, to avoid the seeding assumptions affecting Rt estimates. Figure 6A shows the mean posterior difference between Rt estimates for VOC and non-VOC for week 48 and 50, while figure 6B shows plots median Rt estimates for VOC and non-VOC across all NHS regions for weeks 45-50. The Rt estimates for VOC are greater than those for non-VOC for 94% of STP-week pairs (points above the diagonal in Figure 6B). Figure S4 shows the mean posterior difference between Rt estimates for VOC and non-VOC for all weeks 45-50, while Figure S5 shows the ratio of Rt estimates. The mean Rt difference across weeks 45-50 is 0.51 [95% CrI: -0.09 - 1.10] which was computed from the set of 42x6 (STP x week) posteriors of Rt estimated for the VOC and non-VOC. The mean ratio of the estimated Rt for the VOC and non-VOC was 1.56 [95%CI: 0.92 - 2.28] for the same period, see Figure S5. Aggregating across all STPs we find that the mean Rt during the second English lockdown across all STPs was 1.45 [0.91-1.89] for the VOC and 0.92 [0.86-1.06] for non-VOC strains.
Figure 6 | (A) Map of the difference in median Rt estimates for VOC and non-VOC variants for all STPs for weeks 48 and week 50. (B) Scatterplot of the reproduction numbers of VOC (S-) and non-VOC (S+) by STP and week. Point size indicates frequency of the VOC, while shape and colour signify week and NHS region, respectively.
Discussion
While evidence has accumulated that substitutions associated with the B.1.1.7 lineage are associated with significant changes in virus phenotype2–4,15, assessing the extent to which these changes lead to meaningful differences in transmission between humans is challenging and cannot be evaluated experimentally. When randomised experimental studies are not possible, observational studies provide stronger evidence if consistent patterns are seen in multiple locations and at multiple times. While rapidly increasing frequency of a new lineage within a viral population is consistent with a selective advantage, it is also possible that increases in frequency may be caused by founder effects or genetic drift, especially for genetic variants which are repeatedly introduced from overseas16,17. But in contrast to previous genetic variants which have achieved high prevalence, we see expansion of the VOC from within the United Kingdom and a pattern of faster epidemic growth in tandem with expansion of the VOC has been repeated in multiple regions. In this paper we have focussed on spatiotemporally stratified analyses using a variety of statistical approaches to evaluate the relationship between SARS-CoV-2 transmission intensity and the frequency of the VOC, B.1.1.7 during November-December 2020 in different UK regions.
Assessment of the transmission characteristics of the VOC (B.1.1.7) was aided by the high correlation between its frequency and the occurrence of S-gene target failure (SGTF) in routine PCR testing of community cases of COVID-19 associated with the Δ69-70 deletion present in the VOC lineage (Figure 1 and S1). S-gene positivity results were available for over a third of all PCR-positive community COVID-19 cases for November and December 2020, allowing us to use SGTF frequency as a proxy for VOC frequency, and thus estimate VOC and non-VOC incidence trends by region over that time period. We see a very clear visual association between SGTF frequency and epidemic growth in nearly all areas (Figures 2 and S3), which is reinforced by empirical assessment of area-specific week on week growth factors of VOC and non-VOC case numbers (Figure 3) and by formal regression analyses of the association between estimates of local Rt and VOC frequency estimated from SGTF data (Table 2). Finally, we used the SGTF data to independently estimate Rt by region and week for the VOC and non-VOC variants (Figures 6 and S4) and derived similar estimates for the increase in Rt associated with the VOC. This latter analysis is perhaps the most powerful, as no parametric assumptions are made about the relationship between Rt of the VOC and that of non-VOC strains.
Phylodynamic modelling provides information about rapid growth of the VOC in October during a period when SGTF data is sparse. Although not apparent in all analyses, this suggests that the VOC expanded rapidly in October, but transmission was substantially suppressed during national lockdown in November (Figures S6 and S7).
We were also able to rule out the hypothesis that increased incidence growth rates in the VOC are solely due to a change in the latent period or generation time distribution, but not the reproduction number itself (Table 1), since we see a large and statistically significant imbalance between regions where the VOC increased and where the non-VOC decreased, and vice-versa. A change solely in, for instance, the latent period would not be expected to change the direction of incidence growth.
We have quantified the transmission advantage of the VOC relative to non-VOC lineages in two ways: as an additive increase in R that ranged between 0.4 and 0.7, and alternatively as a multiplicative increase in R that ranged between a 50% and 75% advantage. We were not able to distinguish between the additive or multiplicative advantage models in goodness-of-fit, and either is plausible mechanistically. A multiplicative transmission advantage would be expected if transmissibility had increased in all settings and individuals, while an additive advantage might reflect increases in transmissibility in specific subpopulations or contexts. More generally, the temporal context is important; these estimates of transmission advantage apply to a period where high levels of social distancing were in place in England; extrapolation to other transmission contexts, without detailed knowledge of the drivers of transmission, requires caution.
We observe a small but statistically significant shift towards under 20s being more affected by the VOC than non-VOC variants (Figure 4), even after controlling for variation by week and region. However, as with our earlier results, this observation does not resolve the mechanism that might underlie these differences. Differences between the age-distributions of VOC and non-VOC community cases may result from the overall increase in transmissibility of the VOC (especially during a time where lockdown was in force but schools were open), increased susceptibility of under 20s, or more apparent symptoms (and thus a propensity to seek testing) for the VOC in that age range.
There are a number of limitations to our analysis. The genomic and epidemiological data analysed was collected as part of routine surveillance, and thus may not be an entirely representative sample of SARS-CoV-2 infections in England over the time period considered. We also focussed on relatively simple, data-driven analyses using parsimonious models making parsimonious assumptions, rather than, for instance, attempting to model the long-term transmission dynamics of VOC and non-VOC lineages more mechanistically. We also did not attempt to explicitly model the spatiotemporal correlation intrinsic in infectious disease data, especially when considering the spread of a new variant from a point source. Doing so is an important priority for future work, but will require explicit incorporation of data on population movement patterns.
Early versions of our analyses informed the UK government policy response to this VOC and that of other countries. The substantial transmission advantage we have estimated the VOC to have over prior viral lineages poses major challenges for ongoing control of COVID-19 in the UK and elsewhere in the coming months. Social distancing measures will need to be more stringent than they would have otherwise. A particular concern is whether it will be possible to maintain control over transmission while allowing schools to reopen in January 2021. These policy questions will be informed by the ongoing urgent epidemiological investigation into this variant, most notably examining evidence for any changes in severity, but also giving more nuanced understanding into transmissibility changes, for instance in the household setting.
