Time dependence of SARS-CoV-2 substitution rates
Mahan Ghafari, Louis du Plessis, Oliver Pybus and Aris Katzourakis
Department of Zoology, University of Oxford, Oxford, UK.
Here we provide a preliminary analysis on the inferred substitution rate of SARS-CoV-2 using the publicly available genome sequences from GISAID. Using increasingly longer time windows (from late December to early August), we show that the substitution rate drops by almost a factor of two (from 1.66E-3 in February to 8.99E-4 in early August). Our result shows that inferred rates can significantly vary over time before they converge to their long-term estimates.
Methods
We use a total of 440 publicly available nCoV genomes collected between 24 Dec, 2019 and 10 Aug, 2020 which we randomly sample from sequences all over the world. We only include complete sequences (>29 Kbps) and omit those with low coverage (entries with >5% Ns) from the analysis (GISAID’s default options). We follow Andrew Rambaut’s earlier analysis on Virological and use the BEAST v1.10.4 to infer evolutionary dynamics. We analyse each dataset using the HKY+G substitution model and set a Markov Chain Monte Carlo (MCMC) of 50M steps (sampling every 50K steps and removing the first 10% as burnin). We ensure sufficient sampling of key parameters by verifying that their effective sample size is at least 200 using Tracer v1.7. We use a strict molecular clock (CTMC rate reference prior) with exponential growth rate (Laplace prior with scale 100) and a Lognormal prior on population size (with mean=1 and SD=2).
Phylogenetic analysis
To ensure that there are sufficient molecular evolutionary changes to reliably infer the phylogenetic parameters, we initially take 120 random samples from 24 Dec 2019 to 29 Feb 2020 to estimate the substitution rate. We then incrementally increase the sample size by adding 20 more random samples for every 10 additional days since 29 Feb. Therefore, by the time we reach the final time window for the analysis, i.e. 10 Aug 2020, we have 440 samples (see Fig. 1a). Our results show that the inferred substitution rate steadily declines from February to August (see Fig. 1b). However, unlike the time-dependent substitution rate of the 2009 flu pandemic which declined by almost a factor of 4 over a timespan of 4-5 months and then effectively plateaued, here we see a rate drop by a factor of only 2 over the same timespan of observation (see Fig. 2) and no clear signal of convergence to long-term expected substitution rates. We compare the fit of an exponential model with an asymptote on the pattern of rate decay and find that while for the flu data the rate has reached the asymptote after 5 months, this has not yet occurred for the SARS-CoV-2 data. We note that a similar time-dependent rate drop was also observed during the EBOV outbreak from 2013 to 2016 where the early estimates of substitution rates (~1.9E-3 nucleotide substitution per site per year) were twice as high as those averaged across multiple outbreaks (~0.9E-3).
In Fig. 3, we compare the fit of two analytical expressions (two exponential functions, one with and the other without an asymptote) on the pattern of rate decay and find that they both fit the data reasonably well (although Bayesian model comparison would imply that the model with fewer parameters, i.e. blue line in Fig. 3, is preferred).
More on this to follow over the next few weeks – additional analysis on dN/dS will also be added here.
(We note that we did not remove epidemiologically-linked clusters of samples as this proves incredibly challenging to identify all those cases.)
FIgures
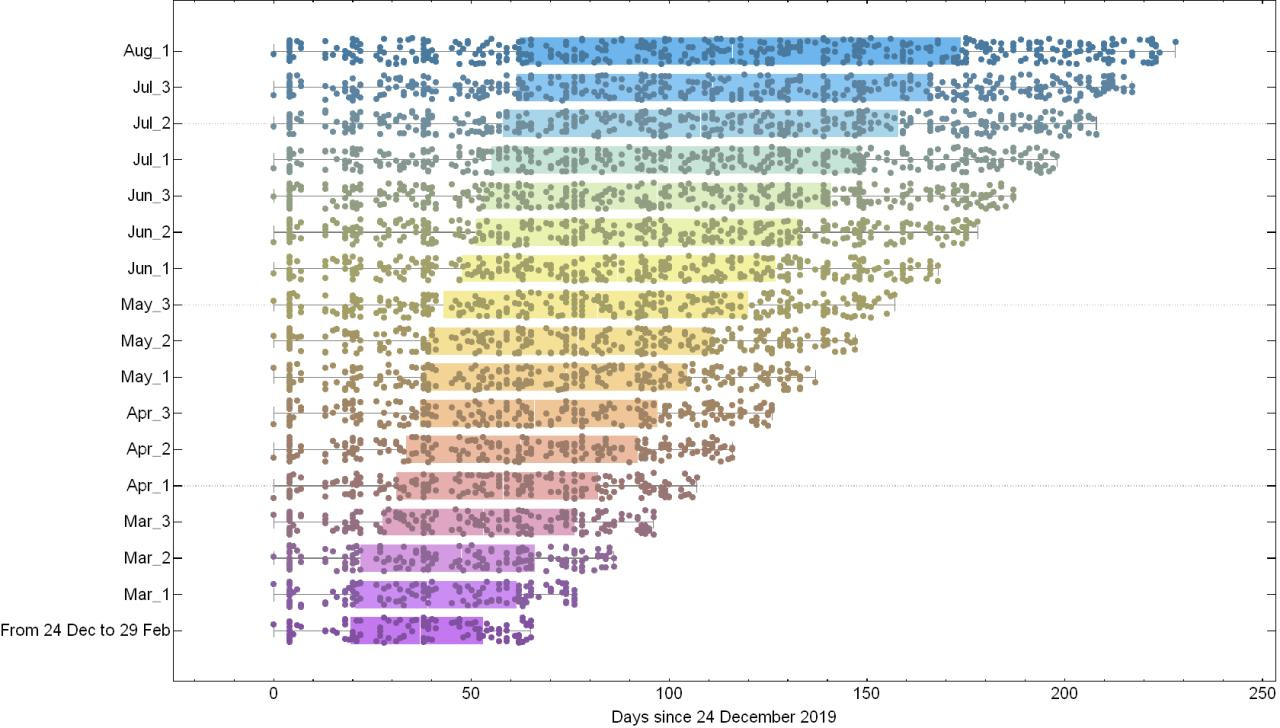
(a)
(b)
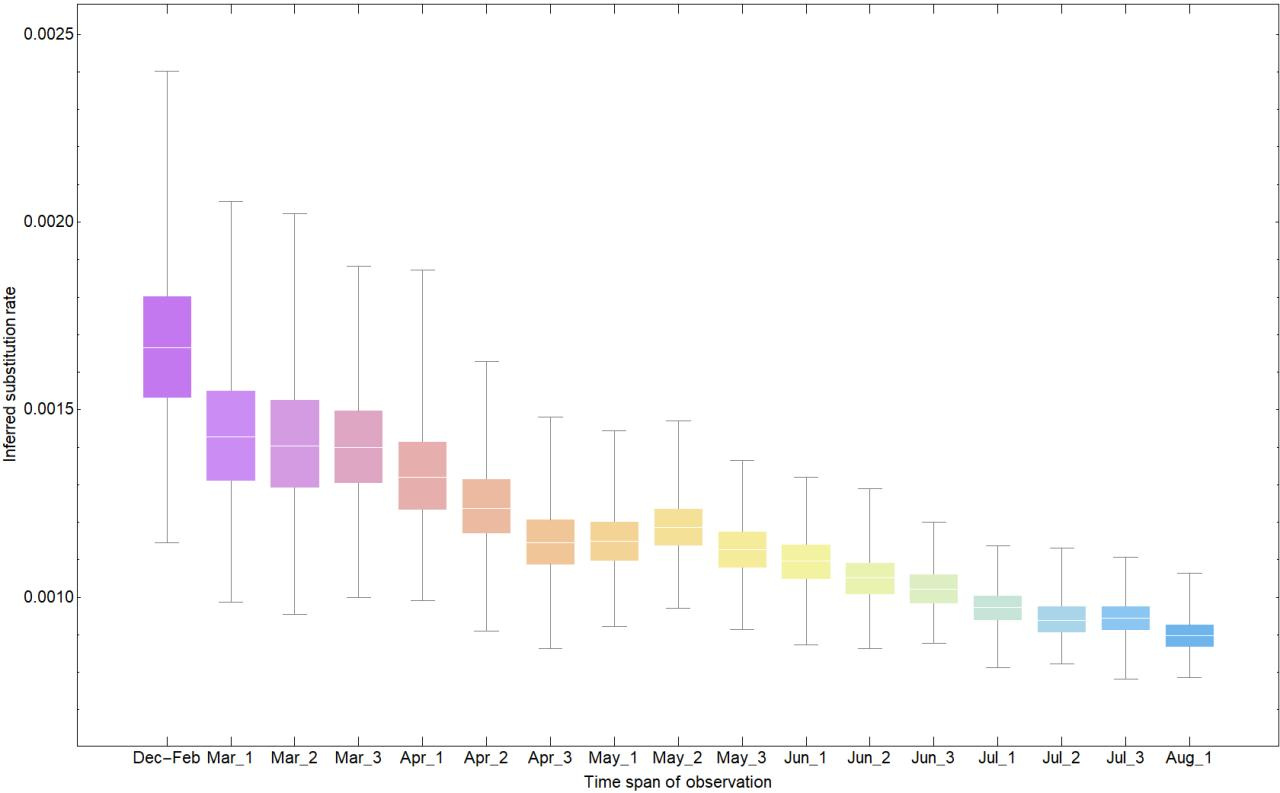
Fig. 1: (a) Shows the sampling intervals corresponding to every measurement of substitution rate. Dots represents the collection date of sampled genomes and (Month)_(number) corresponds to one of the three 10-day time intervals (number = 1,2,3) of each month during which period 20 samples are randomly added to the dataset. (b) Shows the corresponding substitution rate measured for each time interval. Colours in (a) and (b) are matched according to their corresponding time span of measurement.
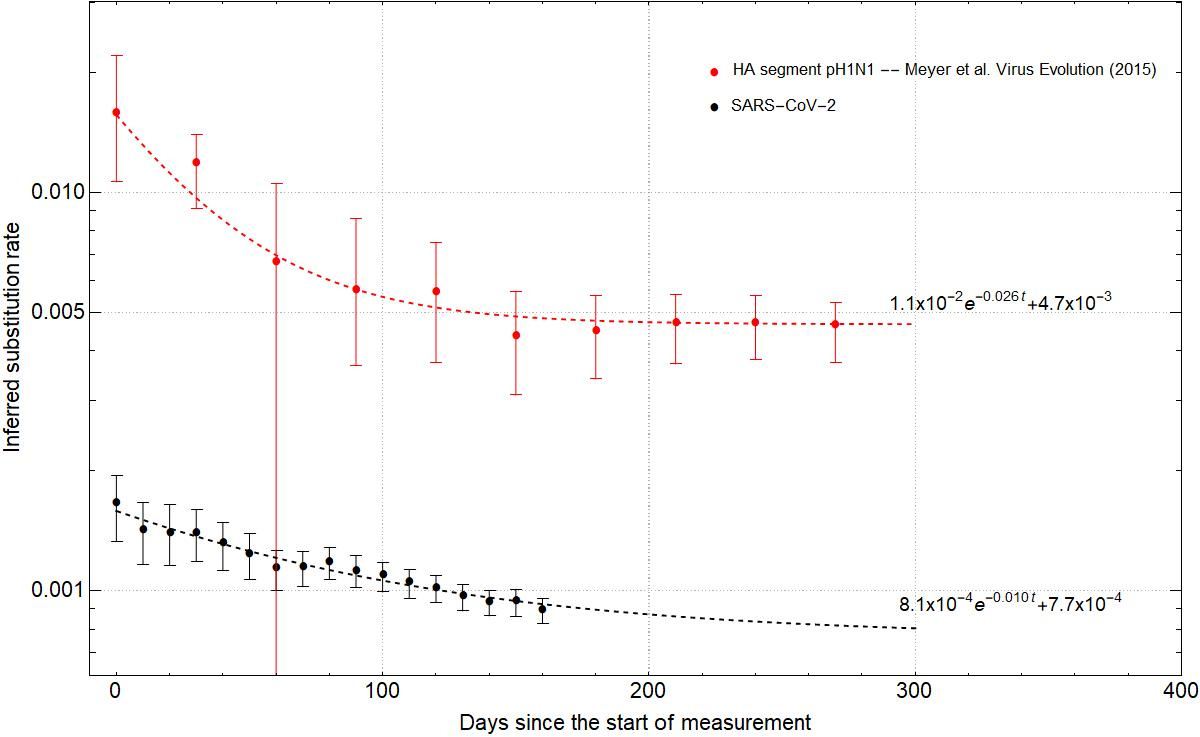
Fig. 2: Fitting the time dependent rate decay curves for pH1N1 flu (red) and SARS-CoV-2 (black). The analytical fit is of the form $ke^{-\alpha t}+\beta$ where $k$ corresponds to the instantaneous rate, $1/\alpha$ is the half-life of rate decay, and $\beta$ is the asymptote of the curve. Dots represent the median and error bars the 95% HPD.
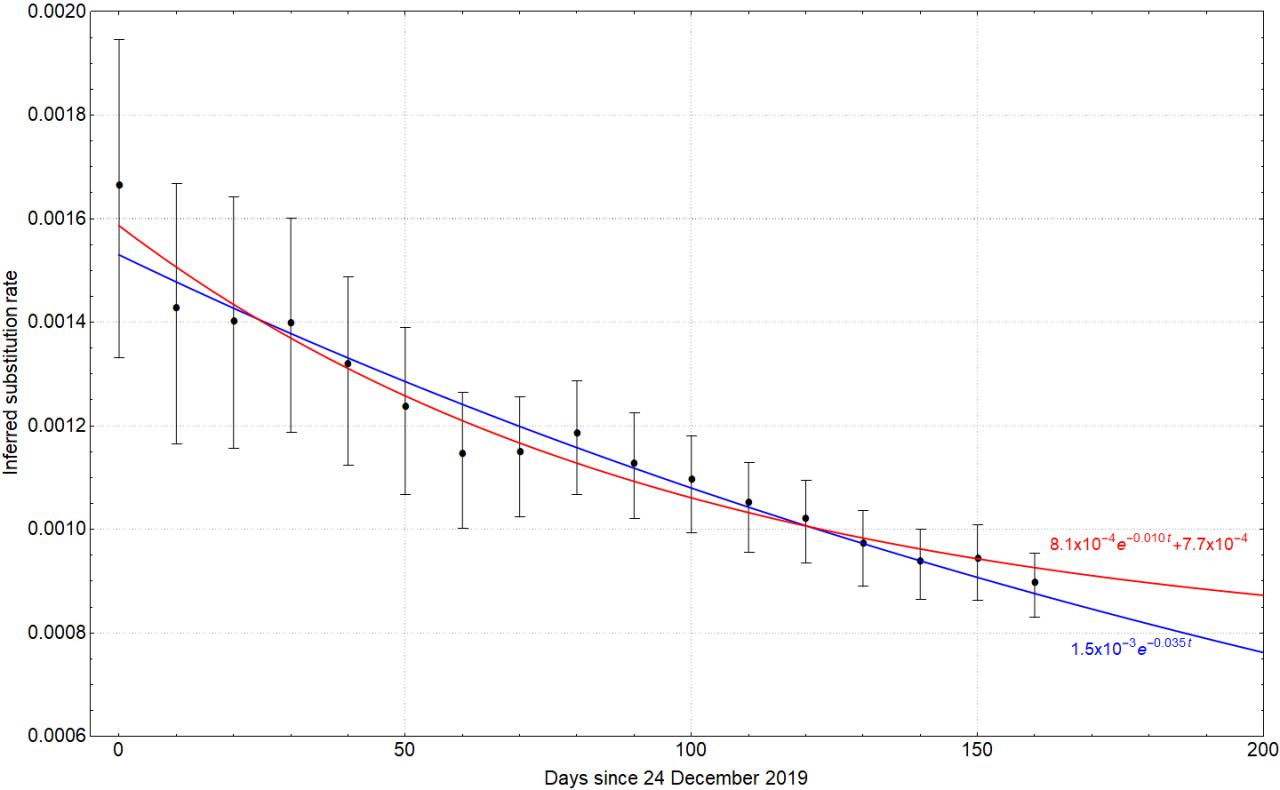
Fig. 3: Fitting the time dependent rate decay with two different analytical forms, i.e. $ke^{-\alpha t}+\beta$ (red line) and $k’e^{-\alpha’ t}$ (blue line). Dots represent the median and error bars the 95% HPD.
Acknowledgement
We gratefully acknowledge the Authors, Originating and Submitting laboratories of the genetic sequence and metadata made available through GISAID on which this research is based.