Hongru Wang, Sergei L Kosakovsky Pond, Anton Nekrutenko, and Rasmus Nielsen
Live version of this document is at Testing recombination in the pandemic SARS-CoV-2 strains / Sergei Pond | Observable
To test whether there is recombination among the current pandemic SARS-CoV-2 strains, we look for linkage disequilibrium (LD) decay signal which is a hallmark of recombination. Over time recombination, when present, will disrupt linkage between SNPs, and this will happen faster for more distant SNPs.
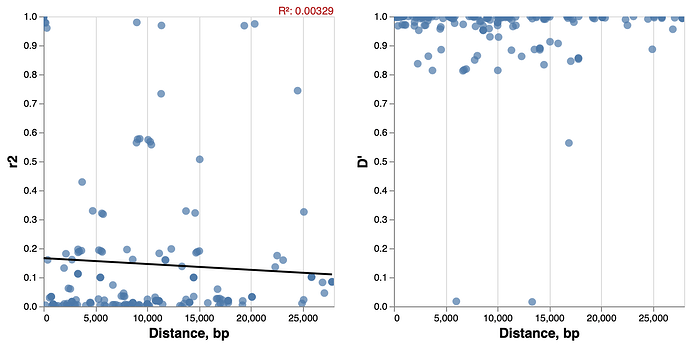
We collect full-length SARS-CoV-2 genomic sequences from ![]() and remove all genomes that contain more missing bases (N) per gene/peptide than a fixed threshold. For this analysis we retained 14058 whole length sequences. We performed codon alignment of all the genes on the virus genome except for several short regions that are not in functonal ORFs. We then called SNPs based on alignments. At minimim frequency of 0.03 , there are 19 SNPs. We next calculate the linkage disequilibrium (both r2 and D’) between all pairs of SNPs. Plotting the pairwise linkage disequilibrium versus the distance ( Figure 1 ), we do not observe a clear pattern of LD decay. A linear regression analysis to test if there is a negative relationship between linkage disequilibrium (r2) and distance between the SNPs, yields a regression coefficient of -0.00000202 and the proportion of variance explained (R2, distinct from r2) of 0.00329 .
and remove all genomes that contain more missing bases (N) per gene/peptide than a fixed threshold. For this analysis we retained 14058 whole length sequences. We performed codon alignment of all the genes on the virus genome except for several short regions that are not in functonal ORFs. We then called SNPs based on alignments. At minimim frequency of 0.03 , there are 19 SNPs. We next calculate the linkage disequilibrium (both r2 and D’) between all pairs of SNPs. Plotting the pairwise linkage disequilibrium versus the distance ( Figure 1 ), we do not observe a clear pattern of LD decay. A linear regression analysis to test if there is a negative relationship between linkage disequilibrium (r2) and distance between the SNPs, yields a regression coefficient of -0.00000202 and the proportion of variance explained (R2, distinct from r2) of 0.00329 .
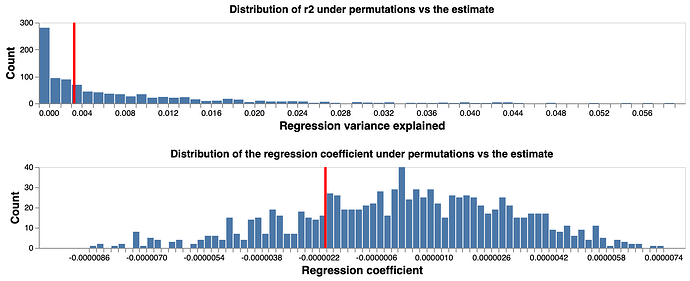
To test if the fitted coefficient and R2 represent a significant finding, we perform bootstrap tests: we randomly shuffl the coordinates of SNPs 1000 times, and then carry out the same regression test for each shuffling. We construct null distribution of fitted coefficient and R2 based on the 1000 replicates. Comparing the fitted values with the null distribution (Figure 2), we conclude that there is no evidence of correlation between distance and LD for the pairwise comparison of SNPs across the 14058 virus genome, thus there is evidence of no recombination in the current pandemic virus genomes.
Figure 1 Linkage disequlibirum decay patterns
Figure 2 Fitted regression coefficient and R2 compared to random coordinate permutations

