Reproduction number of the 2026 Bundibugyo virus disease outbreak over time: phylodynamic estimates from genomes collected up to 6 September 2026
Summary
-
Using the phylodynamic program Delphy, we estimated the reproduction number of the 2026 Bundibugyo virus disease (BVD) outbreak over time from 680 Bundibugyo virus (BDBV) genomes collected from 2 May to 6 September 2026, 88 % of them from seven health zones, including Bunia and Rwampara, of Ituri Province. We refer to this as the “primary analysis”; unless otherwise noted, all results in this post are based on it (additional comparative analyses are described below).
-
Before the outbreak was declared (1 March – 15 May 2026), the effective population size of the virus doubled every 14 days, and one case infected about two others on average: R = 1.95 (95 % highest posterior density interval, HPD, 1.59–2.32). This is similar to estimates for the 2007 BVD outbreak in Uganda [1] and the Ebola virus disease epidemic in West Africa [2]. The first genome was collected on 2 May, so this period is seen through the branching of lineages that were sampled later.
-
After the official declaration , growth slowed within a month: R = 1.17 (0.87–1.50) for 15 May – 15 June 2026, and R = 0.72 (0.59–0.86) for 15 June – 29 August 2026. The estimates fall further in August 2026. However, a fall towards the date of the last genome can arise in any analysis of this kind, and its size is not established.
-
Robustness. In 13 analyses with other BDBV genome subsets and Delphy settings, the median R before the official declaration of the outbreak lies between 1.77 and 2.11. A second phylodynamic program, BEAST X, gives nearly the same estimates as Delphy with the same model apart from one default prior setting in Delphy (BEAST X: R = 1.95, 1.18, and 0.72 for each period; Methods). The model smooths changes of the population size over time, and the primary analysis fixes the strength of this smoothing. When the strength is estimated from the genomes instead, the estimate before the official declaration is higher and less precise, 2.27 (1.57–3.07) with Delphy and 2.38 (1.55–3.50) with BEAST X, and the two later estimates are 1.07–1.09 and 0.70.
-
Scope. The estimates describe the virus population sampled in Ituri. Reported cases in Nord-Kivu rose until mid-September, and only 10 genomes are recorded there, all of which are in the analysed set of genomes. The results are preliminary.
Background
An outbreak of Bundibugyo virus disease in the Democratic Republic of the Congo (DRC) was declared on 15 May 2026 [3]. By 5 October 2026 (INSP situation report N°144), 8,665 confirmed cases had been reported in the DRC, 6,250 of them in health zones of Ituri, 1,570 in health zones of Nord-Kivu, and 404 in other provinces.
Methods
-
Claude Science. All analyses were performed with the assistance of Claude Science (Anthropic), which was used to run the phylodynamic analyses, estimate reproduction numbers, and generate figures and tables; all outputs were reviewed by the authors, and the code and parameter settings are available at GitHub - inrb-labgenpath/inrb_bdbv_claude_science · GitHub.
-
Genomes. We downloaded all 810 BDBV genomes of the 2026 outbreak from Pathoplexus on 2 October 2026 (data version 1790610472 of 28 September), used the alignment to the reference NC_014373 provided there, and masked the last 40 positions to remove sequencing artefacts at the end of the genome [3, 7]. We analysed 680 genomes (659 from the DRC, 20 from Uganda, and 1 from a patient medically evacuated from the DRC to Germany). The remaining 130 were excluded for the following reasons: 12 lacked a collection date precise to the day; 67 shared a sample identifier with another record (we kept the more complete record if the two genomes were identical and neither if they differed); 2 were restricted-use genomes whose submitters had not yet agreed to their use; and 49 of the remaining genomes did not pass quality checks of the consensus sequence. The quality checks flag two kinds of genomes: those that carry no mutation although they were collected when such genomes had become rare, and those whose mutations contradict those of related genomes. Estimates with these 49 genomes included (729 genomes in total) are shown in Figure 2. Genomes that show signs of ADAR editing were kept: where a genome carried three or more T-to-C changes (or three or more A-to-G changes) from the majority base, each within 300 nucleotides of the next, we kept the first change and masked the others (positions set to N; 51 of the 680 analysed genomes; 178 positions masked).
-
Phylodynamic model. We used Delphy 1.4.1 [8] with the HKY substitution model, a strict molecular clock, and a Skygrid coalescent prior in the piecewise-constant form of [5], which BEAST X also uses (20 parameters, intervals of 15.4 days; Delphy’s log-linear form was not used), and ran 24 chains of 1.5 × 10⁹ steps, discarding the first 30 % of each. The coalescent prior was evaluated on 8,000 cells in time instead of Delphy’s default of 400, because with the default, 18 of 24 chains had to be discarded (13 of them had reached a state with the root of the tree next to the earliest genome); with 1,000 and 16,000 cells the medians differ from those of the primary analysis by at most 0.02 (Figure 2). Under the Skygrid prior the logarithm of the population size follows a random walk from one interval to the next. In intervals with many coalescences the estimate follows the genomes almost regardless of the precision of this walk; in intervals with few, the precision determines how far the estimate can depart from its neighbours and how wide its interval is. We call this precision the smoothing. The primary analysis applies this model to the analysed genomes with the smoothing fixed at Delphy’s default (precision 4.06) rather than estimated: a priori, the population size changes by a factor of 2 or less within 30 days with a probability of 68 %. This default reflects the developers’ judgement of what gives stable inference and plausible fluctuations [8], not information from these genomes, and we have no independent basis for choosing a value for this outbreak. To examine how this decision affects the results, we also fixed the smoothing over 15 and 60 days (Figure 2) and, separately, estimated it from the genomes with both Delphy and BEAST X 10.5.0 [9] (BEAST X: Figure 1a; Results). For Delphy with the smoothing estimated, 8 of 16 chains were used; the others were excluded by criteria fixed before the analyses.
-
Periods. We report results for three periods of the outbreak (Figure 1b): P1, 1 March – 15 May (before the outbreak was declared); P2, 15 May – 15 June (early outbreak response); and P3, 15 June – 29 August (established outbreak response). The choice was not blind to the data: we had already seen analyses of a large part of these genomes, including our previous post [7]. One further split, of P3 at 1 August, was defined after we had seen estimates from those earlier analyses. We mark it as exploratory in the Results, because a boundary chosen where a change was already visible tends to overstate that change.
-
Reproduction number. For each period we first took the growth rate r of the effective population size, i.e. the change in ln Neτ between the first and last day of the period divided by its length in days (Neτ is the effective population size multiplied by the generation time of the coalescent model). We then converted r to R with R = (1 + r σ²/μ)^(μ²/σ²) [6], assuming a gamma-distributed generation time with mean μ = 15.3 days and standard deviation σ = 9.3 days. These are the values of the serial interval of Ebola virus disease in West Africa [2], used because none has been estimated for Bundibugyo virus disease, a limitation also noted in [1].
-
Comparison with BEAST X. We also analysed the data with BEAST X, once with the model of the primary analysis and once with the smoothing estimated. Each analysis was run in eight chains of 40 million states, of which the first 30 % were discarded. By default, Delphy adds to the prior a penalty on values of Neτ below one day [8]; the analyses with BEAST X have no such penalty. The priors of the evolutionary rate are those that each program sets, and they differ.
-
Analyses without recent genomes of Bunia. The primary analysis was repeated on four sets without 40 or all 58 of the Bunia genomes collected since 5 August, and on six control sets with as many recent genomes removed at random irrespective of place (six chains each; not shown in Figure 2).
Results
Before the official outbreak declaration. Between 1 March and 15 May, Neτ grew at a rate of 0.049 per day, which corresponds to a doubling time of 14 days and to R = 1.95 (1.59–2.32) (Figure 1). Under the smoothing prior of the model alone, that is, what the model would give with no genomes, R for this period lies between 0.63 and 1.49 with 95 % probability; the interval of the estimate lies above this range, so the estimate is informed by the genomes. The earliest genomes were collected on 2 May and 3 May: 62 of the 75 days of the period precede sampling, and the period is seen mainly through the branching of lineages that were sampled later.
After the official outbreak declaration. For 15 May – 15 June the estimate is R = 1.17 (0.87–1.50); growth was slower than before the official declaration with a posterior probability above 0.99. For 15 June – 29 August the estimate is 0.72 (0.59–0.86). This period does not appear to be uniform: an exploratory division gives 0.92 (0.76–1.09) for 15 June – 1 August and 0.45 (0.20–0.76) for 1 – 29 August.
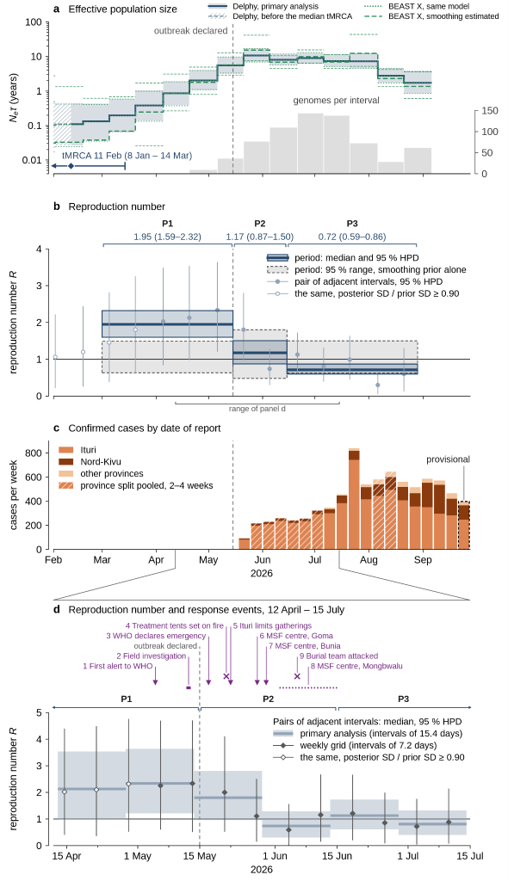
Figure 1 | Effective population size, reproduction number, and confirmed cases. a, Neτ: median and 95 % HPD interval of the primary analysis with Delphy (blue line and band; hatched: before the median Time to Most Recent Common Ancestor (tMRCA)) and of the two analyses with BEAST X (green; dotted: model of the primary analysis; dashed: smoothing estimated; thick lines: medians; thin lines: bounds of the intervals; the lower bounds of the dashed analysis in its four earliest intervals lie below the axis and are not drawn); analysed genomes per Skygrid interval (grey bars, right-hand axis). b, Reproduction number. Blue rectangles: the three periods P1 to P3 (Methods; thick line: median; height: 95 % HPD interval). Grey rectangles: 95 % range under the smoothing prior alone. Points: pairs of adjacent Skygrid intervals (median, 95 % HPD interval); open symbols: pairs with a posterior standard deviation (SD) of 0.90 or more of the prior SD, which are hardly constrained by the genomes; horizontal line: R = 1. c, Confirmed cases per week by date of report and province, from INSP situation reports N°001–138 (14 May – 29 September 2026) as transcribed in [4]; hatched: split by province pooled over several weeks. d, Reproduction number between 12 April and 15 July 2026, with the response events annotated. Bands: the six pairs of adjacent Skygrid intervals of the primary analysis in this range (points in b), each drawn over the time between the mid-points of its two intervals (thick line: median; height: 95 % HPD interval). Diamonds: pairs of adjacent intervals of the analysis with a weekly grid (32 parameters, intervals of 7.2 days; Methods; Figure 2), at the time at which the two intervals meet (median, 95 % HPD interval; open symbols and horizontal line as in b). The 95 % HPD interval of each of these 13 pairs includes R = 1, and their posterior SD is 0.78 to 0.94 of the prior SD (bands: 0.54 to 0.84), so changes from week to week are not resolved. Response events are shown at their dates: 1: first alert to WHO of a cluster of deaths in Mongbwalu Health Zone, 5 May [13]; 2: field investigation by the rapid response team in the health zones of Mongbwalu and Rwampara, 12 – 13 May [13, 14]; 3: WHO determines a public health emergency of international concern, 17 May [15]; 4: two treatment tents at Rwampara Hospital are set on fire, 21 May [14, 16]; 5: the military governor of Ituri bans funeral wakes, limits gatherings to 50 persons, and reserves burials to the response teams, 22 May [17, 18]; 6–8: MSF’s treatment centres open in Goma (first patients 28 May [19, 20]), Bunia (30 May [21]), and Mongbwalu (between 2 and 15 June [19, 21, 22]); 9: a safe and dignified burial team is attacked, 6 June [23].
Decline in August. The estimates fall further in August, but the size of this decline is not established, for three reasons. First, a fall of the effective population size towards the date of the last genome can arise in any analysis of this kind, because lineages that would be sampled only after that date are missing from the tree; the estimate for the last weeks can therefore change when later genomes are added. Second, Bunia supplies 58 of the 99 genomes collected since 5 August, and the model can read genomes that are sampled densely from one place as a small population [10, 11]. In analyses without part or all of these genomes the median for the last period is 0.67 to 0.81, against 0.72 to 0.95 in control sets with as many recent genomes removed at random, which allows no conclusion on this (Methods). Third, the estimate for 1 – 29 August is the least constrained by the genomes among the periods we examined: the posterior standard deviation of its growth rate is the largest in relation to that under the smoothing prior alone.
Robustness. In the 13 different analyses with other genome sets, last collection dates, or grid or fixed smoothing, the median R lies between 1.77 and 2.11 for P1 and between 1.07 and 1.43 for P2 (Figure 2). In the seven of them in which P3 ends on 29 August, its median R lies between 0.70 and 0.75. The 95 % HPD interval for P1 lies above 1 in every one of these analyses. A second program, BEAST X, gives nearly the same estimates with the model of the primary analysis: 1.95 (1.60–2.32), 1.18 (0.88–1.50), and 0.72 (0.59–0.85).
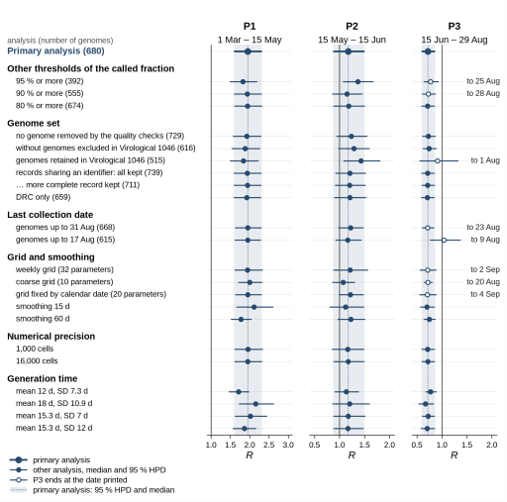
Figure 2 | Reproduction number in the three periods (P1 to P3) under other selections of genomes, settings of the model, and generation times. Symbols: posterior median; bars: 95 % HPD interval; vertical line: R = 1; band and dotted line: primary analysis (n = 680). Open symbols: the last period ends at the date printed, because the most recent genome or the Skygrid intervals differ. The brackets contain the number of genomes in each analysis. Other thresholds of the called fraction: the same analysis restricted to genomes with a base called at 95 %, 90 %, or 80 % or more of the 18,900 unmasked positions; the primary analysis sets no threshold. “Virological 1046” is our previous post [7], for which the genomes were selected by other criteria; one row shows the estimates for the genomes retained there, the other those for the analysed set of this post without the 64 of its genomes that were excluded there. Numerical precision: Delphy evaluates the coalescent prior on a division of time into cells; these rows change their number (primary analysis: 8,000). Smoothing: time within which the population size changes by a factor of 2 or less with a prior probability of 68 % (primary analysis: 30 days). Generation time: the posterior sample of the primary analysis converted with another generation time (primary analysis: mean 15.3 days, SD 9.3 days).
Smoothing fixed or estimated. When the smoothing is estimated instead of fixed, its precision is 0.72 (0.10–1.79) with Delphy and 0.64 (0.08–1.68) with BEAST X, against the fixed 4.06. On the scale used in Methods this is a change by a factor of 2 within 5.3 days (0.7–13.2) and 4.7 days (0.6–12.4) instead of 30 days, which is short against a generation time of 15.3 days. The estimate before the official declaration, a period that mostly precedes the first genome, is then higher and less precise: 2.27 (1.57–3.07) with Delphy and 2.38 (1.55–3.50) with BEAST X, with intervals 2.1 and 2.7 times as wide as that of the primary analysis. The uncertainty of this estimate probably lies between the two: the interval with the fixed default may be too narrow, that with the estimated smoothing too wide. The medians of the two later periods differ from those of the primary analysis by at most 0.11, and growth after the official declaration is slower than before it with a posterior probability of 0.99 or more in both programs; the exploratory division of the last period is more pronounced (1.10 and 0.26 with Delphy, where the primary analysis gives 0.92 and 0.45). With the same treatment of the smoothing the two programs agree: for all five reproduction numbers (the three periods and the two parts of the last) the median of each program lies inside the 95 % HPD interval of the other (data not shown).
Interpretation and limitations. Before the official declaration, one case infected about two others on average, which is similar to estimates for the 2007 Bundibugyo virus outbreak in Uganda [1] and the Ebola virus disease epidemic in West Africa [2]. This estimate does not depend on the most recent genomes. Its largest uncertainties are the smoothing of the model (1.77 and 2.11 where it is fixed over 60 and 15 days; 2.27 (1.57–3.07) and 2.38 (1.55–3.50) where it is estimated), the generation time, which is the serial interval of Ebola virus disease (1.71 to 2.16 for means of 12 to 18 days), and the choice of the period. Growth slowed within a month after the official declaration, but the slower growth cannot be attributed to the response from these data alone. Nor do the estimates show that transmission has fallen in the outbreak as a whole: they describe the virus population sampled in Ituri, reported cases in the same health zones rose in June and July while the effective population size did not, and cases in Nord-Kivu rose until mid-September. Lastly, the coalescent model assumes one well-mixed population sampled at random. Its population size is constant within each interval of 15.4 days, and where an interval holds few coalescences the prior holds the estimate close to its neighbours, so changes within a few weeks are not resolved.
Data availability and use
All genome sequences analysed here are available from Pathoplexus (https://pathoplexus.org), organism Bundibugyo virus [12]. We used the state of the database of 28 September 2026 (LAPIS data version 1790610472), which held 810 genomes of the 2026 outbreak. The 791 genomes used, 680 in the analysed set and 111 further genomes in the other analyses of Figure 2, are collected in the Pathoplexus SeqSet PP_SS_4225.1 (PP_SS_4225.1 | Pathoplexus; DOI 10.62599/PP_SS_4225.1), through which each genome can be traced to its record and its submitters. Of the 791 genomes, 756 were generated and submitted by INRB and its partner laboratories and are shared under the Pathoplexus ‘Restricted’ licence; 35 are open data, of which 14 were submitted by the same laboratories and 21 by two other groups (20 from Uganda, 1 from Germany), whom we thank for sharing them.
The case counts are from the situation reports of the Institut National de Santé Publique (INSP) of the Democratic Republic of the Congo (SitRep MVE N°001–138, 14 May – 29 September 2026), as transcribed in the public repository INRB-UMIE/BDBV2026-Data [4]. They are shown here only as weekly sums by province, with attribution to INSP. The report PDFs are available from INSP (https://insp.cd/ebola-17eme-epidemie).
Authors
In alphabetical order; grouped by institution:
-
Collins Tanui (Africa CDC)
-
Justus Nsio (Africa CDC)
-
Yap Boum II (Africa CDC)
-
Yenew Kebede (Africa CDC)
-
Laura Luebbert (Anthropic, USA)
-
David Blazes (Gates Foundation)
-
Sofonias Kifle Tessema (Gates Foundation)
-
Adrienne Amuri-Aziza (INRB and Basic Sciences Department at the University of Kinshasa, Kinshasa DRC; Department of clinical sciences at the Institute of Tropical Medicine Antwerp Belgium and Department of Microbiology, Immunology and Transplantation KU Leuven Belgium, Belgium)
-
Dav Ebengo (INRB, INOHA, Kinshasa, DRC)
-
Emmanuel Lokilo-Lofiko (INRB, Kinshasa, DRC)
-
Gradi Luakanda-Ndelemo (INRB, Kinshasa, DRC)
-
Prince Akil (INRB, Kinshasa, DRC)
-
Sifa Kavira (INRB, Kinshasa, DRC)
-
Daniel Mukadi (INRB, University of Kinshasa, Kinshasa, DRC)
-
Eddy Kinganda-Lusamaki (INRB, University of Kinshasa, Kinshasa, DRC; TransVIHMI, Université de Montpellier, INSERM, IRD, Montpellier, France)
-
Pauline Muswamba (INRB, University of Kinshasa, Kinshasa, DRC)
-
Placide Mbala-Kingebeni (INRB, University of Kinshasa, Kinshasa, DRC; Africa CDC)
-
Steve Ahuka-Mundeke (INRB, University of Kinshasa, Kinshasa, DRC)
-
Tania Bishola (INRB, University of Kinshasa, Kinshasa, DRC)
-
Tony Wawina-Bokalanga (INRB, University of Kinshasa, Kinshasa, DRC; Department of Clinical Sciences, Institute of Tropical Medicine, Antwerp, Belgium)
-
Dieudonne Mwamba (INSP, Kinshasa, DRC)
-
Pierre Akilimali (INSP, University of Kinshasa, Kinshasa, DRC)
-
Amadou Mouctar Diallo (WHO, DRC)
-
Olga Ntumba (WHO, DRC)
-
Nicksy Gumede (WHO Regional Office for Africa)
Acknowledgements and Funding
We gratefully acknowledge the laboratories, health authorities, and response teams that generated the genome sequences and shared them rapidly through Pathoplexus, and the teams of the Institut National de Santé Publique that compile the situation reports, and the INRB-UMIE team that transcribes them in [4]. We thank the Ministry of Public Health, Hygiene and Social Welfare of the DRC. The authors gratefully acknowledge the ongoing support of the Africa Centers for Disease Control and Prevention (Africa CDC), the World Health Organization, and partner non-governmental organizations. We also acknowledge the support provided by the University of Manitoba (Canada), South African National Bioinformatics Institute (SANBI), Osaka Metropolitan University (OMU), Unité de Gestion du Programme de Développement du Système de Santé (UG-PDSS), the Institute of Tropical Medicine (ITM) through Belgian Directorate-general for Development Cooperation and Humanitarian Aid (DGD FA5 project, the Culmen International LCC, the US CDC Atlanta, and the Agence Française de Développement through the AFROSCREEN project (grant agreement CZZ3209), coordinated by ANRS Maladies Infectieuses émérgentes in partnership with Institut Pasteur and Institut de Recherche pour le Développement, the French Ministry of Europe and Foreign Affairs through FEF programme and support provided by Institut de Recherche pour le Développement. AREBO project funded by ANRS-MIE. A.A.-A is supported by a DGD sandwich PhD scholarship. P.M-K. acknowledges the support of the Wellcome Trust through the ARTIC Network (award 313694/Z/24/Z) and the Gates Foundation. This work was supported by Anthropic, which provided the credits and compute used for the analyses. Claude Science carried out the phylodynamic runs, the estimation of reproduction numbers, and the production of figures and tables under the authors’ direction, and the analyses reported here would not have been completed in this time frame without it.
Competing Interests
L.L. is an employee of Anthropic and holds equity in the company. Anthropic develops Claude Science, the software used in this analysis. L.L. contributed to the analysis, interpretation, and writing of this post; scientific outputs were reviewed by all authors. The remaining authors declare no competing interests.
Statement on continuing work and analyses prior to publication
Please note that this data is based on work in progress and should be considered preliminary. Our analyses are ongoing, and a publication communicating our findings is in preparation. Sequences are publicly accessible under the Pathoplexus ‘Restricted’ licence and we would be grateful if the terms of this were respected. If you intend to use our data prior to our publication, please contact Dr Tony Wawina-Bokalanga (INRB, DRC) and/or Prof. Placide Mbala-Kingebeni (INRB, DRC).
References
de Padua B, Akhmetzhanov AR. Estimated Transmissibility and Case Fatality Rate of Bundibugyo Virus, Uganda, 2007. Emerging Infectious Diseases 2026;32. doi:10.3201/eid3210.261175
WHO Ebola Response Team. Ebola Virus Disease in West Africa — The First 9 Months of the Epidemic and Forward Projections. New England Journal of Medicine 2014;371:1481-1495. doi:10.1056/nejmoa1411100
Institut National de Recherche Biomédicale (INRB) and partners. Genomic epidemiology of the ongoing 2026 Bundibugyo Virus Disease outbreak in the Democratic Republic of the Congo. Virological.org, 9 July 2026. Genomic epidemiology of the ongoing 2026 Bundibugyo Virus Disease outbreak in the Democratic Republic of the Congo.
Institut National de Santé Publique (INSP), Democratic Republic of the Congo. Rapports de situation, maladie à virus Ebola (SitRep MVE), N°001–138, 14 May – 29 September 2026. https://insp.cd/ebola-17eme-epidemie/. Transcribed in: INRB-UMIE. BDBV2026-Data: data and scripts for epidemiological analysis of the 2026 Bundibugyo Ebola outbreak, folder data/insp_sitrep (state of 1 October 2026, commit 8eb57154). GitHub - INRB-UMIE/BDBV2026-Data: Data and scripts for epidemiological analysis of the 2026 Bundibugyo Ebola outbreak · GitHub; doi:10.5281/zenodo.20922946
Gill MS, Lemey P, Faria NR, et al. Improving Bayesian Population Dynamics Inference: A Coalescent-Based Model for Multiple Loci. Molecular Biology and Evolution 2013;30:713-724. doi:10.1093/molbev/mss265
Wallinga J, Lipsitch M. How generation intervals shape the relationship between growth rates and reproductive numbers. Proceedings of the Royal Society B: Biological Sciences 2007;274:599-604. doi:10.1098/rspb.2006.3754
Institut National de Recherche Biomédicale (INRB) and partners. Phylodynamics and evolution of the 2026 Bundibugyo virus circulating in the Democratic Republic of the Congo: Insights from a 100-day window of genomic sequencing. Virological.org, 25 August 2026, with the follow-up of 27 August 2026. Phylodynamics and evolution of the 2026 Bundibugyo virus circulating in the Democratic Republic of the Congo: Insights from a 100‑day window of genomic sequencing
Varilly P, Schifferli M, Yang K, et al. Scalable near-real-time Bayesian phylogenetics for outbreaks with Delphy. Nature 2026. doi:10.1038/s41586-026-11012-6
Baele G, Ji X, Hassler GW, et al. BEAST X for Bayesian phylogenetic, phylogeographic and phylodynamic inference. Nature Methods 2025;22:1653-1656. doi:10.1038/s41592-025-02751-x
Heller R, Chikhi L, Siegismund HR. The Confounding Effect of Population Structure on Bayesian Skyline Plot Inferences of Demographic History. PLoS ONE 2013;8:e62992. doi:10.1371/journal.pone.0062992
Hall MD, Woolhouse MEJ, Rambaut A. The effects of sampling strategy on the quality of reconstruction of viral population dynamics using Bayesian skyline family coalescent methods: A simulation study. Virus Evolution 2016;2. doi:10.1093/ve/vew003
Pathoplexus. https://pathoplexus.org; Data Use Terms: Data Use Terms | Pathoplexus
World Health Organization. Disease Outbreak News: Ebola disease caused by Bundibugyo virus, Democratic Republic of the Congo & Uganda (item 2026-DON602). Ebola disease caused by Bundibugyo virus, Democratic Republic of the Congo & Uganda (accessed 5 October 2026)
Elvis Akem T, Oben EC (2026) Operational epidemiology of the early phase of the 2026 Bundibugyo virus disease outbreak in the Democratic Republic of the Congo and Uganda. PLOS Glob Public Health 6(8): e0006680. doi:10.1371/journal.pgph.0006680
World Health Organization. Disease Outbreak News: Ebola disease caused by Bundibugyo virus – Democratic Republic of the Congo (item 2026-DON603). Ebola disease caused by Bundibugyo virus – Democratic Republic of the Congo (accessed 5 October 2026)
ALIMA. Incident at Health Facilities in Rwampara Amid the Ebola Outbreak Response - ALIMA. Press release, 21 May 2026. Incident at Health Facilities in Rwampara Amid the Ebola Outbreak Response - ALIMA (accessed 5 October 2026)
Radio Okapi. Ebola : interdiction des activités de masse en Ituri. 23 May 2026. Ebola : interdiction des activités de masse en Ituri | Radio Okapi (accessed 5 October 2026)
Agence Congolaise de Presse. Ebola en Ituri : l’exécutif provincial annonce une série de mesures pratiques à observer - ACP. 22 May 2026. https://acp.cd/nation/ebola-en-ituri-lexecutif-provincial-annonce-une-serie-de-mesures-pratiques-a-observer/ (accessed 5 October 2026)
Médecins Sans Frontières. DRC: One month on, MSF warns dangerous gaps persist in Ebola disease response. Press release, 15 June 2026. DRC: MSF warns dangerous gaps persist in Ebola disease response | MSF (accessed 5 October 2026)
Médecins Sans Frontières Luxembourg. Épidémie Ebola causée par le virus Bundibugyo — Association d’aide médicale humanitaire — Médecins Sans Frontières Luxembourg. Épidémie Ebola causée par le virus Bundibugyo — Association d'aide médicale humanitaire — Médecins Sans Frontières Luxembourg (updated 30 Sept 2026; accessed 5 October 2026)
Médecins Sans Frontières Southern Africa. Ebola outbreak in eastern DRC intensifies as MSF strengthens treatment and containment efforts. 1 June 2026. Ebola outbreak in eastern DRC intensifies as MSF strengthens treatment and containment efforts | MSF (accessed 6 October 2026)
Médecins Sans Frontières. DRC Ebola outbreak response needs urgent scale-up after two months. Press release, 15 July 2026. Ebola response needs urgent scale-up after two months | MSF (accessed 5 October 2026)
Zhang Y, Ren J, Ma X, He X (2026) The 2026 Bundibugyo virus disease outbreak in the Democratic Republic of the Congo: Virology, epidemiology, continental response, and research priorities. Infect Med (Beijing) 5(3): 100270. doi:10.1016/j.imj.2026.100270
In the BEAST X analysis with the model of the primary analysis, six of eight chains were continued from a saved state. With these chains cut at their saved states, the medians of the reproduction numbers of the three periods are the same to two decimal places.