outbreak.info: SARS-CoV-2 Mutation Situation Reports
Emily Haag, Alaa Abdel Latif, Karthik Gangavarapu, Julia L. Mullen, Ginger Tsueng, Nate Matteson, Mark Zeller, Chunlei Wu, Kristian G. Andersen, Andrew I. Su, Laura D. Hughes, and the Center for Viral Systems Biology.
Introduction
A standardized, real-time resource to explore the current mutational landscape of SARS-CoV-2 is an essential tool for researchers fighting the pandemic. The team behind Outbreak.info has created a dashboard to explore the temporal and geographic prevalence of mutations, variants and lineages of SARS-CoV-2 using data available on GISAID. The dashboard can be accessed at https://outbreak.info/situation-reports.
Using the tool
The SARS-CoV-2 Mutation Situation Reports provide detailed snapshots of major lineages and mutations, or combinations of both, which are updated daily. In addition, the custom report builder allows the user to generate such snapshots for PANGO lineages and/or a custom set of mutations.
Interactive Mutation Maps
The dashboard includes interactive mutation maps for easy comparison between lineages. Amino acid mutations are indicated by circles. Deletions are annotated by deltas. Each report also contains a collapsible table of the key mutations that define the strain.
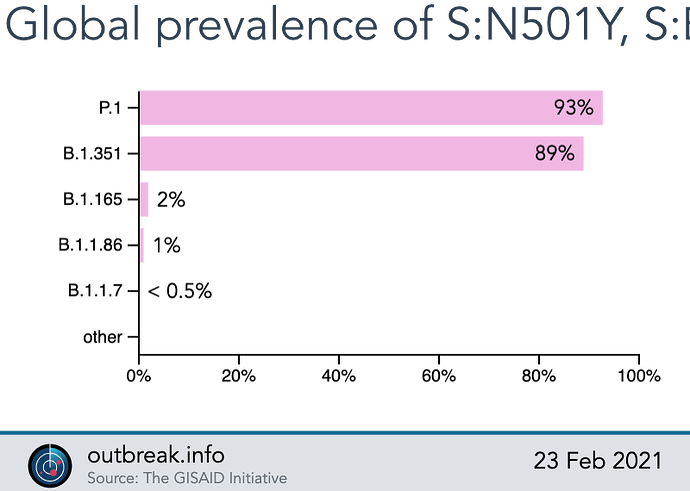
Mutation reports also identify prominent lineages in which the mutation is found.
Summary statistics
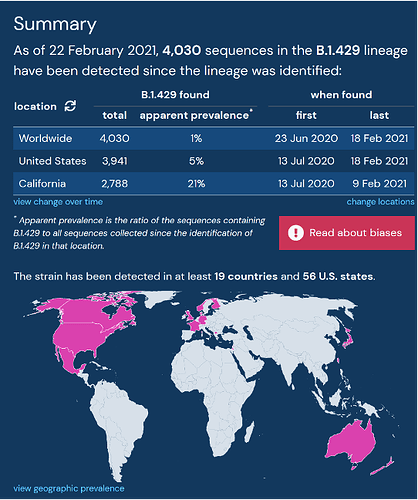
The SARS-CoV-2 Mutation Situation Reports contain a section summarizing important statistics, including the apparent cumulative prevalence and first and last dates of detection at the global-level or for a customizable set of state-level and country-level locations. This summary allows users to quickly gain insight into the overall prevalence for a chosen query.
Daily Prevalence over time
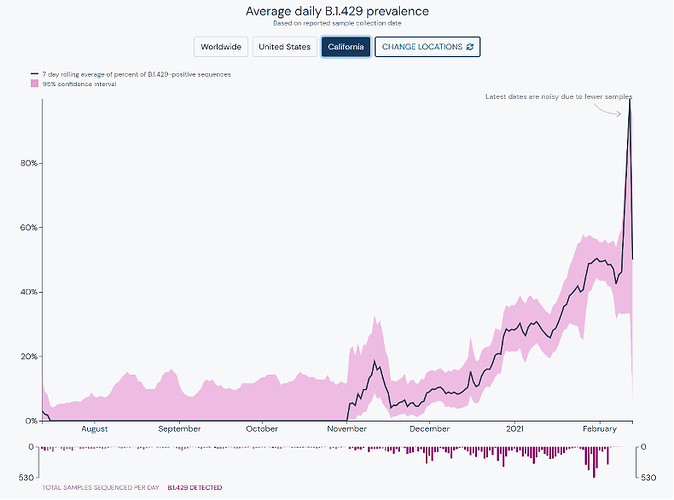
The SARS-CoV-2 Mutation Situation Reports show the seven day rolling average for prevalence of lineages at a global or customizable state-level and country-level locations. This is presented with confidence intervals, counts of sequenced samples per day, and helpful annotations to enable easy interpretation and convey uncertainty regarding the estimates of prevalence.
Cumulative Prevalence
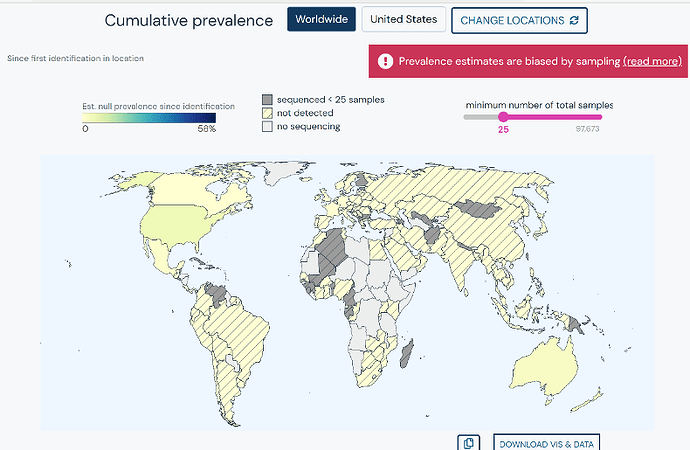
Cumulative prevalence of a lineage and/or a set of mutations, from first detection to the current date, can be explored via an interactive world map. Countries can be more deeply explored and visualization can be customized by easily adjusting the minimum number of total samples.
Related Literature
The SARS-CoV-2 Mutation Situation Reports aggregate preprints, journal articles and protocols related to the current query from LitCovid/PubMed, bioRxiv, medRxiv, MRC Centre for Global Infectious Disease Analysis, and COVID-19 Literature Surveillance Team.
Data and pipeline
All SARS-CoV sequences are downloaded daily from GISAID and subsequently processed using Bjorn which relies heavily on minimap2, and datafunk. PANGO lineage classification for each individual sequence was provided by GISAID. Sequences with collection dates specifying only the year were excluded, while date specifying only the year and month were assumed to have occurred on the 15th of that month.
Please report issues or request new features on GitHub.
Source: Alaa Abdel Latif, Karthik Gangavarapu, Emily Haag, Julia L. Mullen, Ginger Tsueng, Nate Matteson, Mark Zeller, Chunlei Wu, Andrew I. Su, Laura D. Hughes, Kristian G. Andersen, and the Center for Viral Systems Biology. outbreak.info (available at https://outbreak.info/situation-reports).
Funding: This work was supported by the National Institute for Allergy and Infectious Diseases (5 U19 AI135995-02), National Center for Data to Health (5 U24 TR00230), and Centers for Disease Control and Prevention (75D30120C09795).


