Note on data use
This is an informal analysis and is not intended as a formal preprint or manuscript in its current form. This post focuses on the deeper evolutionary history of the lineage leading to the current MV Hondius-associated Andes virus outbreak, using the publicly available Swiss outbreak genome PP_006WBLH.2 and PP_006XDJH.2, which we have permission to use for our analysis, as representative outbreak sequences together with other publicly available human and rodent-associated Andes virus sequences.
We thank all laboratories and researchers who generated and rapidly shared the sequence data that made this analysis possible. We also thank the Pathoplexus team for rapidly enabling Andes virus sequence sharing, and Dr David Safronetz and Dr Jonathan Audet for helpful discussions on the two Canadian sequences.
Summary
We analysed S, M and L segment sequences from Andes virus, including two representative genomes from the current MV Hondius-associated outbreak, together with closely related human and rodent-derived Andes virus sequences from the European Nucleotide Archive, GenBank and Pathoplexus. The aim of this analysis was to estimate the timing of the closest sampled common ancestors to the lineage leading to the current outbreak and to characterise mutations accumulated on the stem branch leading to that lineage.
Our main findings are:
-
Phylogenetic evidence supports a reservoir origin within Andes virus diversity associated with Oligoryzomys longicaudatus in Chile. Across the available closely related sequences, the S, M and L segment phylogenies showed broadly congruent topologies despite uneven contextual sampling across segments. The M segment had the richest set of nearby comparator sequences, whereas the L segment had the sparsest contextual sampling. This pattern suggests no evidence for reassortment among the sampled lineages, although additional intermediate reservoir or human sequences would be needed to rule out reassortment deeper in the ancestry of the outbreak lineage.
-
Molecular clock analyses estimate the timing of the closest sampled common ancestors to the current outbreak lineage. Because Andes virus is maintained in rodent reservoirs, we consider the analyses including rodent-associated sequences most relevant for deeper timescaling. In the M segment, which includes the closest available contextual sequence to the outbreak lineage,
KC567278.1-KC567261.1, the closest common ancestor was dated to April 1998 with a 95% highest posterior density interval of September 1982 to May 2007. The rodent-inclusive S-segment analysis gave an older and more uncertain estimate of March 1959, with a 95% HPD of December 1847 to September 1995. No equivalent rodent-inclusive estimate was possible for the L segment because no closely related rodent-derived L segment sequences were available. These dates estimate the closest sampled common ancestors to the outbreak lineage, not the exact timing of any possible spillover event. -
Substitution rate estimates depend strongly on the sampling timescale. Recent human-only datasets produced higher rate estimates and more recent common ancestor dates. Including older human and rodent-associated sequences lowered the inferred substitution rate and pushed the estimated common ancestor further back in time. This is consistent with the well-known timescale dependence of viral molecular-clock rate estimates [ref, ref].
-
We find no evidence for an elevated molecular clock rate on the branch leading to the current outbreak lineage. Relaxed clock analyses did not support an increased substitution rate on the stem branch leading to the current outbreak lineage. However, mutation reconstruction showed that most coding-region stem mutations were nonsynonymous: 11/13 in S, 16/18 in M, and 45/49 in L, compared with neutral reference expectations of 79%, 78%, and 78%, respectively. A one-sided binomial test supported enrichment of nonsynonymous mutations in the L segment (p = 0.0096; Bonferroni-corrected p = 0.0288 across the three segments). This should be interpreted cautiously given ancestral-state uncertainty and mutation-rate heterogeneity, but may warrant further functional investigation which we are currently working on.
Data curation and alignment
We downloaded Andes virus sequences for the S, M and L genome segments from ENA, GenBank and Pathoplexus. For the current outbreak, this post uses the publicly available Swiss outbreak sequence PP_006WBLH.2 and PP_006XDJH.2 from Canada. We combined this with closely related publicly available human- and rodent-associated Andes virus sequences.
Sequences were aligned to reference genomes NC_003466.1 for the S segment, NC_003467.2 for the M segment and NC_003468.2 for the L segment [ref] using MAFFT v7.5 with the --keeplength option [ref]. We manually inspected the alignments, removed sequences with poor alignment quality, and excluded distantly related sequences that weakened temporal signal or were too divergent for robust outbreak lineage dating.
From the Bellomo et al. dataset [ref], we included only the naturally infected Oligoryzomys longicaudatus sequences: S segment OP555728 and M segment OP555724 and excluded sequences derived from cell-culture passage or experimentally infected golden hamsters.
For sequences without exact collection dates, we consulted the original studies and assigned bounded sampling-date priors based on the reported sampling intervals.
Molecular clock analysis of closely related sequences
We performed molecular clock analyses using subsets of human and rodent-derived Andes virus sequences closely related to the current outbreak lineage. More distantly related sequences, including sequences clustering with Epuyén-like diversity, were excluded because they weakened temporal signal and were too divergent for robust dating of the current outbreak lineage.
After subsetting to closely related sequences, TempEst analysis indicated the presence of temporal signal across the three segments.
For each segment, we ran combinations of:
- strict clock + coalescent constant population size;
- strict clock + coalescent exponential population growth;
- relaxed clock + coalescent constant population size;
- relaxed clock + coalescent exponential population growth.
When possible, analyses were conducted using three dataset definitions:
- Dataset 1: human-derived samples with complete collection dates;
- Dataset 2: dataset 1 plus human-derived samples with partial or bounded collection dates;
- Dataset 3: dataset 2 plus rodent-derived samples.
Dataset 1 was available for all segments. Dataset 2 was available for the M segment. Dataset 3 was available for the S and M segments. No equivalent rodent-inclusive L-segment dataset was available because closely related rodent-derived L-segment sequences were not available.
For each dataset, we also ran two sampling schemes. In the first, we included all available sequences in the selected dataset. In the second, we reduced clusters of very closely related sequences to a single representative sequence. Specifically, from the current outbreak we retained only the publicly available Swiss sample; from the closely related MN cluster we retained the oldest available sample, collected on 2018-08-19; and from the PV cluster we retained the oldest available sample, collected on 2024-06-27. This sensitivity analysis was performed to assess whether including multiple near-identical or very closely related sequences affected the coalescent process and, consequently, the estimated dates of the closest common ancestors to the outbreak lineage.
Strict clock analyses across all datasets converged well, with effective sample size values above 200 for all parameters. Relaxed clock analyses using the full closely related datasets also converged well and did not show strong evidence for rate variation across branches, including on the stem branch leading to the current outbreak lineage. Relaxed clock analyses using only recent human-derived samples were less stable (not shown), likely reflecting limited evolutionary signal in these smaller datasets.
Because relaxed clock analyses did not identify strong branch-specific rate variation, we report the main molecular dating estimates from strict clock analyses.
Timescale of the closest common ancestor to the outbreak lineage
Across segments, the most consistently available close relatives of the current outbreak lineage were human-derived Andes virus sequences collected in Argentina in 2018, with GenBank accession IDs prefixed with MN. These sequences were available for the S, M and L segments and therefore provided the main cross-segment comparator (Figure 1).
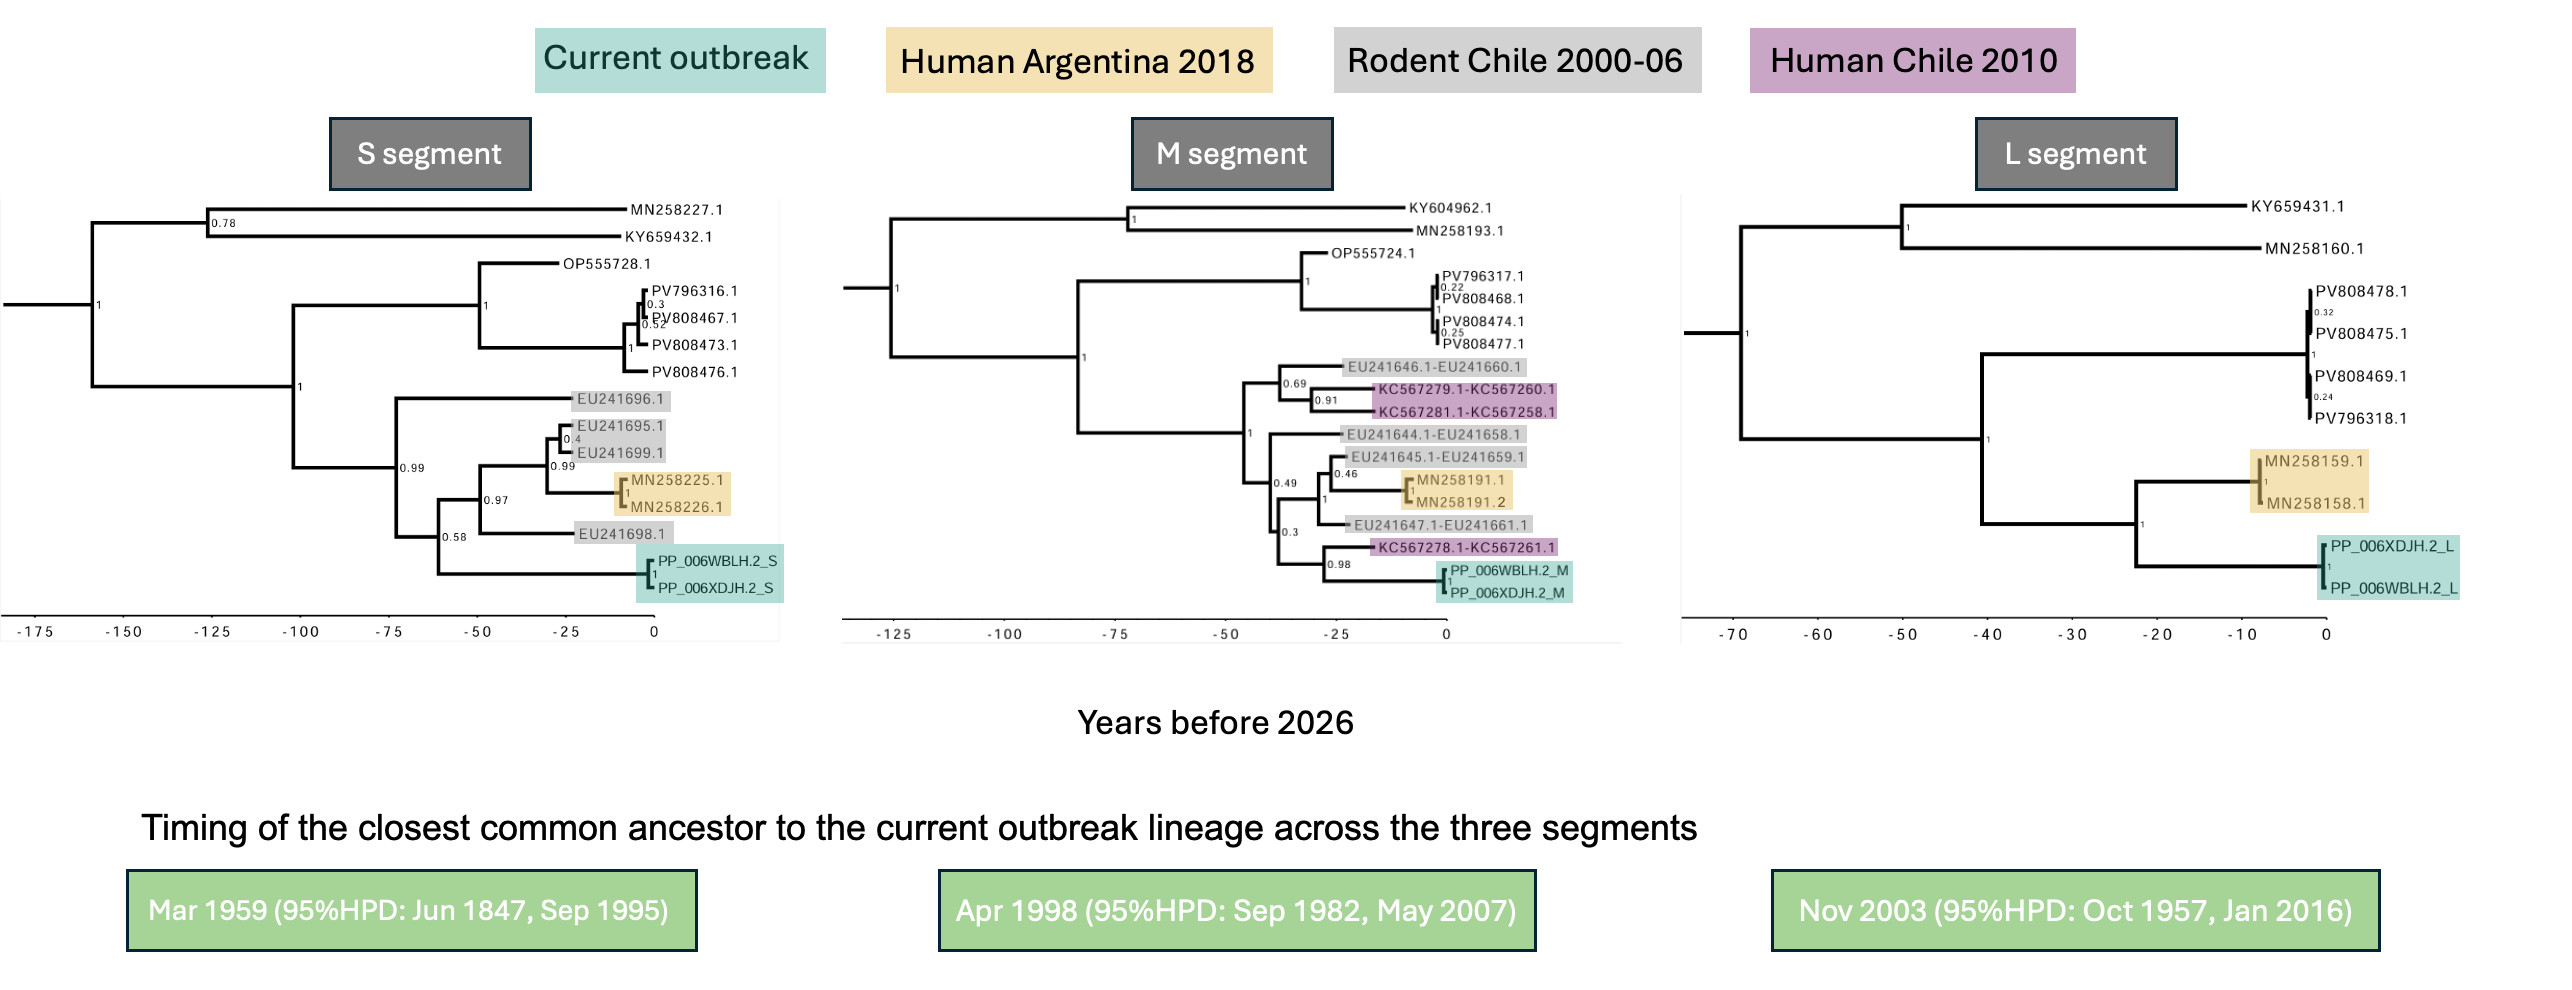
Figure 1. Time-scaled phylogenies and estimated closest common ancestor of the current outbreak lineage across the S, M and L segments using strict clock and coalescent constant population size models. Time-scaled phylogenies for the S, M and L genome segments, including the current outbreak sequences and the closest available human and rodent-associated Andes virus sequences. Current outbreak sequences are highlighted in turquoise. The closest previously sampled human sequences with complete collection dates from Martinez et al. [ref] (GenBank accession IDs beginning with MN) are shown in orange. Rodent-associated sequences from Medina et al. [ref] (GenBank accession IDs beginning with EU) are displayed in grey, and human-associated M segment sequences with inexact collection dates from Martinez-Valdebenito et al. [ref] (GenBank accession IDs beginning with KC) are shown in purple. Time on x-axis is shown as years prior to the most recent sample (2026-05-06). The S and M segment analyses use dataset 3, which includes closely related human and rodent-associated sequences, while the L segment analysis uses dataset 1 because no closely related rodent-derived L-segment sequences were available. The median and 95% highest posterior density (HPD) dates of the closest common ancestor of the current outbreak lineage are shown in green boxes. The L segment gives a more recent estimate than the S and M segments, but this analysis lacks the genetically closer KC- and EU-contextual sequences available for the other segments (indicated with purple and grey, respectively) and has a higher inferred clock rate, as shown in Figure 2.
Additional closely related sequences were available only for some segments. In the S and M segments, rodent-derived sequences also clustered close to the outbreak-associated lineage, supporting its association with reservoir diversity. In the M segment, the human-derived sequence KC567278.1-KC567261.1 was the nearest available relative to the outbreak lineage.
We observed evidence of timescale-dependent rate variation (Figure 2). Analyses using only recent samples from 2016-2026 inferred higher substitution rates and more recent common-ancestor dates. Including older human and rodent-associated samples from 1999 and the early 2000s reduced the inferred rate by nearly an order of magnitude and pushed the inferred common ancestor further back in time.
Using the full available datasets, including human samples with incomplete collection dates and rodent-associated samples where available, the closest common ancestor was dated to:
S segment: Mar 1959, 95% HPD: Jun 1847 – Sep 1995
M segment: Apr 1998, 95% HPD: Sep 1982 – May 2007
No equivalent rodent-inclusive estimate could be inferred for the L segment because no closely related rodent-derived L segment sequences were available. Among the available segment datasets, we consider the M segment dataset 3 estimate to be the most informative for dating the closest common ancestor of the outbreak lineage because it includes the nearest available contextual sequence to the outbreak lineage, KC567278.1-KC567261.1.
These estimates should not be interpreted as the exact date of spillover. Rather, they date the closest sampled common ancestors to the lineage leading to the current outbreak. Any spillover event could have occurred at any point between that ancestor and the emergence of the sampled outbreak lineage.
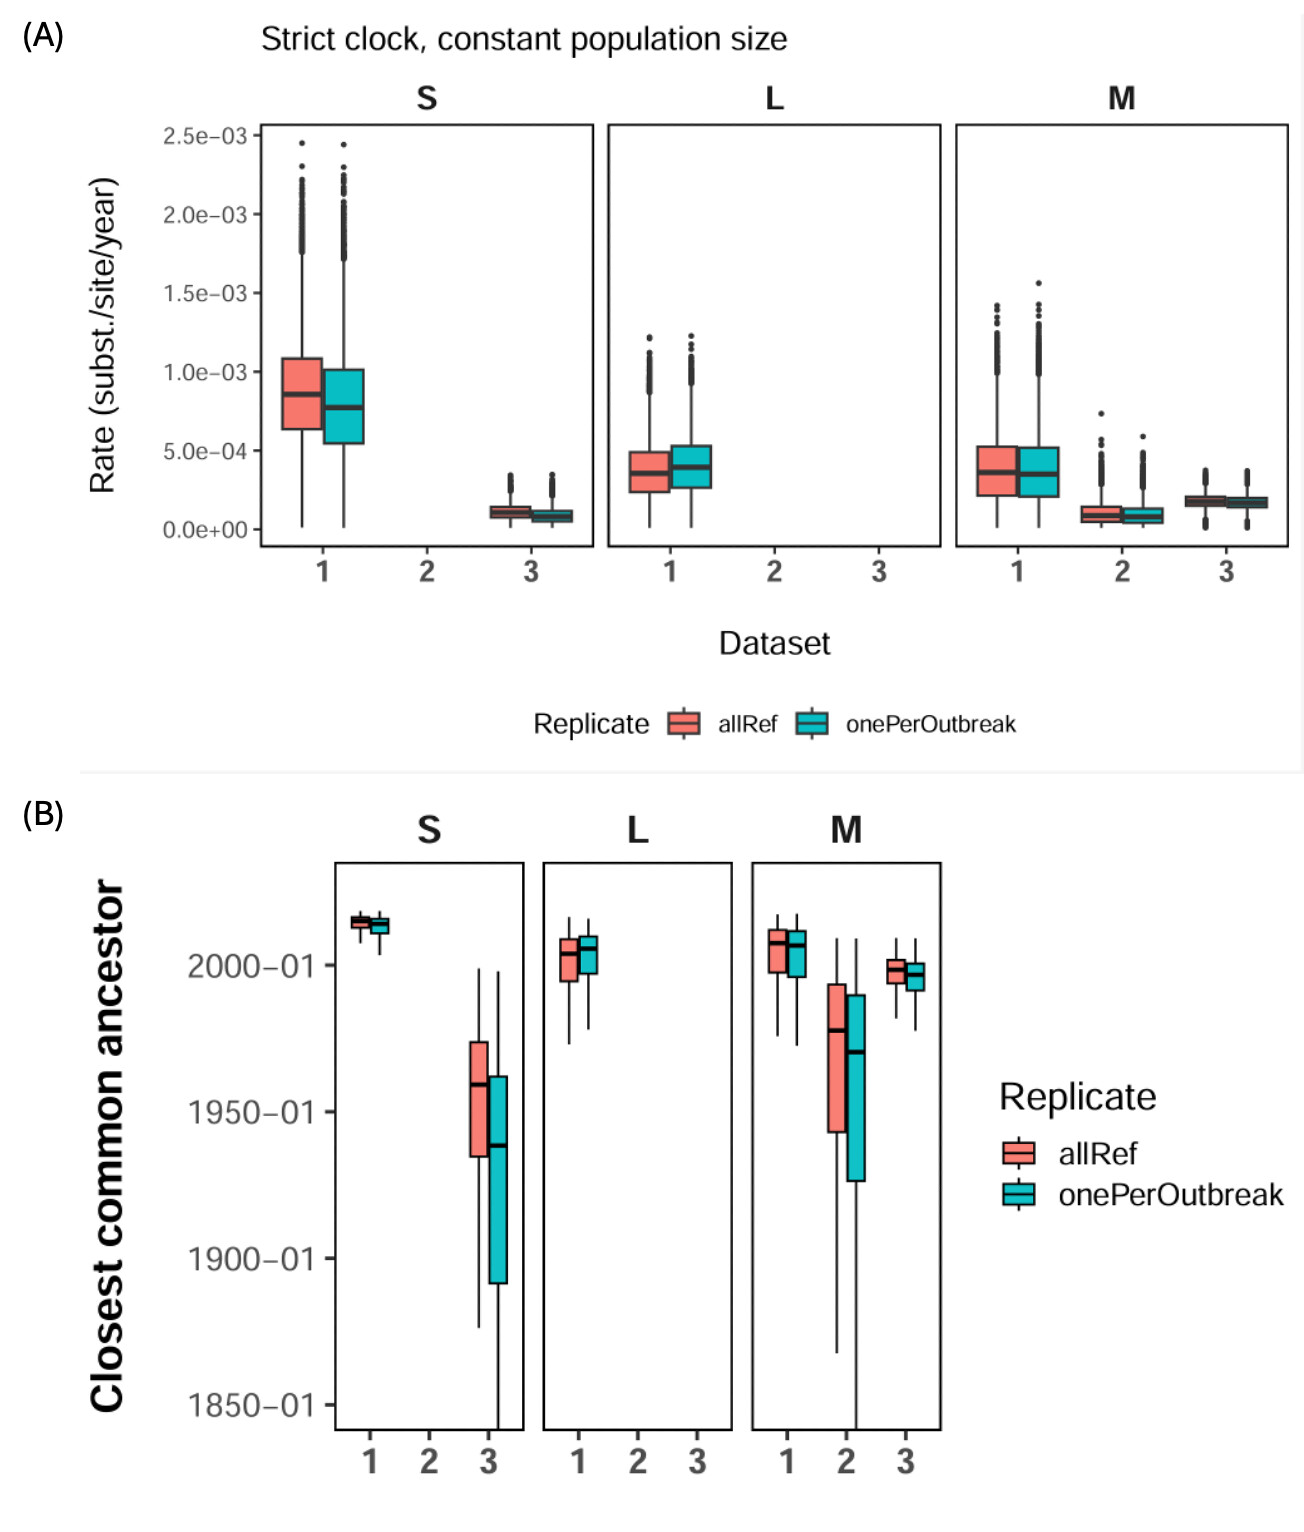
Figure 2. Posterior estimates of substitution rates and closest common ancestor dates under different dataset definitions and sampling schemes. (A) Posterior distributions of inferred substitution rates for the S, M and L segments under a strict clock and constant population size model. Dataset 1 includes human-derived samples with complete collection dates, with the oldest sample from 2016. Dataset 2 adds human-derived samples with partial or bounded collection dates, extending the sampling window to 2010. Dataset 3 further includes rodent-associated samples, extending the sampling window to 1999. Dataset 3 was available for the S and M segments; no equivalent rodent-inclusive L segment dataset was available. Dataset 2 was available only for the M segment. (B) Posterior distributions for the date of the closest common ancestor between the current outbreak lineage and its closest available contextual lineage, corresponding to the nodes shown in Figure 1. Red boxes show analyses including all available reference and contextual sequences, while blue boxes show sensitivity analyses retaining one representative sequence per closely related outbreak cluster. Across segments, broader datasets spanning longer timescales infer lower substitution rates and, in turn, older closest common ancestor dates.
Mutation reconstruction on the stem branch leading to the outbreak lineage
We reconstructed mutations leading from the closest inferred common ancestor to the current outbreak lineage across the S, M and L segments (Figure 3). Ancestral-state reconstruction was performed on segment-specific trees containing subsets of human and rodent-derived sequences closely related to the current outbreak lineage.
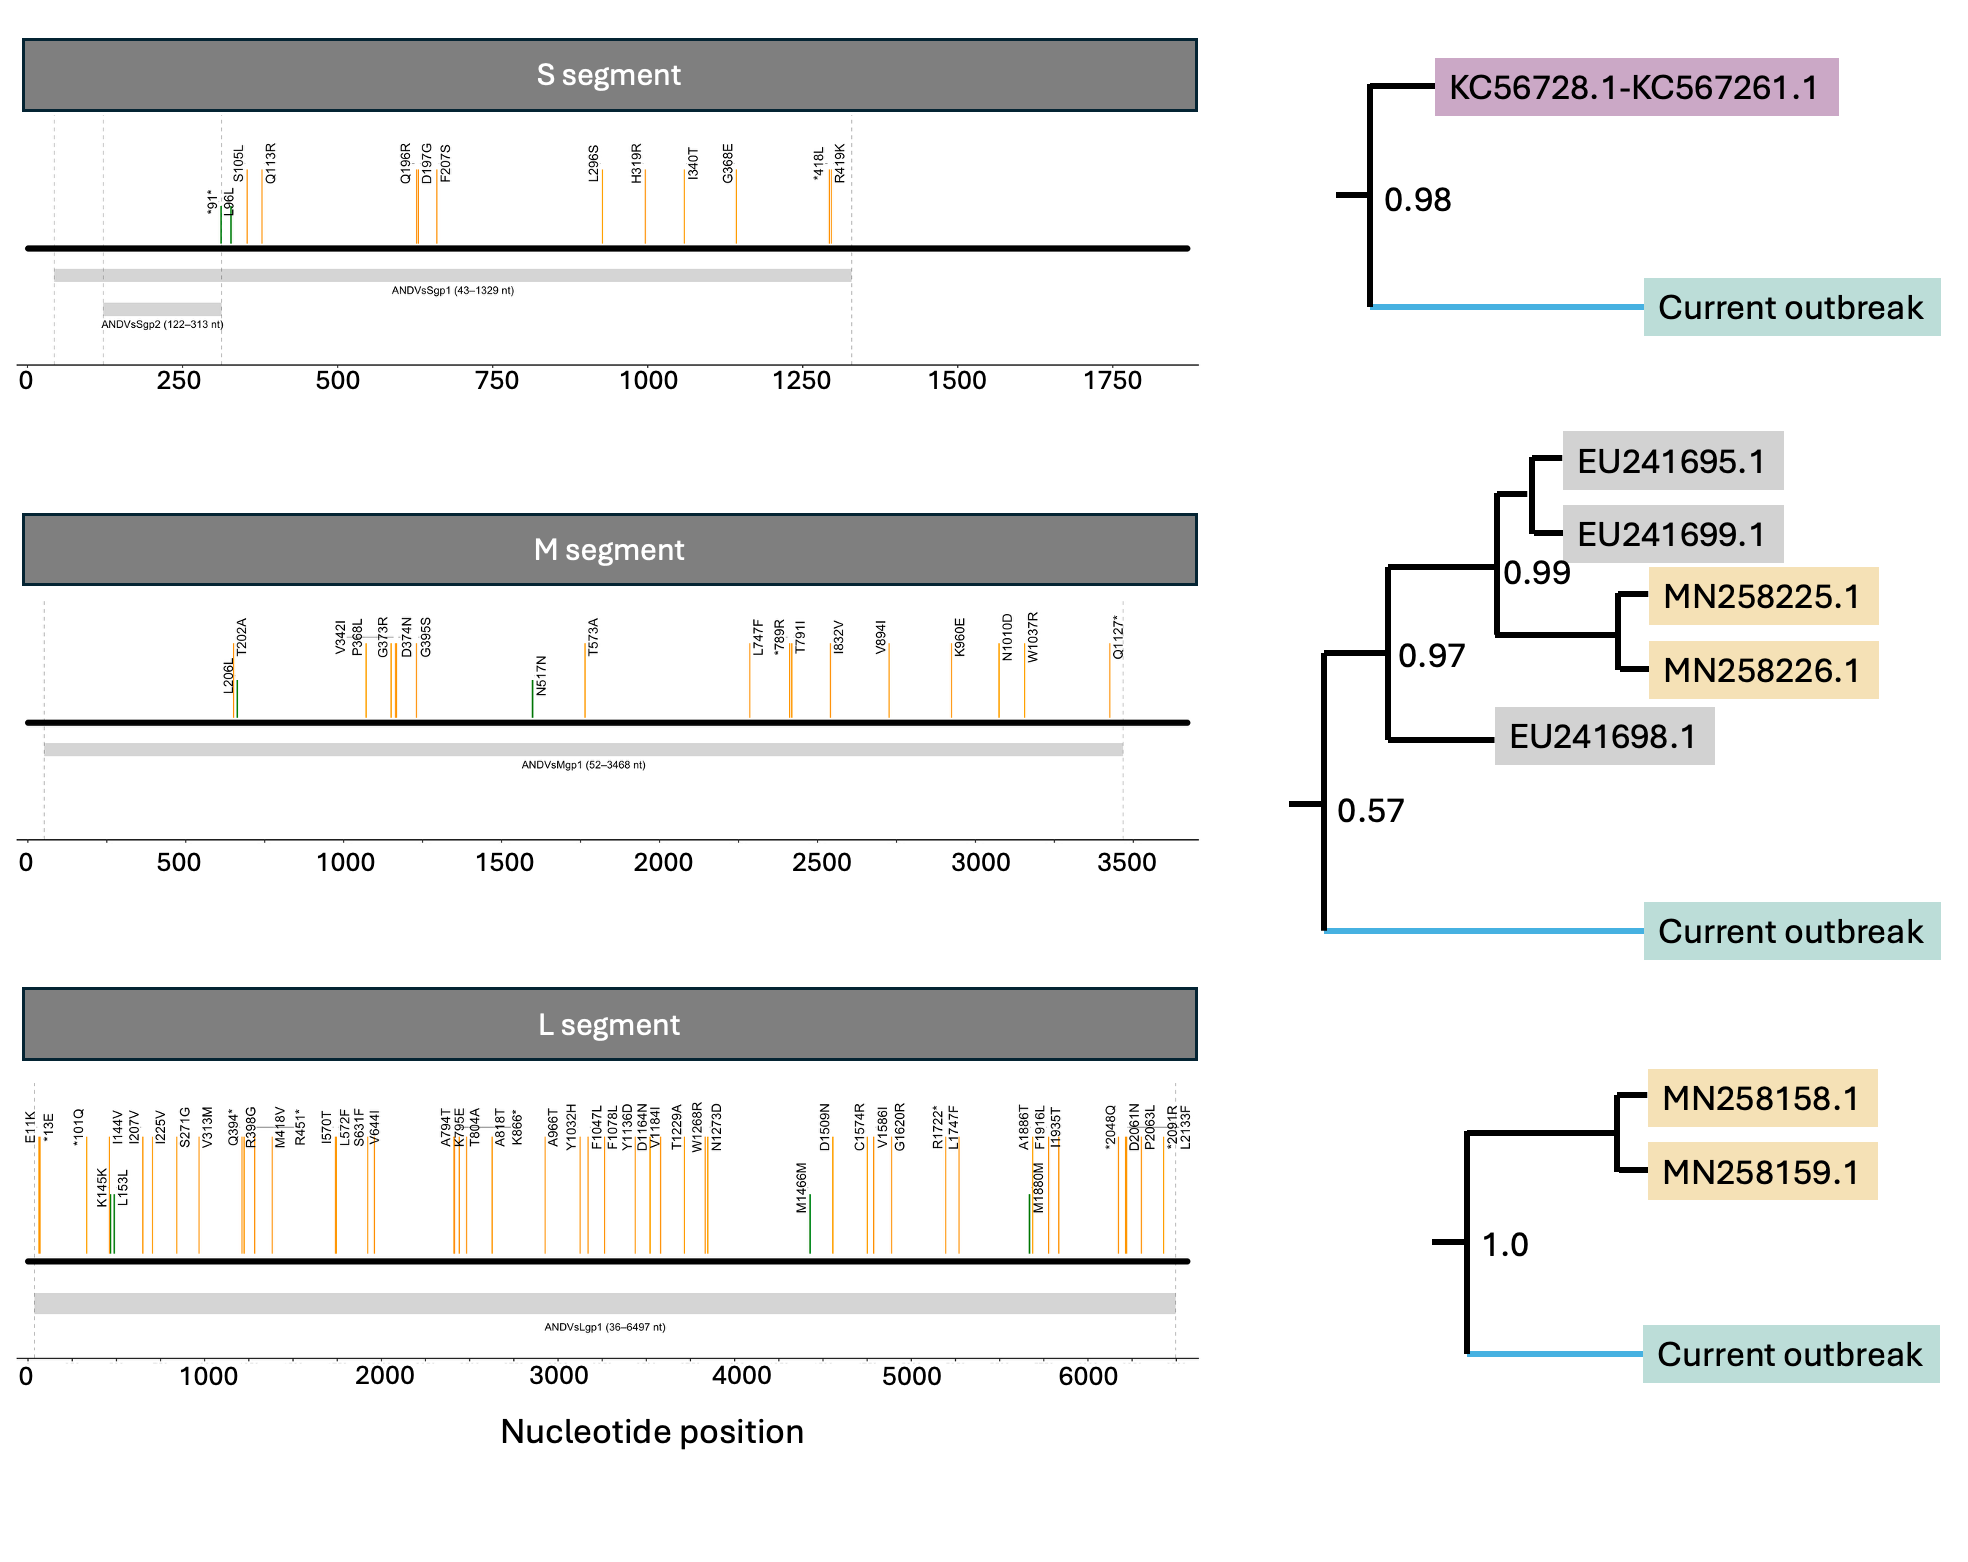
Figure 3. Mutations from the closest common ancestor of S, M, and L segments (blue branch) leading up to the current outbreak lineage. Orange and green vertical lines represent nonsynonymous and synonymous mutations, respectively. Positions are mapped against reference genomes NC_003466.1, NC_003467.2 and NC_003468.2, respectively. Numbers on internal nodes of the trees show posterior support from maximum clade credibility trees.
All mutations included in this analysis fell within annotated coding regions. Most reconstructed stem-branch mutations were nonsynonymous:
S segment: 11/13 nonsynonymous mutations (85%)
M segment: 16/18 nonsynonymous mutations (89%)
L segment: 45/49 nonsynonymous mutations (91%)
To provide a neutral reference expectation, we enumerated all possible single-nucleotide mutations in the Andes virus reference coding regions and classified them as synonymous or nonsynonymous. Under this baseline, approximately 79%, 78%, and 78% of possible mutations were nonsynonymous for the S, M and L segments, respectively.
A one-sided binomial test did not support significant nonsynonymous enrichment in the S or M segments, but did suggest enrichment in the L segment (p = 0.0096; Bonferroni-corrected p = 0.0288 across the three segments). This result should be interpreted cautiously given uncertainty in ancestral reconstruction, mutation-rate heterogeneity, and the simplicity of the neutral baseline. Nevertheless, it is consistent with a modest excess of amino-acid changing mutations on the L segment stem branch.
Importantly, relaxed clock analyses did not show evidence for an elevated substitution rate on the stem branch leading to the current outbreak lineage (Figure 4). We therefore do not find evidence for an episodic increase in the molecular evolutionary rate leading to the outbreak, although the stem-branch mutation spectrum may warrant further functional investigation.
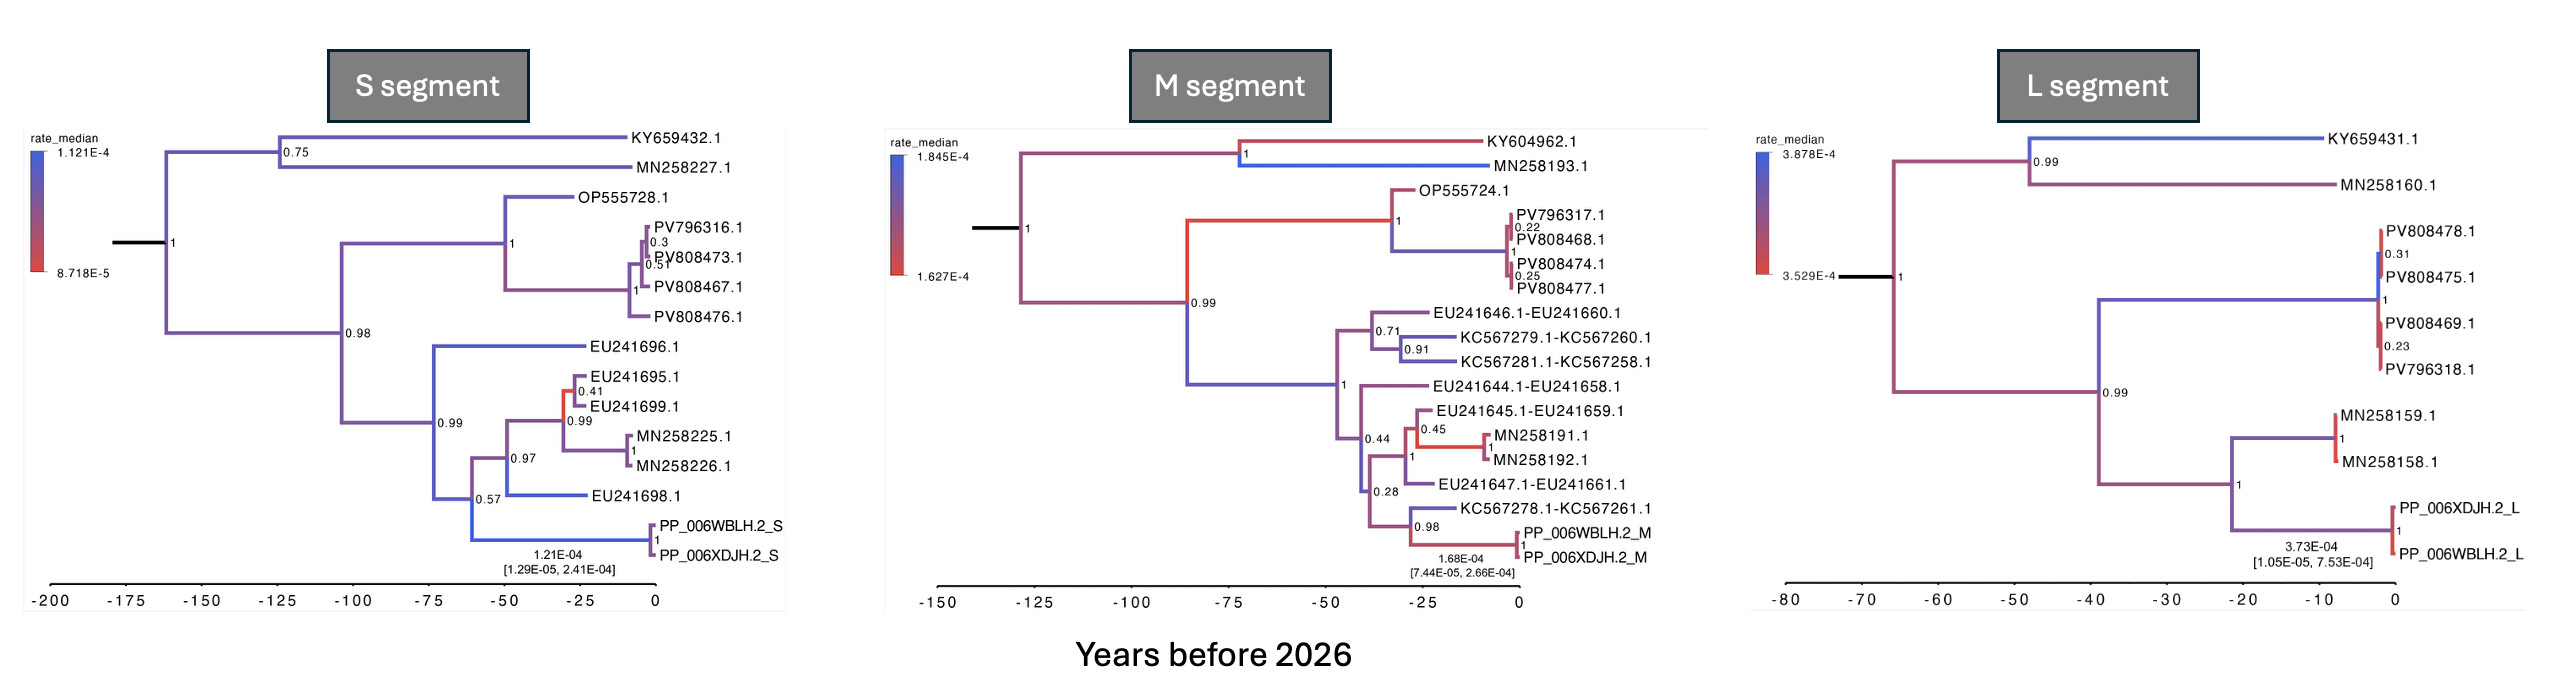
Figure 4. Time-scaled phylogenies across the S, M and L segments using uncorrelated lognormal relaxed clock and coalescent constant population size models. Time-scaled phylogenies for the S, M and L genome segments, including the current outbreak sequences and the closest available human and rodent-associated Andes virus sequences. The closest previously sampled human sequences with complete collection dates from Bellomo et al. [ref] (GenBank accession IDs beginning with MN). Rodent-associated sequences from Medina et al. [ref] (GenBank accession IDs beginning with EU), and human-associated M segment sequences with inexact collection dates from Martinez-Valdebenito et al. [ref] (GenBank accession IDs beginning with KC). Branches in the phylogenetic trees are coloured according to median evolutionary rate estimates (substitutions/site/year), with red indicating lower rates and blue indicating higher rates. Median rate estimates and their corresponding 95% highest posterior density intervals (95% HPDs) for the stem branch leading to the current outbreak are shown beneath the branch. The S and M segment analyses were performed using dataset 3, which includes closely related human and rodent-associated sequences, whereas the L-segment analysis used dataset 1 due to the absence of closely related rodent-derived L-segment sequences. For the L segment, relaxed clock analyses with coalescent constant population size model based solely on human-derived samples did not have good mixing for multiple model parameters, and these results should therefore be interpreted with caution. Comparable issues were observed in the S and M segment relaxed clock analyses using dataset 1.
Interpretation
The broader phylogenetic context is consistent with the current outbreak lineage emerging from Andes virus diversity associated with the Oligoryzomys longicaudatus reservoir in Chile. Across the available closely related sequences, the S, M and L segment phylogenies were broadly congruent, suggesting no evidence for reassortment among the sampled lineages. However, additional intermediate reservoir or human sequences would be needed to rule out reassortment deeper in the ancestry of the outbreak lineage.
The deeper timing remains sensitive to the timescale of the sequences included. Recent-only human datasets produce higher clock-rate estimates and younger common ancestors. Inclusion of older reservoir-associated sequences lowers the inferred rate and pushes the closest common ancestor further back. Given that Andes virus is maintained in rodent reservoirs, and that the deeper branches in these analyses likely reflect reservoir-associated evolution, we consider the rodent-inclusive S- and M-segment analyses to be more relevant for dating the deeper ancestry of the outbreak lineage.
For the L segment, no closely related rodent-derived sequences were available. The L segment estimate is therefore based on a recent human-only dataset and gives a more recent common ancestor than the S and M segment rodent-inclusive analyses. This difference should be interpreted in light of the more limited contextual sampling for L.
Overall, our results support a rodent-reservoir source within Andes virus diversity and place the closest sampled/common ancestor of the current outbreak lineage in approximately the late 1990s in the most informative M segment analysis, with a broader and older estimate from the S segment. We find no evidence for an elevated molecular clock rate leading to the outbreak lineage, although the L segment shows a modest enrichment of nonsynonymous changes on the stem branch. Further sampling, raw-read validation, and structural and functional analyses of stem-branch mutations will help us refine the evolutionary history of the lineage leading to the current outbreak.
As a robustness check, we repeated both the molecular-dating and mutation-reconstruction analyses using Delphy [ref] and obtained very similar results, not shown here.
Methods
Molecular dating analysis
We used BEAST 2 v2.6.3 [ref] for all time-scaled phylogenetic analyses. For each segment, we used an HKY+I substitution model, estimating the proportion of invariant sites. Uniform priors ranging from 1.0E-05 to 1.0E-02 s/s/y were assigned to the strict clock rate parameter (clockRate) and the relaxed clock mean parameter (ucldMean). All remaining priors were left at their default settings. MCMC analyses were run for 10-90 million iterations, with the initial 10% discarded as burn-in. Convergence and mixing of the chains were assessed using Tracer v1.7.2 [ref]. Maximum clade credibility (MCC) trees with median node heights were generated using TreeAnnotator with a 10% burn-in and visualised in FigTree v1.4.4 [ref]. For samples without exact collection dates, we assigned flat priors over the likely sampling interval based on information from the original studies.
We compared strict and relaxed molecular clock models under constant and exponential population size priors. Because relaxed clock analyses showed little evidence for strong cross-branch rate variation, and because strict clock analyses converged consistently across all segments, the main results are reported from the strict clock analyses.
Ancestral sequence reconstruction
We inferred ancestral sequences for the internal nodes of segment-specific trees containing subsets of human and rodent-derived sequences closely related to the current outbreak. Ancestral-state reconstruction was performed in IQ-TREE v2.3.5 using the –asr flag using the GTR+F+G4 substitution model, which was identified by ModelFinderPlus as the best-fitting model under AIC for each segment [ref].
To characterise the mutations leading to the current outbreak lineage, we compared the reconstructed sequence at the closest common ancestor of the outbreak lineage with the reconstructed sequence on the branch leading to the current outbreak cluster (see Figure 5). We then counted nucleotide changes falling within the annotated coding regions of each segment. The resulting mutation set was consistent with the mutations inferred using Delphy, with the exception of one additional S-segment mutation at position 354 in our IQ-TREE-based reconstruction.
Contributors to this analysis
Charu Sharma — Pandemic Sciences Institute, University of Oxford; Department of Biology, University of Oxford
Sanni Översti — Department of Biology, University of Oxford
Katrina Lythgoe — Pandemic Sciences Institute, University of Oxford; Department of Biology, University of Oxford
Aris Katzourakis — Department of Biology, University of Oxford
Spyros Lytras — Antigen Evolution & Design Lab, Department of Structural Biology and Chemistry, Institut Pasteur, Paris, France
Mahan Ghafari — Pandemic Sciences Institute, University of Oxford; Department of Biology, University of Oxford