Authors: Gina Cuomo-Dannenburg and Mahan Ghafari
Note on data use
This is an informal analysis and is not intended as a formal preprint or manuscript in its current form. The aim of this post is to provide a preliminary molecular evolutionary analysis of the current Bundibugyo virus disease outbreak, based on the 10 available outbreak-associated Bundibugyo virus (BDBV) sequences available as of 28 May 2026.
Specifically, we use these sequences to reconstruct the recent evolutionary history of the outbreak, estimate the time to the most recent common ancestor (tMRCA) of the sampled viruses, and derive preliminary estimates of the epidemic growth rate and corresponding reproduction number.
The sequences analysed here are collated in the Pathoplexus SeqSet: PP_SS_2146.2 | Pathoplexus. The outbreak sequences were first described and shared through this Virological post, and we encourage readers to consult that post for additional details on sequence generation and data release.
We present this post in line with the data-sharing agreements for Restricted-Use Data in Pathoplexus. We are grateful to all laboratories and researchers who generated and rapidly shared the sequence data that made this analysis possible. We also thank the Pathoplexus team for rapidly enabling BDBV sequence sharing.
Summary
We analysed 10 available BDBV sequences from the Democratic Republic of Congo and Uganda associated with the current 2026 Bundibugyo outbreak.
Our main findings are:
-
The inferred tMRCA of the sampled viruses is sensitive to the assumed substitution rate. Across six alternative substitution-rate assumptions, the median posterior tMRCA estimates range from late January to late March 2026, with wide 95% HPD intervals (Figure 2; Table 2). We therefore interpret these estimates as rate-conditioned sensitivity analyses rather than a single definitive estimate of the outbreak origin time.
-
The sampled viruses are already genetically diverse. We identified 23 unique mutations across the 10 sequences. This level of diversity suggests that the sampled viruses do not represent the very beginning of transmission, but instead reflect an outbreak that had already been circulating, at least partly undetected, for several weeks before sequences became available.
-
The estimated epidemic doubling time is relatively slow but highly uncertain. Although the posterior means imply positive growth under all substitution-rate assumptions, the 95% HPD intervals are wide and include scenarios with little or no growth. These estimates should therefore be interpreted as exploratory, rate-conditioned quantities rather than reliable standalone estimates of epidemic growth or transmissibility.
-
The corresponding reproduction number (R_0) estimates are centred above 1, with mean estimates ranging from 1.31 to 1.55 (Table 2), although substantial uncertainty remains because of the limited number of sequences currently available.
-
These estimates should be interpreted cautiously. The analysis is based on only 10 sequences collected over a short sampling window. The estimates of doubling time and R_0 are therefore likely to be affected by sampling bias and should be viewed as preliminary.
Data curation and alignment
We downloaded the outbreak-associated BDBV sequences from Pathoplexus, using the sequence set available as of 28 May 2026: PP_SS_2146.2 | Pathoplexus.
Sequences were aligned to the reference genome FJ217161.1 using MAFFT v7.490 with the -keeplength flag. The alignment was then manually inspected in AliView.
We performed ancestral node reconstruction using IQ-TREE v3.0.1 with the -anr flag and the best-fitting substitution model, HKY+F+I. We used this analysis to reconstruct the consensus sequence of the most recent common ancestor (MRCA) of the sampled outbreak sequences. This reconstructed MRCA sequence was then used as the root for the outbreak mutation reconstruction shown below.
Outbreak mutation reconstruction
The 10 available outbreak sequences are already genetically divergent from one another. The earliest sampled sequence, PP_006XHKB.2|DRC|2026-05-03, is closest to the reconstructed MRCA sequence, with two mutations from the root. All other sequences carry between three and five mutations from the reconstructed MRCA (Figure 1).
This pattern suggests that the sampled sequences do not capture the earliest phase of the outbreak. Instead, they are consistent with a larger, partly unsampled transmission chain that had already been ongoing before the available sequences were generated.
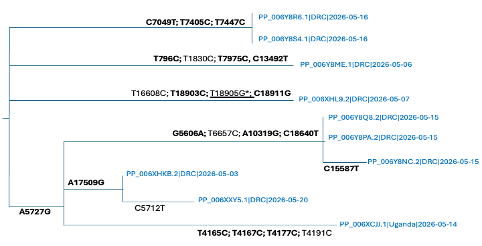
Figure 1 | Manually reconstructed mutation tree of ten available outbreak-associated Bundibugyo virus sequences as of 28 May 2026. The topology was constructed from the observed single nucleotide polymorphisms between the reconstructed MRCA sequence and the outbreak-associated sequences, rather than inferred using a phylogenetic dating program. Mutations are annotated relative to the reconstructed MRCA genome. Bold mutations represent non-synonymous changes. *The mutation T18905G could not be resolved at the amino-acid level because position 18906 is missing following alignment.
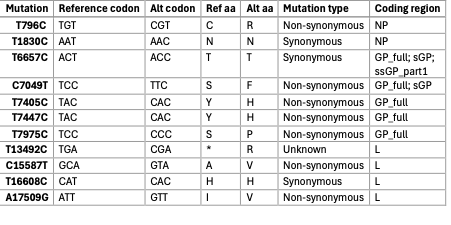
Across the 10 sequences, we identified 23 unique mutations – see supplementary CSV file contains the full list of mutations across the genome. Of these, 11 fall within coding regions of the genome. Table 1 lists the coding-region mutations, including their reference and alternative codons, amino-acid changes, mutation type, and coding region.
Five mutations occur in the glycoprotein region: T6657C, C7049T, T7405C, T7447C, and T7975C. Four of these five glycoprotein mutations are non-synonymous.
Table 1 | Coding-region mutations identified among the ten outbreak-associated BDBV sequences. The table lists unique mutations with their reference (ancestor) and alternative (derived) codons and amino acids, mutation type, and coding region. NP = nucleoprotein; GP_full = full glycoprotein; sGP = soluble secreted glycoprotein; ssGP = alternative secreted glycoprotein; L = RNA polymerase.
The reconstructed ancestral sequence should be interpreted as the ancestor of the currently sampled sequences, not necessarily the true ancestor of the outbreak. Because only a small number of sequences are currently available, and because these sequences may be biased spatially and temporally, the reconstructed MRCA may not fully represent the circulating viral diversity.
Estimates of tMRCA, epidemic growth rate, and reproduction number
We estimated the time to the most recent common ancestor (tMRCA) and the number of epidemic doublings per year using the Delphy web interface.1 For all analyses, we used an exponential-growth coalescent model, reflecting the expectation of a growing epidemic. An earlier Bayesian phylogenetic analysis of these same outbreak sequences was posted on Virological. Our analysis differs in several respects, including the use of Delphy, manual reconstruction of outbreak mutations, and exploration of multiple fixed substitution-rate assumptions. We included this rate-sensitivity analysis because, as seen for Zaire ebolavirus during and after the West African outbreak, early outbreak-based substitution-rate estimates can be higher than later estimates3-6, which can in turn affect inference of the tMRCA, epidemic growth rate, and corresponding reproduction number. We therefore view the results presented here as a complementary reanalysis rather than a replacement of the earlier work.
We considered six substitution-rate assumptions. In five analyses, we fixed the substitution rate using previously published Ebola virus estimates. These included one estimate from a previous Bundibugyo virus outbreak2 and several estimates from the 2013-2016 West African Ebola virus outbreak.3-6 In the sixth analysis, we estimated the substitution rate directly from the 10 outbreak sequences analysed here.
All Delphy analyses were run until the minimum effective sample size across parameters was greater than 100, and convergence was assessed by visual inspection of the parameter traces. The tMRCA and number of doublings per year are reported as posterior summaries, using the median and 95% highest posterior density (HPD) intervals from Delphy.
We then translated the estimated epidemic growth rate into an estimate of the basic reproduction number, R_0, using:
where D is the number of doublings per year and T_g is the generation time.
We calculated the generation time as:
where T_{\text{inc}} is the incubation period and T_{\text{inf}} is the infectious period.
We used systematically collected Ebola virus disease parameters7 available through {epireview}8 to identify previous estimates of epidemiological delays for Bundibugyo virus disease.9,10 This gave a generation time estimate of 9.6 days. The uncertainty intervals for R_0 were obtained by propagating the 95% HPD interval from the estimated number of doublings per year.
The posterior tMRCA estimates across substitution-rate assumptions are shown in Figure 2. Each estimate should be interpreted conditionally on the assumed substitution rate used in that analysis. The resulting tMRCA estimates vary substantially across rate assumptions, illustrating that early phylogenetic dating from this small sequence set is sensitive to the clock rate. Although there is substantial variation among substitution-rate assumptions, all analyses place the median posterior tMRCA no later than 23 March 2026.
The estimated growth rates and R_0 values are likely affected by sampling bias. The sequences included here were collected between 03 May 2026 and 20 May 2026, and therefore represent a short time window around the identification and declaration of the BVD outbreak.11 Situation reports12,13 and independent epidemiological analyses14 suggest that, even at the time these sequences were generated, the outbreak was already substantially larger than the available sequence data alone would indicate.
Table 2 | Substitution rates and corresponding estimates of tMRCA, doublings per year, and reproduction number. All substitution rates, except the final estimate, were fixed using previous Ebola virus substitution-rate estimates. These include an estimate from a previous Bundibugyo virus outbreak2 and estimates from the 2013-2016 Ebola virus outbreak in West Africa.3-6 The final row shows an analysis in which the substitution rate was estimated directly from the 10 outbreak sequences analysed here. All analyses were performed in Delphy1 and run until the minimum effective sample size was greater than 100. The reproduction number was estimated from the number of doublings per year using a generation time estimate derived from published incubation and infectious-period estimates for Bundibugyo virus disease.7-10
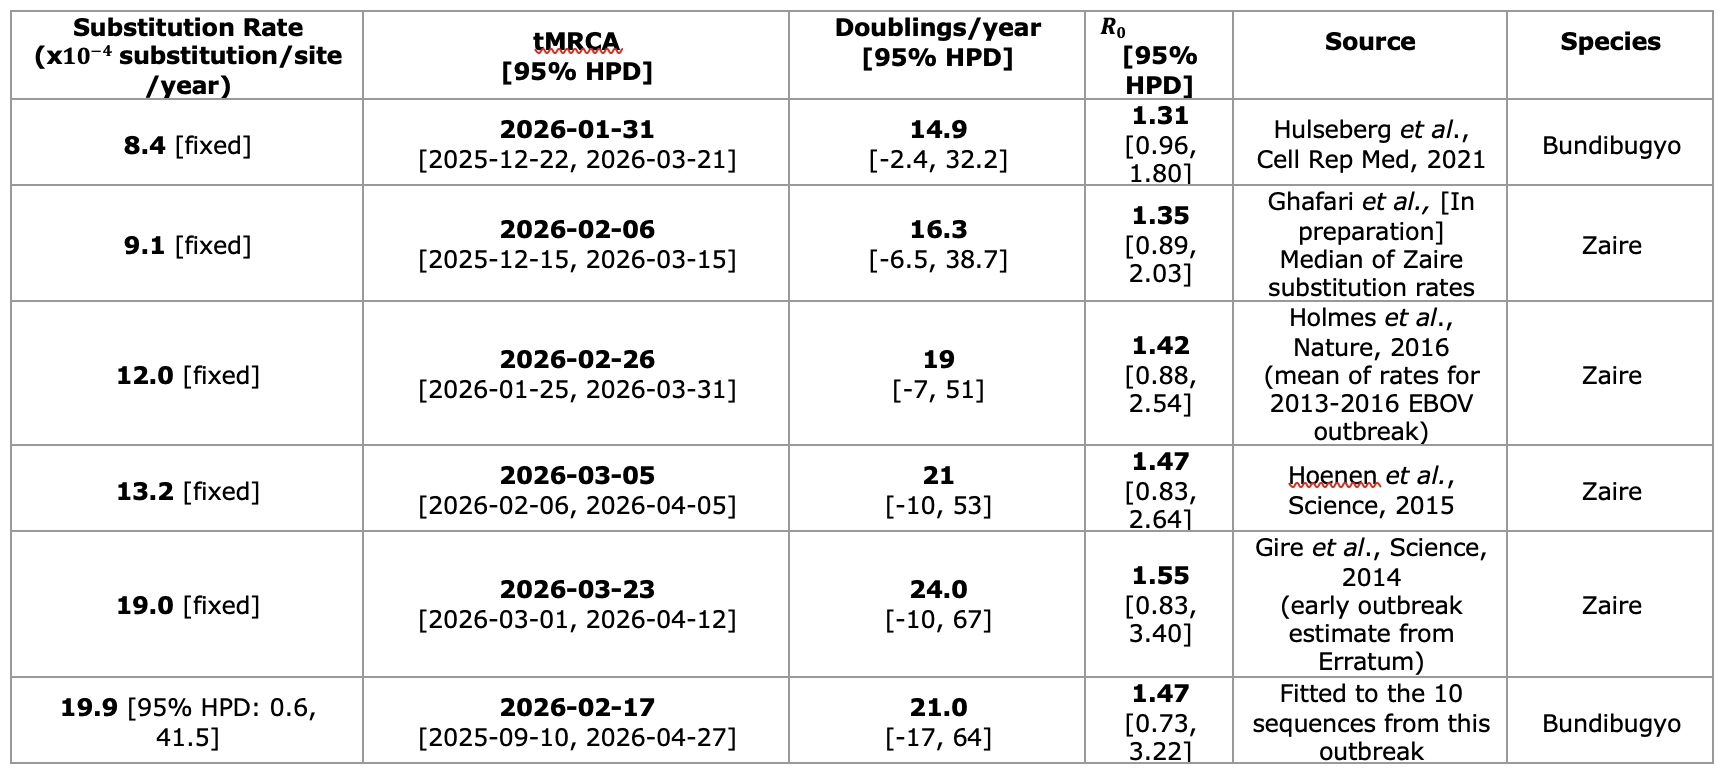
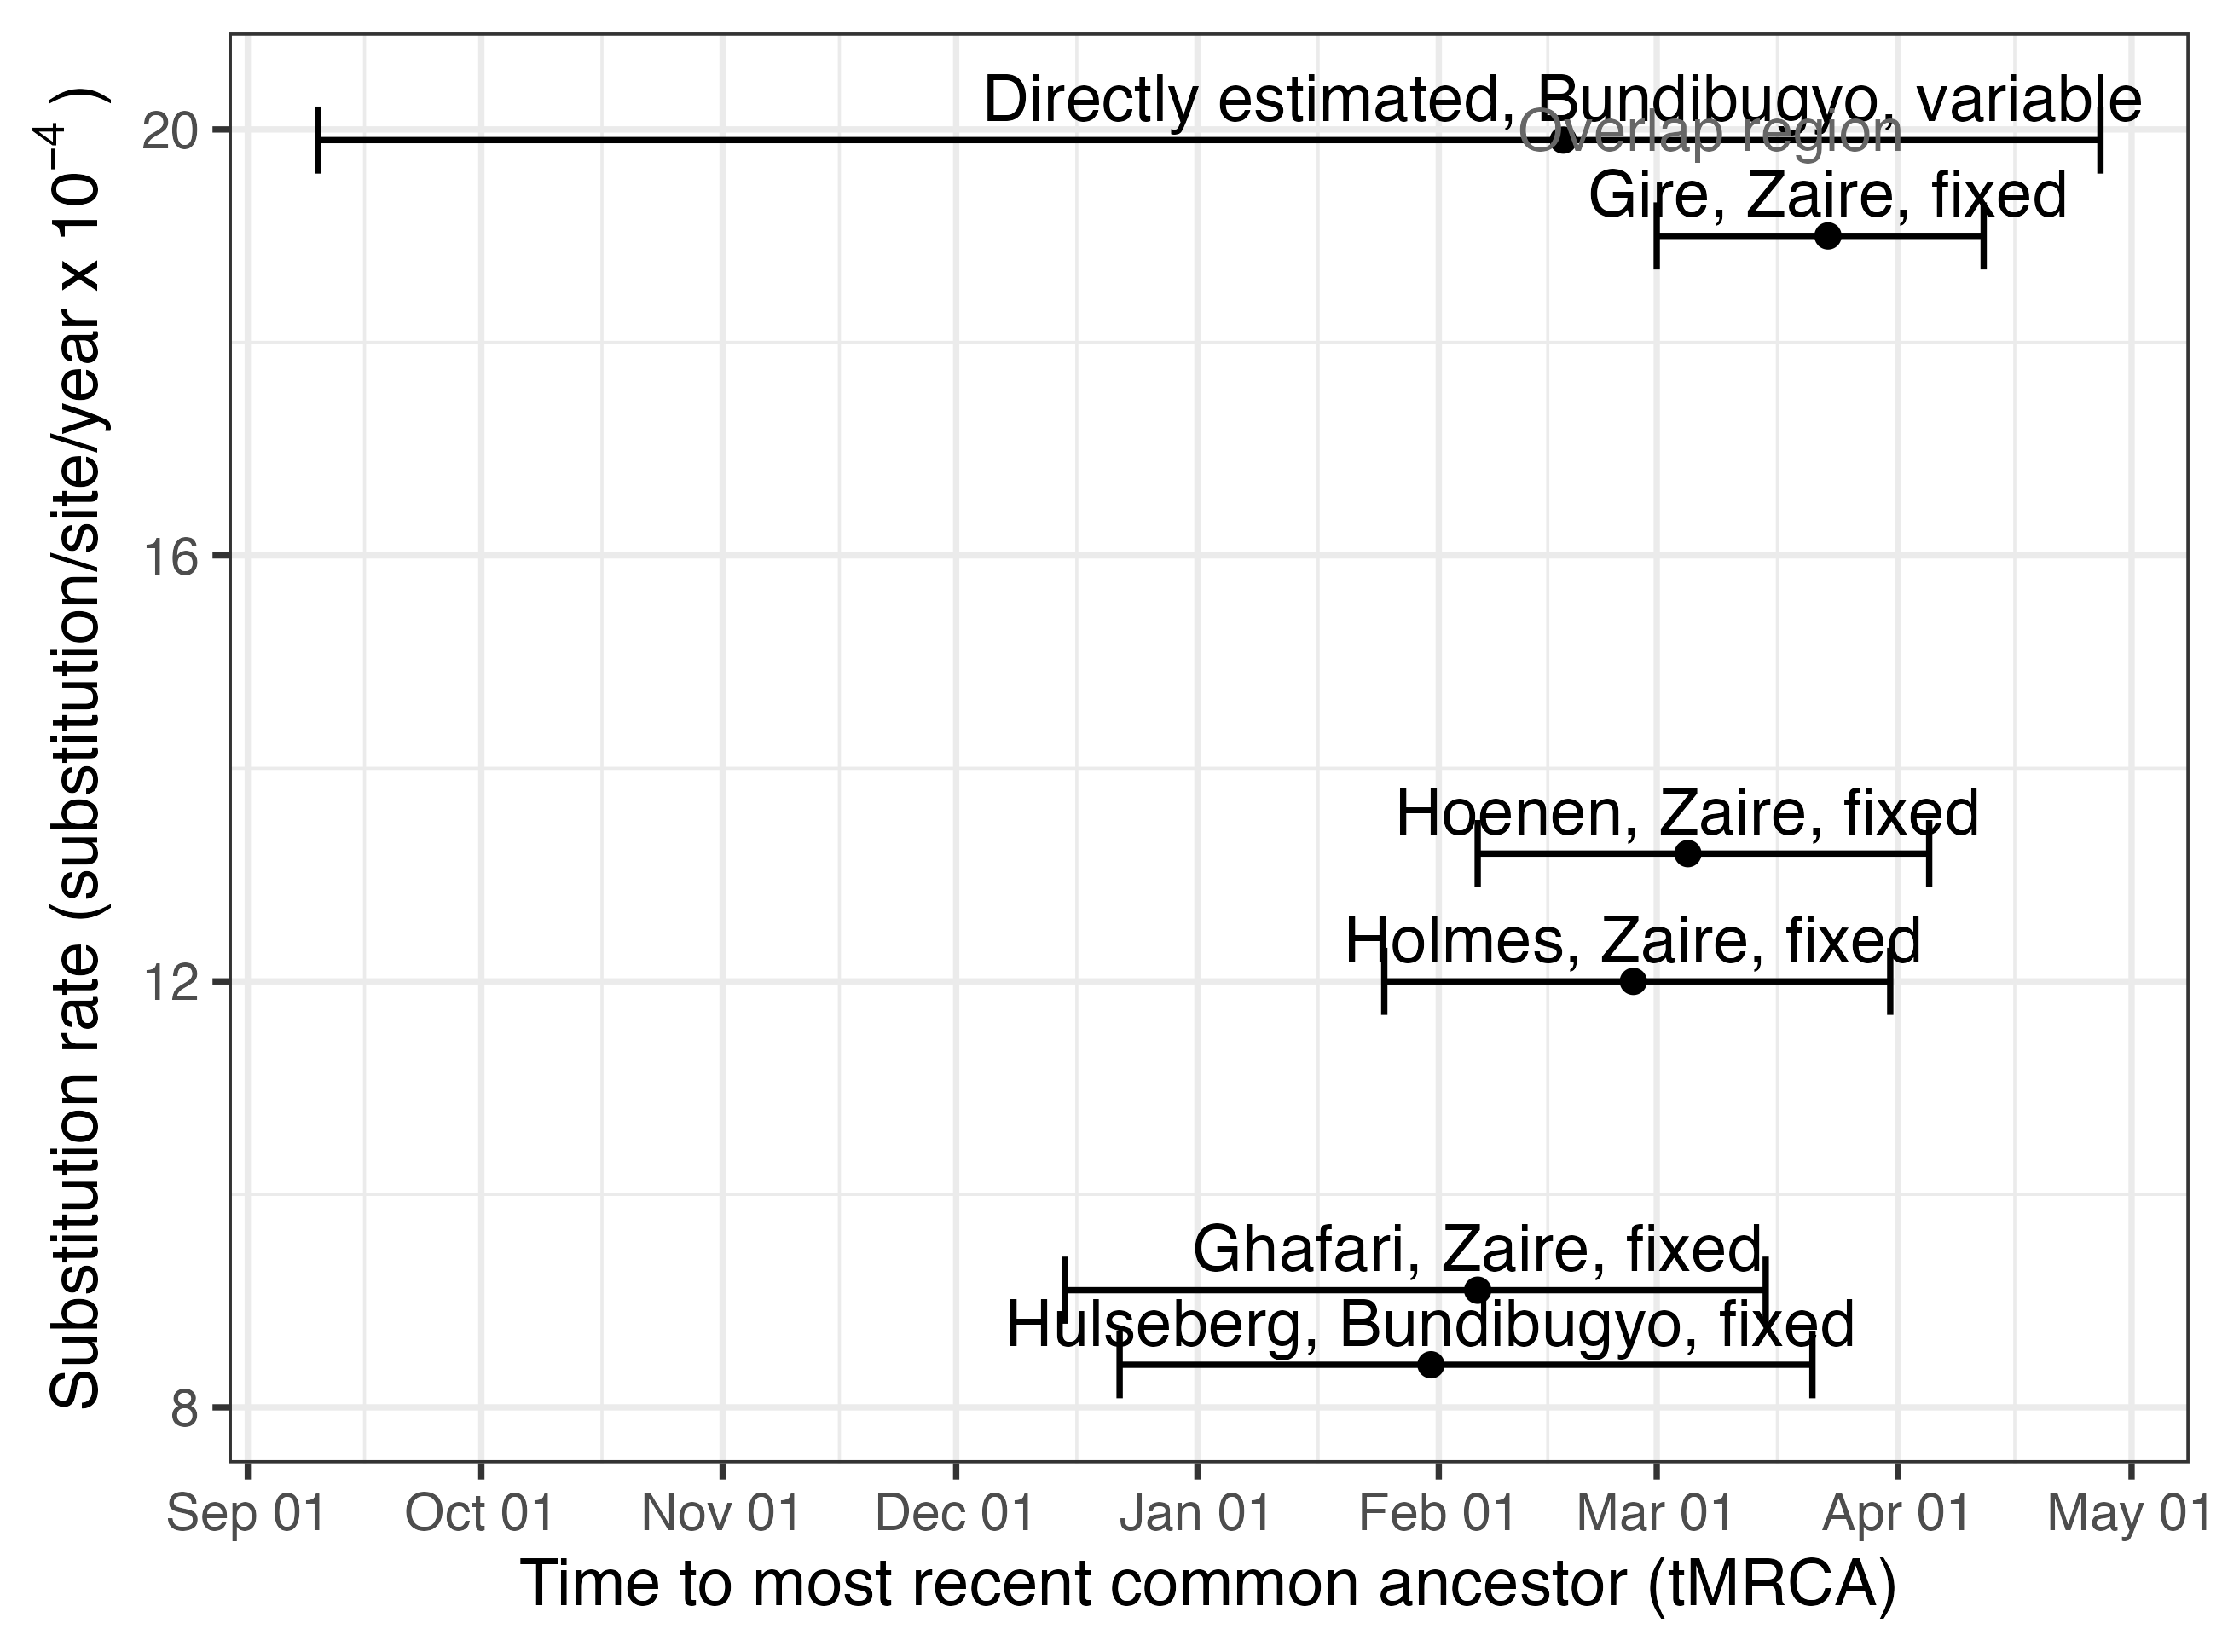
Figure 2 | Posterior estimates of the time to the most recent common ancestor across substitution-rate assumptions. We used Delphy1 to analyse the ten outbreak-associated sequences under an exponential-growth coalescent model. Five analyses used fixed substitution rates from previous Ebola virus studies, while one analysis estimated the substitution rate directly from the outbreak sequences. Points show the posterior mean tMRCA, and error bars show the 95% highest posterior density (HPD) interval. The uncertainty in the top estimate reflects the additional uncertainty introduced by jointly estimating the substitution rate from the same set of outbreak sequences.
A full list of all mutations and their corresponding amino-acid changes, including the sequences in which they occur, is available here: mutation_bdbv.csv.zip (1.5 KB)
Bibliography
-
Varilly P, Schifferli M, Yang K, et al. Delphy: scalable, near-real-time Bayesian phylogenetics for outbreaks. 2025; 2025.03.25.645253.
-
Hulseberg CE, Kumar R, Di Paola N, et al. Molecular analysis of the 2012 Bundibugyo virus disease outbreak. Cell Reports Medicine 2021; 2: 100351.
-
Gire SK, Goba A, Andersen KG, et al. Genomic surveillance elucidates Ebola virus origin and transmission during the 2014 outbreak. Science 2014; 345: 1369–1372.
-
Erratum for the Report “Mutation rate and genotype variation of Ebola virus from Mali case sequences” by T. Hoenen, D. Safronetz, A. Groseth, K. R. Wollenberg, O. A. Koita, B. Diarra, I. S. Fall, F. C. Haidara, F. Diallo, M. Sanogo, Y. S. Sarro, A. Kone, A. C. G. Togo, A. Traore, M. Kodio, A. Dosseh, K. Rosenke, E. de Wit, F. Feldmann, H. Ebihara, V. J. Munster, K. C. Zoon, H. Feldmann, S. Sow. Science 2015; 348: aac5674.
-
Hoenen T, Safronetz D, Groseth A, et al. Mutation rate and genotype variation of Ebola virus from Mali case sequences. Science 2015; 348: 117–119.
-
Holmes EC, Dudas G, Rambaut A, Andersen KG. The evolution of Ebola virus: insights from the 2013–2016 epidemic. Nature 2016; 538: 193–200.
-
Nash RK, Bhatia S, Morgenstern C, et al. Ebola virus disease mathematical models and epidemiological parameters: a systematic review. Lancet Infectious Diseases 2024; 24: e762–e773.
-
Naidoo T, Nash R, Morgenstern C, et al. epireview: Tools to update and summarise the latest pathogen data from the Pathogen Epidemiology Review Group (PERG). 2025. GitHub - mrc-ide/epireview · GitHub.
-
Choi B, Busch S, Kazadi D, et al. Modeling outbreak data: analysis of a 2012 Ebola virus disease epidemic in DRC. BIOMATH 2019; 8: ID: 1910037.
-
Wamala JF, Lukwago L, Malimbo M, et al. Ebola hemorrhagic fever associated with novel virus strain, Uganda, 2007–2008. Emerging Infectious Diseases 2010; 16: 1087–1092.
-
World Health Organization. Disease Outbreak News: Bundibugyo Virus Disease, Democratic Republic of the Congo and Uganda. 2026. Ebola disease caused by Bundibugyo virus, Democratic Republic of the Congo & Uganda.
-
World Health Organization, African Region. Bundibugyo Virus Disease Outbreak; Weekly External Situational Report 01. 2026. https://iris.who.int/server/api/core/bitstreams/b6e1e783-91c3-43c8-ab90-16ceaa9948f0/content.
-
World Health Organization, African Region. Bundibugyo Virus Disease Outbreak; Weekly External Situational Report 02. 2026. DSpace.
-
McCabe R, Ebbarnezh L, Okware S, et al. Estimation of the size of the Ebola outbreak caused by Bundibugyo virus in the Democratic Republic of the Congo: May 20, 2026 update. Imperial College London, 2026. DOI: https://doi.org/10.25560/13005307.