Introduction and spread of SARS-CoV-2 in the greater Boston area
Massachusetts has been severely impacted by the COVID-19 pandemic, with 101,592 cases and 7,152 deaths as of June 3, 2020. Seventy percent of the state’s 6.9 M population lives in the city of Boston and its surrounding communities. To understand the introduction and spread of SARS-CoV-2 in this region, the Broad Institute, Massachusetts General Hospital, the Massachusetts Department of Public Health and other partners are sequencing viral genomes from COVID-19 cases from the Boston area for genomic epidemiological analyses. In this post, we describe the analysis of the first 331 complete genomes densely sampled from Massachusetts General Hospital, a large tertiary referral hospital, during the first month of the outbreak. The data reveal multiple introductions into the Boston area from international and domestic sources, and characterize early events that shaped the Massachusetts outbreak.
Phylogenetic analysis of SARS-CoV-2 in the greater Boston area
All genomes were obtained from nasopharyngeal swabs from individuals with confirmed SARS-CoV-2 infection who underwent testing at the Massachusetts General Hospital Clinical Microbiology Lab in Boston between March 4th and April 8th, 2020. The dataset incorporates epidemiological data to provide a unique view of the events surrounding local emergence of SARS-CoV-2. These cases represent a non-random sample from a single center whose clinical catchment area primarily includes Boston and surrounding regions in eastern Massachusetts.
We performed unbiased metagenomic short-read sequencing using Illumina technology, followed by reference-guided assembly using the Wuhan-Hu-1 sequence (RefSeq accession: NC_045512) as the reference. We recovered 331 high-quality genomes (>98% complete), and an additional 37 partial genomes (>80% coverage), densely sampling the early epidemic in the Boston area (Figure 1A). Mean assembly coverage was inversely correlated with viral concentration as determined by RT-qPCR (Figure 1B); Spearman’s rho = -0.88, p < 2 x10-16).
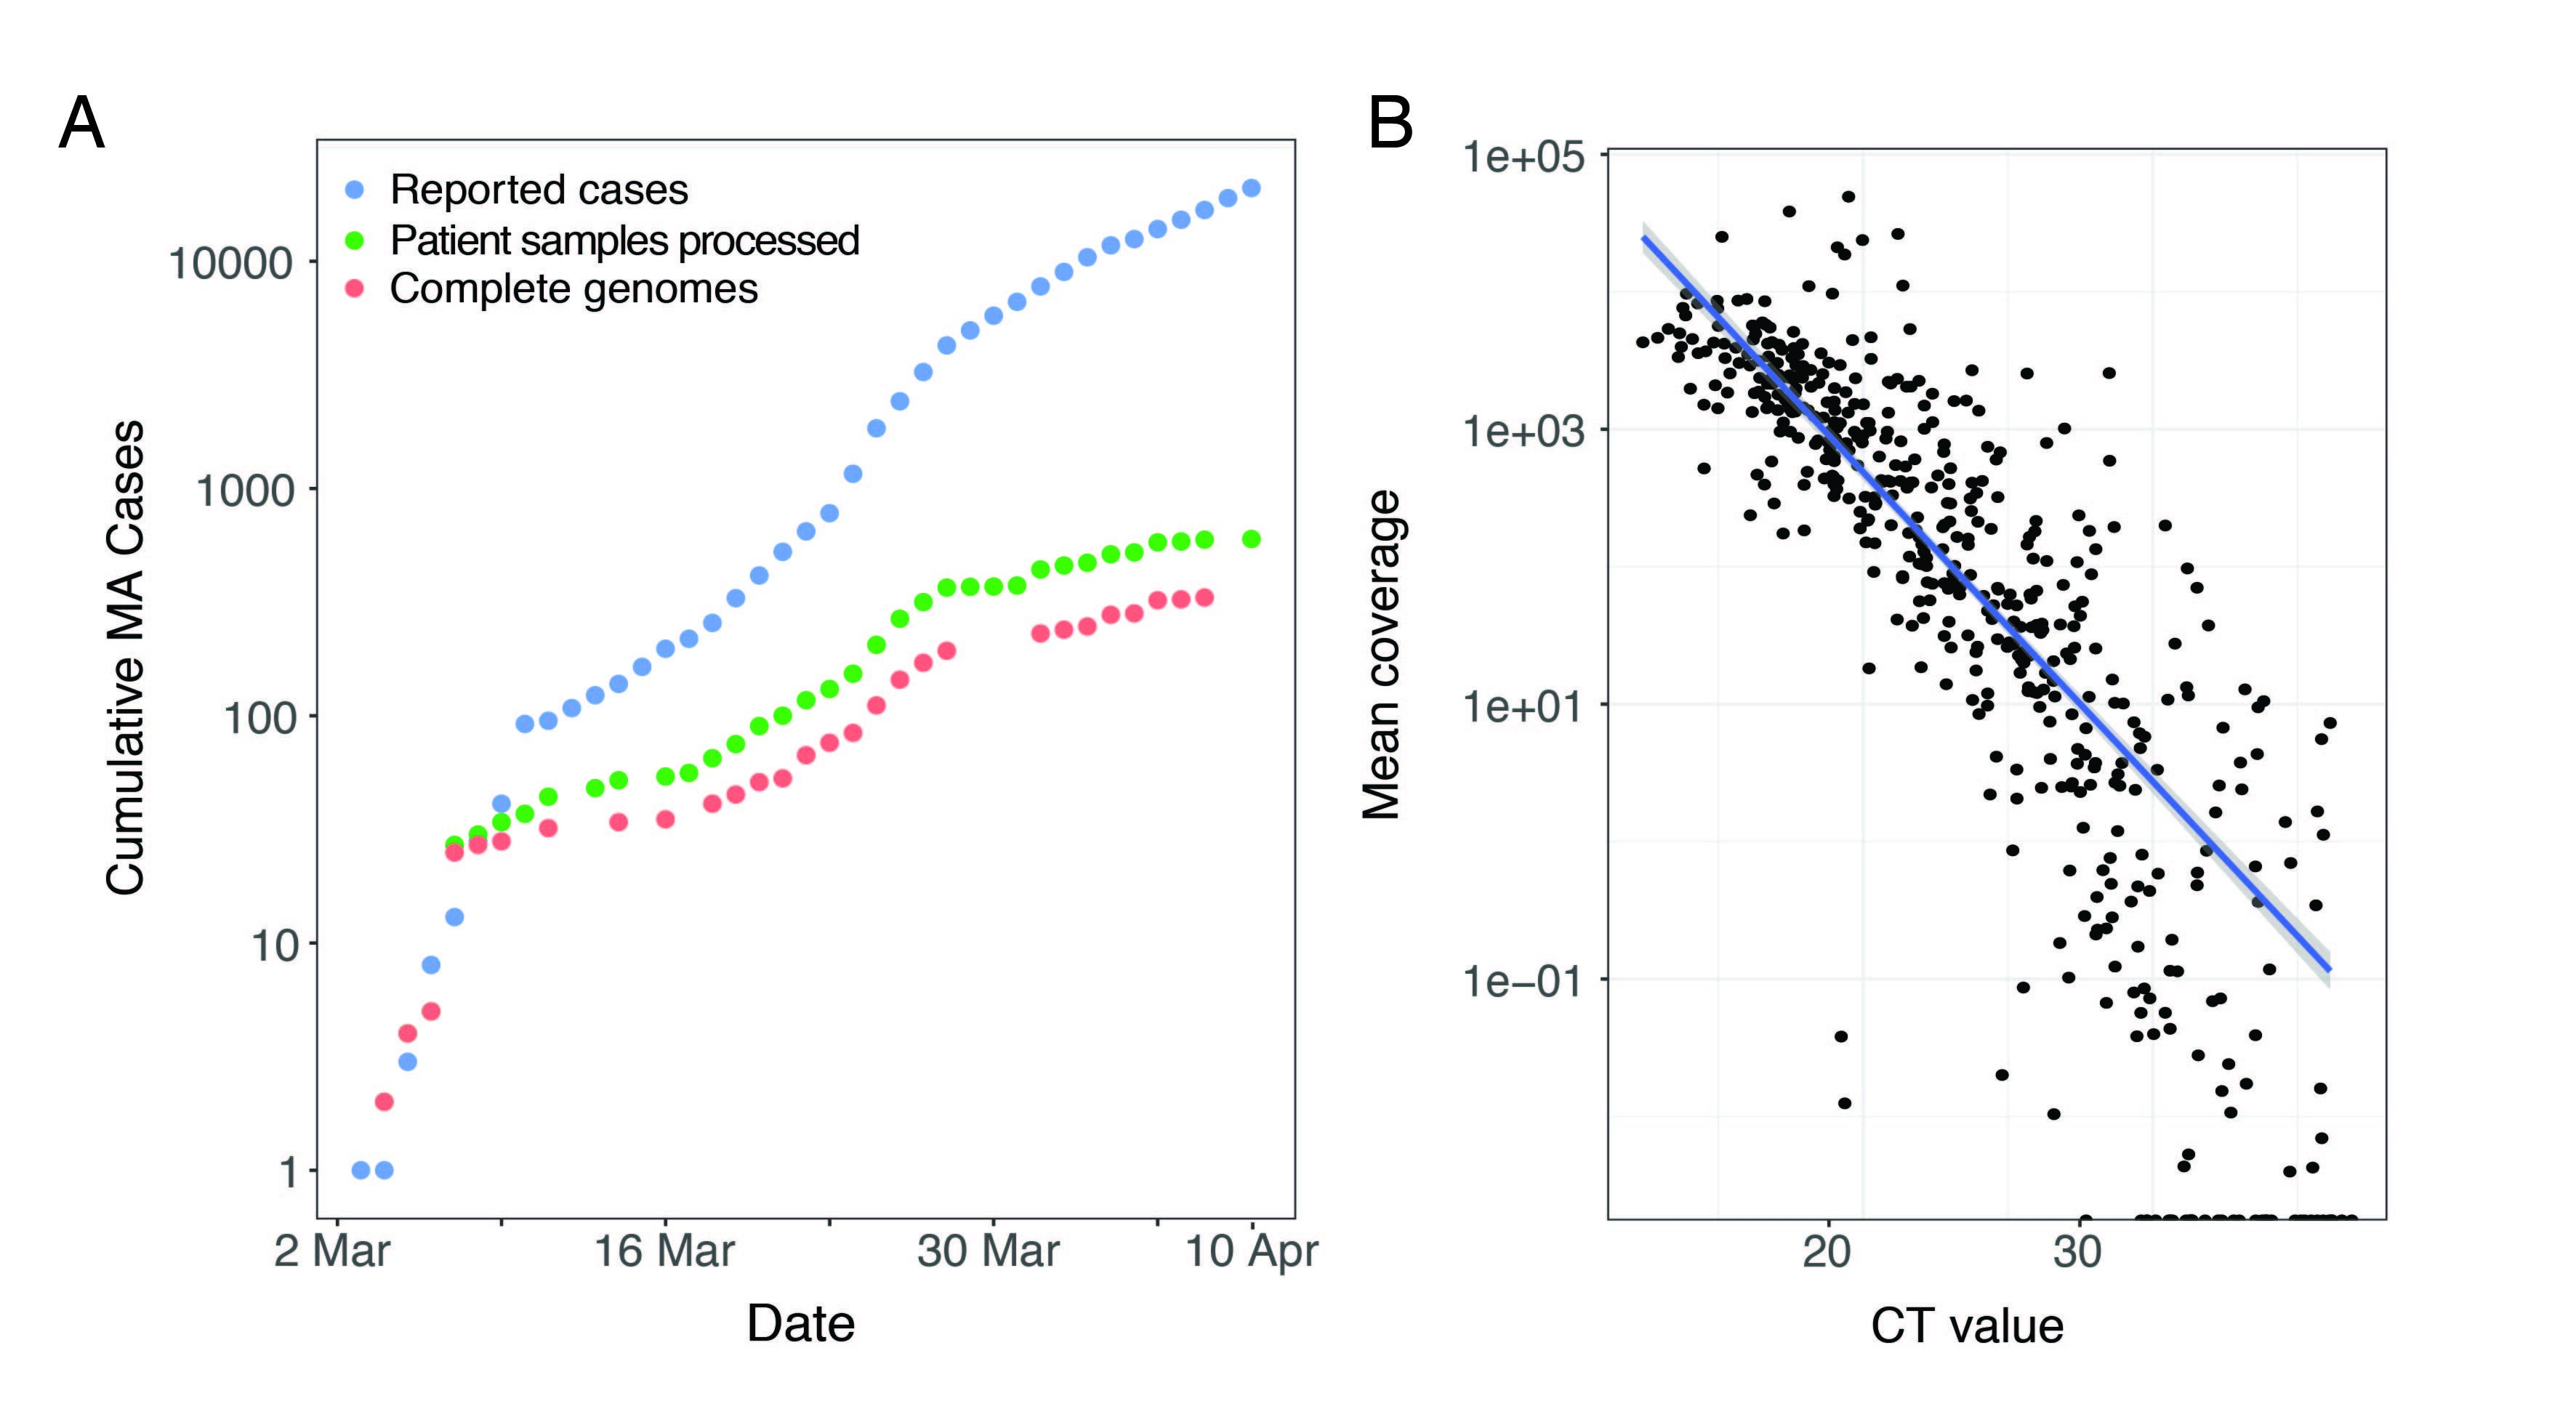
Figure 1. A. Cumulative cases reported state-wide in Massachusetts from March 1 – April 8 2020, and the number of these cases that were processed (green) and successfully yielded complete genomes with >98% coverage (red) in this study. B. Correlation between CT value from RT-qPCR diagnostic test and mean coverage depth of the assembled viral genomes.
We constructed a phylogenetic tree of the 331 complete SARS-CoV-2 genomes in our dataset, in the context of a global set of 9,967 high quality genomes currently hosted by GISAID, randomly subsampled from the 12,972 high-quality genomes available as of May 10 (Figure 2A). SARS-CoV-2 genomes from the Boston area were spread throughout the global tree and included both previously identified major lineages, known as A and B (inferred using PANGOLIN). Over 85% of viruses in our dataset were from the B.1 lineage and its descendents (https://auspice.broadinstitute.org and Figure 2). This viral lineage is widely distributed in dozens of countries, particularly those in Western Europe and North America.
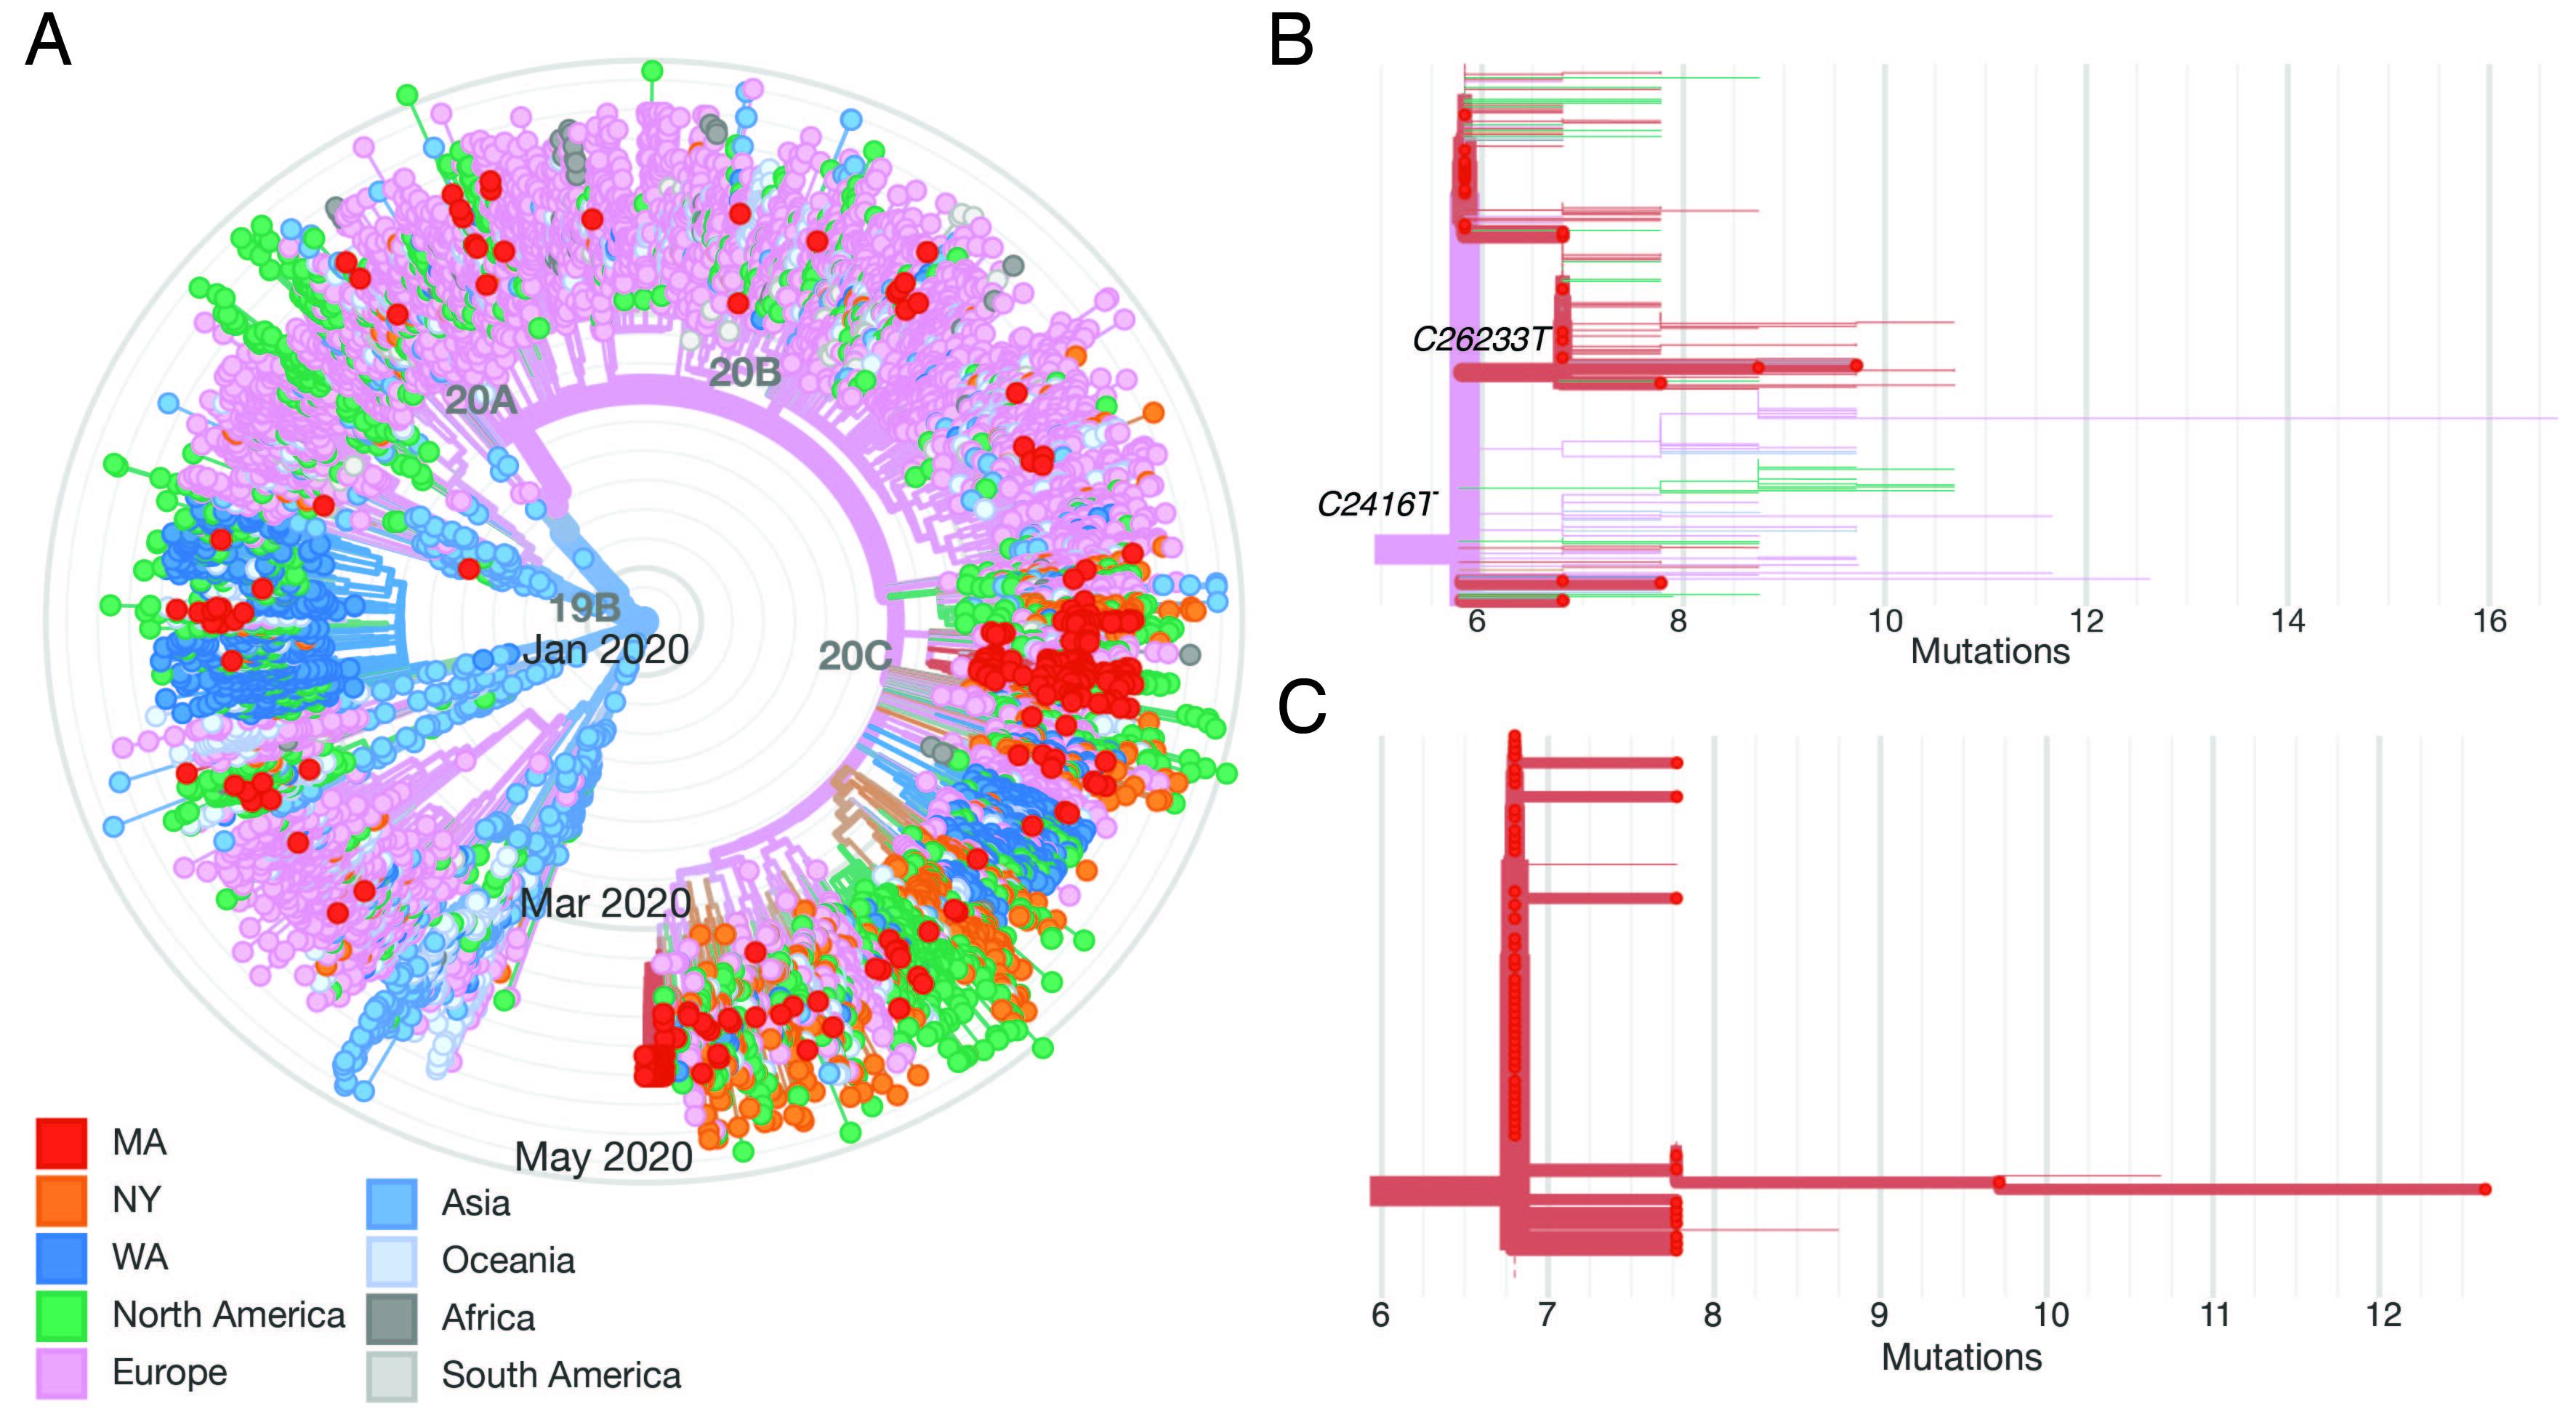
Figure 2. A: radial tree of a global set of 10K genomes hosted on GISAID, with Boston area genomes in red, showing multiple imports. B: Divergence tree of only the conference-associated clade, with C2416T and C26233T nodes labeled. C: Divergence tree of the CLF-associated clade.
It is important to note that the available viral genomic data (whether from GISAID or GenBank) are biased geographically toward regions performing extensive sequencing early in the epidemic. We and others continue to generate data during the pandemic, and we anticipate that the inferences here will evolve as more data become available.
Multiple introductions
Through April 8, we identified at least 30 putative unique introductions to the Boston area, representing sources on four continents (Table 1 and Figure 2A), as well as multiple regional exchanges. Geographic origin was inferred using an ancestral inference model from Timetree as implemented in the Nextstrain Augur pipeline. We consider these as putative introductions since broader sampling, new epidemiological data, and additional analytical methods may refine the inferences. The earliest known introduction to Massachusetts occurred on January 29th with a patient who tested positive for SARS-CoV-2 after developing COVID-19 symptoms upon returning from Wuhan. The patient was quarantined and contact tracing was carried out. SARS-CoV-2 from this infection was sequenced by the CDC and is publicly available (designated ‘MA1’). We observed no direct descendent viruses from this case in the data–through April 8, 2020 for the Boston area (or in the GISAID set of 10,000 through May 15, 2020)–suggesting that efforts to control onward spread were effective. Consistent with this interpretation, no cases were reported in Massachusetts in February; however, testing was restricted to travelers and other high-risk individuals during this period, so infections may have been missed. Planned retrospective surveys of historical nasopharyngeal swabs from undiagnosed cases of suspected respiratory infections are expected to fill in some of these gaps.
Multiple distinct lineages of SARS-CoV-2 were apparent in the Boston area by early March, resulting from introductions that occurred in late February and early March according to maximum-likelihood estimates of time to the most recent common ancestor (tMRCA) (https://auspice.broadinstitute.org/). Introductions continued during March and April. Most international importations came from Europe (Table 1) prior to the introduction of significant international travel restrictions. Domestic imports were also apparent, including multiple from the northeast and western United States. For example, viral genomes sequenced from a congregate living facility (CLF), discussed further below, were a part of a major cluster that appeared to have resulted from regional importation, potentially from New York, based on inferred geographic origin. Accurate inference of domestic exchanges is currently limited by sparse state-level data currently available for many states in public databases. Relatedly, we cannot estimate the relative contribution of international versus domestic importation into the Boston area until additional data is available. We do, however, observe significant similarity between SARS-CoV-2 in our dataset with viruses from the New York City area, which is currently well-represented in public databases, suggesting multiple regional bi- or multi-way interchanges.
We do not find evidence of widespread undetected or “cryptic” transmission of SARS-CoV-2 lineages in Massachusetts prior to the recognized start of the COVID-19 pandemic. Phylogenetic data can suggest cryptic transmission when there is evidence of linked transmission events that cannot be explained by recent importation and whose tMRCA predates the recognized imports. None of the importation events we reviewed in Table 1 clearly met that criteria, although our analysis does not exclude such events. In particular, additional isolated events similar to the MA1 importation may have occurred and escaped detection with the current resolution of sampling.
Superspreading events
Our dataset contains samples from two apparent superspreading events, in which numerous individuals were infected from a single source. The first involves a large international conference which took place in Boston in late February. Several conference participants were subsequently diagnosed with COVID-19 in early March, after which extensive testing was done of individuals associated with the conference and further cases were found. Our dataset contains SARS-CoV-2 genomes from 28 of those individuals. This includes individuals who had direct contact to the conference (e.g. attendees, and hotel staff and guests) as well as their contacts.
Viruses sampled from individuals with exposure to the conference belong to a monophyletic cluster containing the SNP C2416T (Figure 2B and Figure 3A). This lineage had robust phylogenetic support (posterior probability density of 1 in the maximum clade-credibility tree in Figure 3A, consistent with a single point-source for these infections.
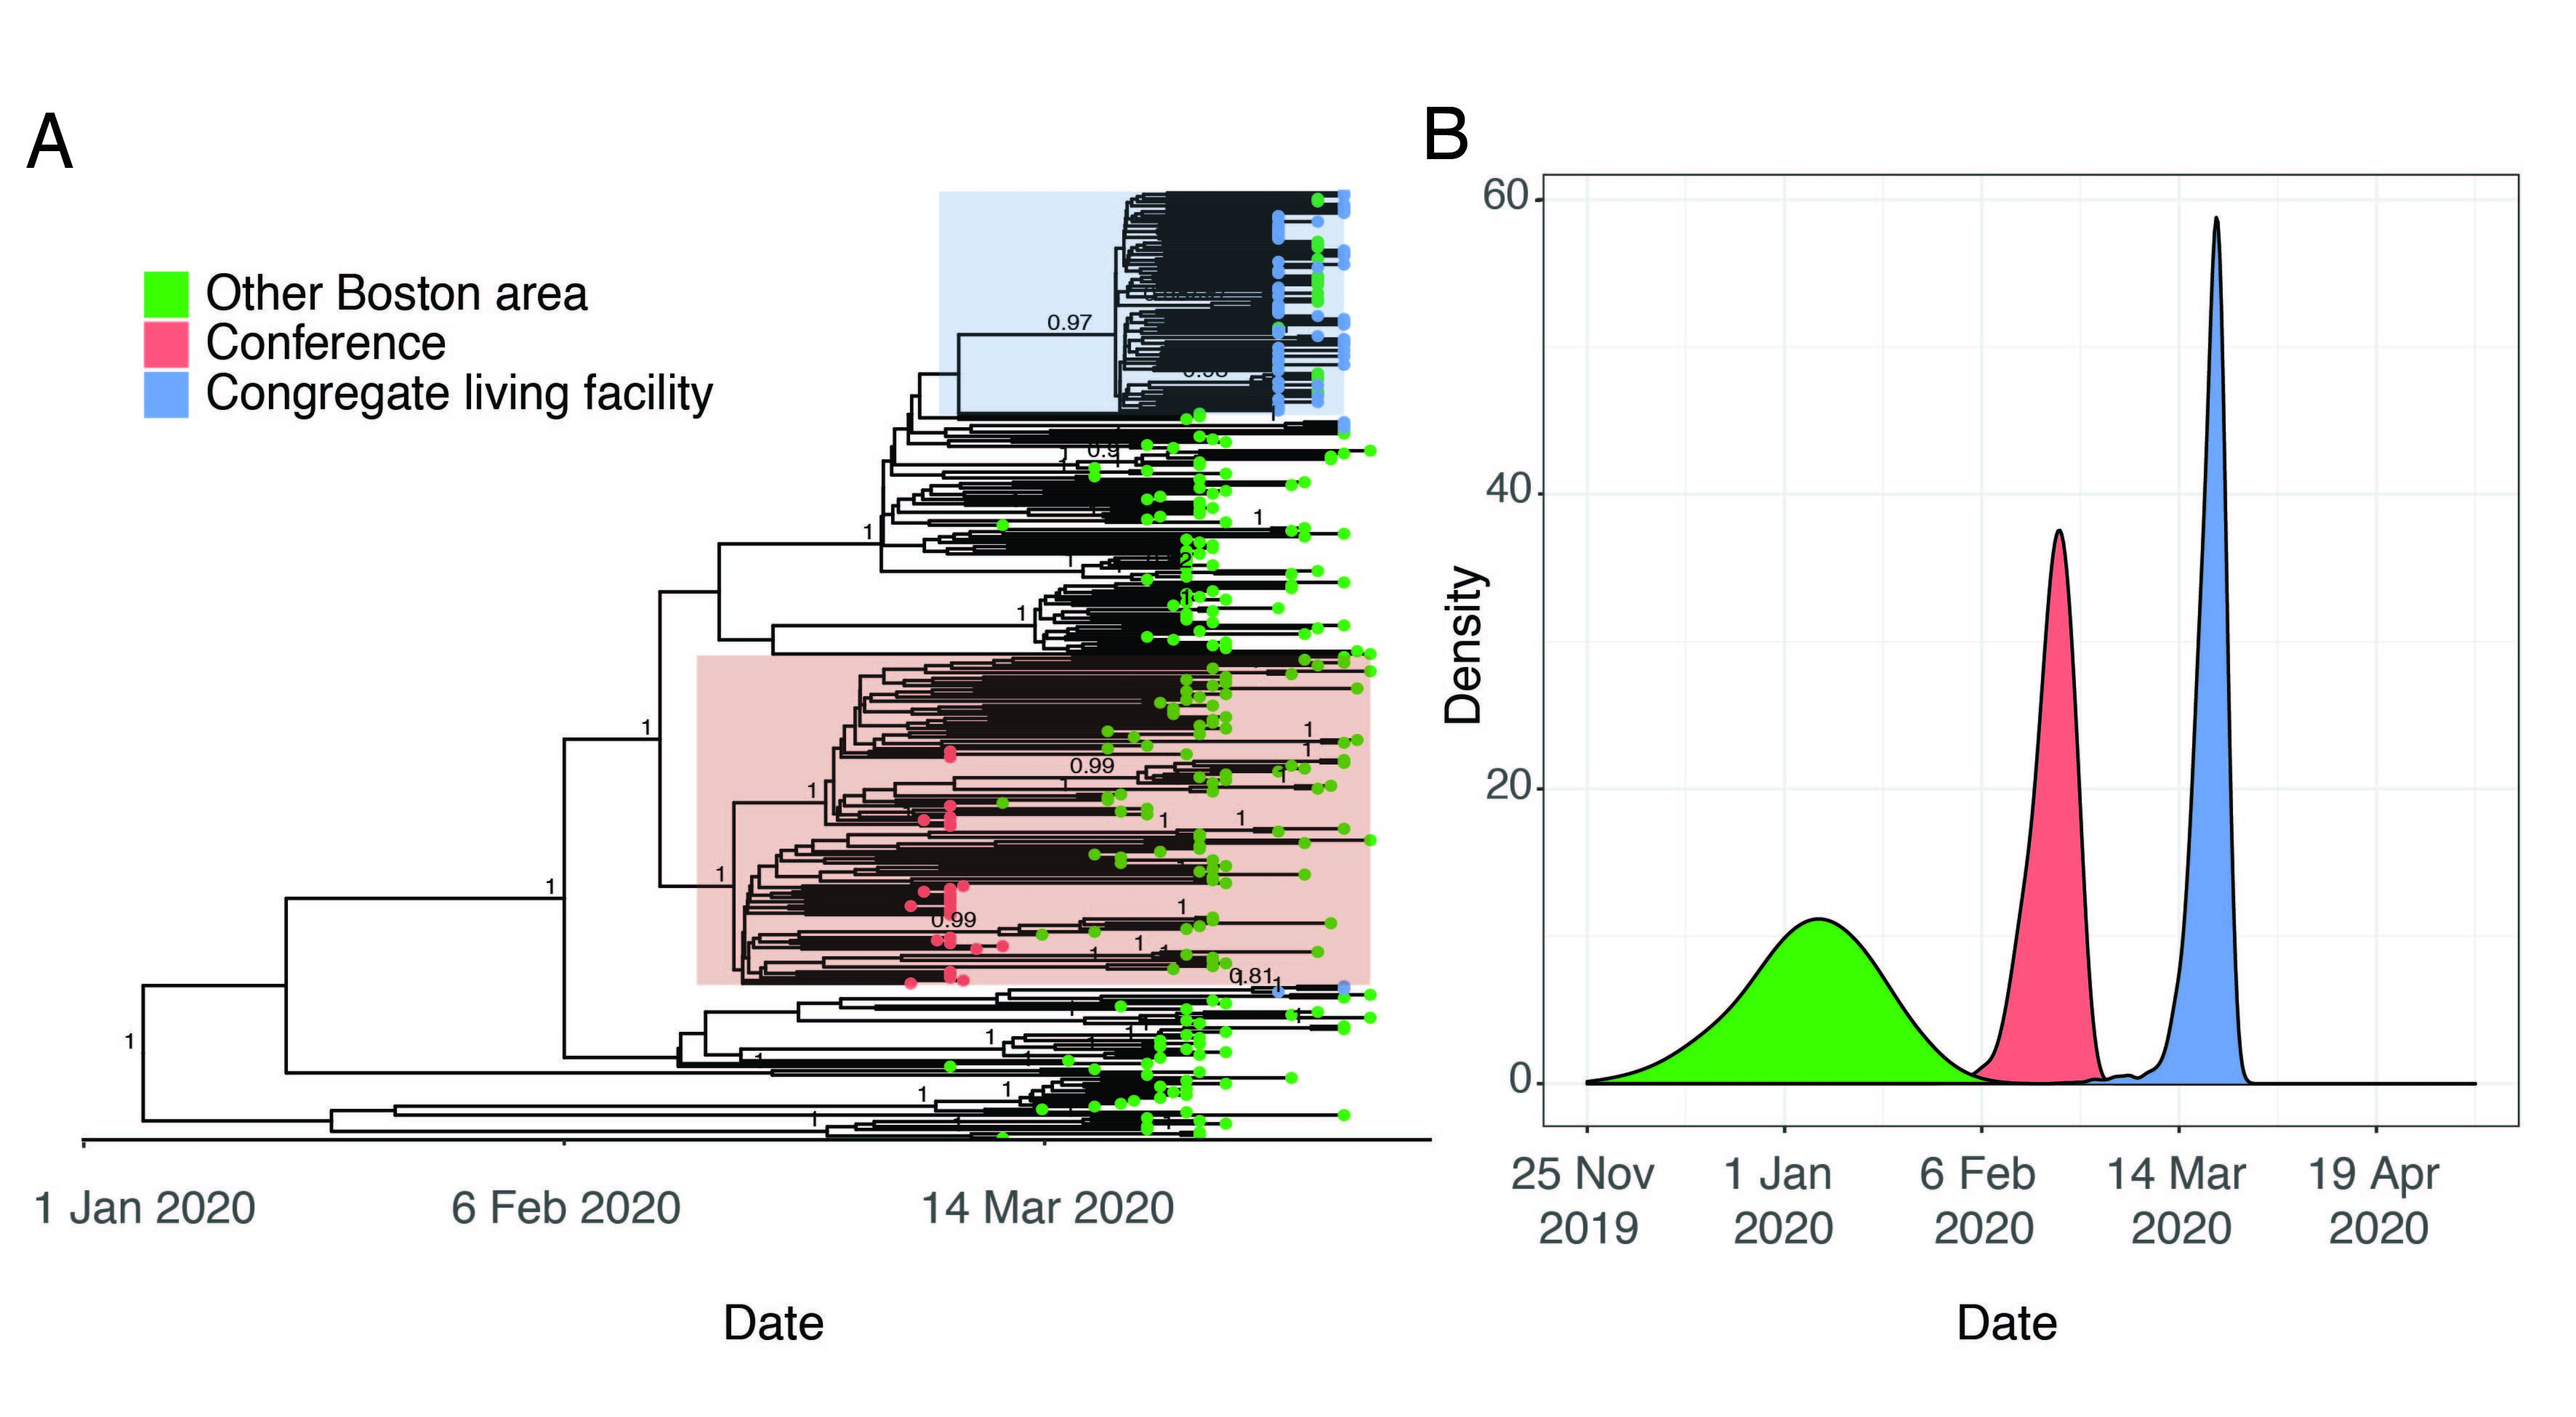
Figure 3. A. Time-measured phylogeny of only the 331 complete genomes reported here. B. Estimated tMRCAs of all Boston area genomes (root), the conference-associated cluster and the congregate living facility-associated cluster.
Although the C2416T mutation is seen in 34.4% (114/331) of genomes in our dataset, it is problematic to generalize this inference to make quantitative estimates about the scale of conference-associated spread for several reasons. First, while all conference-associated samples in our dataset contain C2416T, this does not imply the converse–that all viruses containing C2416T are associated with the conference. Spread may have begun in Europe prior to the start of the conference or involved other sites in Boston such as an airport or train station. The uncertainty about these scenarios is not resolved by timing estimates based on a molecular clock because the estimated tMRCA for this cluster, late February (Figure 3B), is also consistent with a scenario where this mutation occurred shortly before the conference itself. Second, publicity around this event prompted substantial testing among those with exposure to the conference, and case definitions were modified to enable testing of them; as a result, the samples tested during this period were heavily biased toward individuals associated with the conference. Third, there is substantial missing data given sparse sampling from most US states and most countries outside of Western Europe. An additional theoretical concern is that recurrent mutation and convergent evolution may generate the C2416T in viruses that do not share common ancestry, although that is less likely given that we did not observe mutations at C2416T in other lineages.
It is possible to draw firmer but more limited conclusions by examining nodes that are defined by conference attendees. For example, a second SNP, C26233T, occurs on the C2416T background and was first observed in individuals with known exposure to the conference, strongly suggesting it occurred during the conference (although we can’t rule out the possibility that these individuals shared an exposure in a different setting after the conference, such as their workplace). The C2416T/C26233T-defined lineage resulted in community transmission in the Boston area and was exported to several US states including Virginia, North Carolina, and Texas, and to other countries, including Australia and Slovakia. Based on the current dataset there is evidence for sustained transmission of the C2416T/C26233T lineage in Virginia and Australia, given multiple virus samples containing these SNPs reported from those sites. In summary, we can infer with confidence that conference-associated lineages resulted in ongoing transmission in the Boston area, the United States, and abroad, but we cannot currently accurately estimate the proportion of individuals affected by this locally or globally.
We also investigated a cluster of cases involving residents and staff of a CLF. Residents in this facility were tested over a five-day period in early April as a precaution because of a planned relocation; despite an apparent absence of initial symptoms, 82/97 residents (85%) and 36/97 (37%) of the staff tested positive by PCR. We sequenced 63 SARS-CoV-2 genomes from individuals associated with the nursing facility. Of these, 57 (90%) comprised a single cluster of nearly-identical genomes, all containing a single G3892T SNP (posterior support of 0.97 in maximum clade credibility tree in Figure 3A). The phylogenetic structure of these genomes implies a recent introduction into the facility from a single predominant source (Figure 3A). Given the strong association of viruses in this lineage with the nursing facility, this clade seems directly attributable to spread within the facility.
This cluster contained 77 viral genomes harboring the G3892T mutation, 57 of which are known to be linked to the nursing facility, and all of which were from the Boston area. Of the 77 samples in this lineage, 57 are identical sequences and the remaining 20 contained one or more additional mutations derived on the G3892T background. This introduction probably occurred during a narrow time window, suggesting that the testing occurred during the early presymptomatic period that occurred contemporaneously among patients. The median tMRCA for these sequences was March 20 (Figure 3B, 95% HPD: March 13 - March 24 2020), a time period in which there was less awareness of the risk of transmission from asymptomatic individuals.
In addition to the major cluster, two additional introductions, each containing three genomes, could also be seen among the patients and staff in this facility. There was strong phylogenetic support for each of these separate introductions (posterior support of 1 in Figure 3A for each cluster of three samples). The observation that one introduction led to massive spread, while the other two did not, is consistent with the hypothesis that some viral introductions result in superspreading while others do not. Although one clade predominated within this CLF, the occurrence of three independent introductions underscores the high risk of introduction for a single facility and is consistent with the large number of congregate living environments with significant outbreaks. The current study design cannot resolve (1) whether the dominant viral clone was amplified by a single individual or through several early intermediate spreaders or (2) define the route of transmission (e.g. airborne transmission of suspected aerosols or contact with contaminated surfaces), highlighting the need for additional investigation that includes merging viral genomic data and conventional epidemiology.
In this case, viral genomic data helped provide clarity about events that would have been difficult to achieve in other ways, including the number and timing of introductions, and the pace of spread. The findings from this facility illustrate how quickly transmission can accelerate in a congregate setting and also highlight a critical need to understand mechanisms of transmission and clonal amplification in order to protect vulnerable populations and the broader public during the COVID-19 pandemic.
Conclusions:
SARS-CoV-2 genome sequences from the earliest known COVID-19 cases in the Boston area elucidate the key events surrounding the initiation of the local epidemic. Integrating SARS-CoV-2 genomic data with genomes from early cases tested at Massachusetts General Hospital suggests that SARS-CoV-2 was introduced into the Boston area by recurrent imports from international and domestic sources and amplified through community transmission that included superspreading events. Although generalizable inference remains a challenge with this data type due to sampling biases and sparse data, combining viral genomic sequences with detailed epidemiological data can provide unique insight into the events leading to epidemic initiation and propagation. Widespread sequencing of SARS-CoV-2 is likely to contribute to contact tracing and other mitigation strategies and seems poised to play an increasingly important role in this and future outbreaks.
Brief Methods:
Nasopharyngeal swabs from COVID-19 patients who underwent testing at Massachusetts General Hospital were placed in universal transport medium (UTM) and frozen. We extracted RNA from 200 uL of UTM using the MagMAX mirVana kit on a KingFisher Flex, depleted 18S rRNA using RNAse H, constructed sequencing libraries using Nextera XT kits (Illumina), and sequenced the resulting libraries on HiSeq and NextSeq instruments (Illumina). We assembled genomes using viral-ngs 2.0.21. We constructed nextstrain trees using the Augur pipeline (www.nextstrain.org), with site-masking procedures used by nextstrain.org, setting the clock rate to 0.0008 +/- 0.0004 and rooting the tree using the reference genome, Wuhan-Hu-1. Putative introductions were defined as Massachusetts branches on the tree separated by >2 SNPs, except for clades defined by C1059T, C2416T, and C18877T, where >= 2 SNPs was used to distinguish imports from these phylogenetically distinct but closely-related clades. To construct Bayesian time-trees, we aligned the set of 331 genomes using MAFFT v7.467, trimmed 5’ and 3’ (first 265 and last 228 bases) UTRs from the alignment, and used BEAST 2.6.2 with a gamma site model, JC69 substitution model, a strict clock, coalescent exponential tree prior, a uniform [-inf, inf] prior for the clock rate, a 1/x [-inf, inf] prior for the coalescent effective population size; and a laplace [-inf, inf] prior for the growth rate. We used TreeAnnotator v2.6.2 to construct maximum clade credibility trees with a burnin percentage of 10%.
Data and Methods Accessibility
Both data and analyses are publicly available in the Broad Institute’s Terra platform, a secure, open source cloud environment for storing, analyzing and sharing genomic and other biomedical data. The Broad’s Data Science Platform and Viral Genomics group have been working closely to adapt Terra for viral genomic data, to support and accelerate the use of this information by public health researchers and practitioners around the world to respond to COVID-19 and future public health emergencies. The data and analysis workflows used here can be found in a Terra featured workspace for COVID-19—this is described in more detail in this article. Researchers can use this workspace to reproduce analyses described here or perform similar analyses on their own viral sequence data. Assembled genomes and raw metagenomic reads from this data set have been deposited at NCBI’s Genbank and SRA databases under BioProject PRJNA622837 in accordance with NIAID’s Data Sharing policy and will soon be available to visualize on nextstrain.org/ncov. This study was approved by the Partners Institutional Review Board under protocol 2019P003305.
Authors:
*Project team and contributors includes, from MGH: Melis Anahtar, John Branda, Regina LaRocque, Jacob Lemieux,Virginia Pierce, Eric Rosenberg, Ed Ryan, Bennett Shaw, Damien Slater, Sarah Turbett; MA Department of Public Health: Catherine Brown,Timelia Fink,Glen Gallagher,Larry Madoff,Sandra Smole; Broad Data Sciences Platform: Sushma Chaluvadi, Christine Loreth, Anthony Philippakis, DSP Field Engineering Team; Broad’s Stanley Center: Felecia Cerrato, Sinéad Chapman, Caroline Cusick, Katelyn Flowers, Anna Neumann; Broad’s Office of Research Subject Protection: Stacey Donnelly, Andrea Saltzman, Susie Weisenburger; Other helpful colleagues: Maha Fahrat (HMS), William Hanage (HSPH), Tami Lierberman (MIT), Tammy Mason, Angela Page, Aviv Regev; Sabeti Lab Viral Genomics Group: Gordon Adams, Matt Bauer, Amber Carter, Kat Deruff, Katherine Figueroa, Adrianne Gladden-Young, Andreas Gnirke, Alan Guttierez, Molly Kemball, Lydia Krasilnikova, Allison Krunnfusz, Kim Lagerborg, Aaron Lin, Bronwyn MacInnis, Hayden Metsky, Erica Normandin, Danny Park, Steve Reilly, Melissa Rudy, Pardis Sabeti, Stephen Schaffner, Katherine Siddle, Chris Tomkins-Tinch
contact:
[email protected]
[email protected] @kjsiddle
[email protected] @dannyjpark
[email protected] @sabeti_lab
[email protected] @bronwynmacinnis
Acknowledgements
We gratefully acknowledge the authors and contributors who have submitted genomes to Genbank and GISAID. An acknowledgement table for GISAID sequences is attached to this postgisaid_hcov-19_acknowledgement_table_2020_06_03_21.xls.zip (762.5 KB) . This work was sponsored by the National Institute of Allergy and Infectious Diseases (U19AI110818; Broad Institute), the Centers for Disease Control and Prevention (U01CK000490; MGH), the Bill and Melinda Gates Foundation (Broad Institute), with in-kind support from Illumina, Inc. as well as support from the Doris Duke Charitable Foundation (Jacob Lemieux.), and the Howard Hughes Medical Institute (Pardis Sabeti).
| Index Taxon | Genetic Background | Putative Ancestral Origin of Lineage |
|---|---|---|
| MA_MGH_00209 | C9223T | Europe |
| MA_MGH_00569 | G2144T | Europe |
| MA_MGH_00563 | C6040T, G12478A, C28896G | North America |
| MA_MGH_00174 | A4892G, C6354T, G28881A | North America |
| MA_MGH_00145 | C5784T, G9116A, C15613T, C27999T | Australia |
| MA_MGH_00566 | A10317G, T13180C, C16084T | North America |
| MA_MGH_00555 | G18106T, C28697T, G29440A | North America |
| MA_MGH_00004 | G19684T | Australia |
| MA_MGH_00696 | C1063T, G1658A, C5758T, G22708T, C24748T | Europe |
| MA_MGH_00676 | A24694T | North America |
| MA_MGH_00517 | C17747T | North America |
| MA1 (CDC) | C24034T | China |
| MA_1355 (CDC) | T17247C | Europe/North America |
| MA_MGH_00298 | C4423T, C10207T, A12004G, C29774T | Europe |
| MA_MGH_00075 | C23271T, G25978A | Europe |
| MA_MGH_00433 | C14408T | Europe |
| MA_MGH_00059 | C958T | Europe |
| MA_MGH_00048 | C21058T | Europe |
| MA_MGH_00615 | C313T, G1001A, C21005T | Europe/Austalia |
| MA_MGH_00076 | C25916T, C29769T | Americas |
| MA_MGH_00718 | C5298T, C6384T, C8730A, C9891T, C27297T, C28708T | Europe |
| MA_MGH_00023 | C18877T | Europe |
| MA_MGH_00438 | C2416T | Europe |
| MA_MGH_00177 | G16068A, C19164T, T22078C | Europe |
| MA_MGH_00164 | T20769C, G26104A, G28857T | Europe |
| MA_MGH_00084 | T18519C, C19220T | Europe/North America |
| MA_MGH_00532 | G21604T | North America |
| MA_MGH_00663 | T26102C | Europe |
| MA_MGH_00604 | C16887T | North America |
| MA_MGH_00183 | T2884C, G11083T, G11534A | North America |
| MA_MGH_00150 | A12103G, A24069C | North America |
| MA_MGH_00250 | C84T, C25701T, C28960T | Europe |
| MA_MGH_00006 | C1059T | Europe |
Table 1. Provisional classification of putative importation events. These are draft classifications and putative importation events are subject to change.