Summary: Using local and travel-associated case reporting from American and European public health systems, we identified an unreported Zika outbreak in Cuba during 2017. Virus sequencing from travelers revealed that the Zika outbreak in Cuba was sparked by multiple introductions of the virus from elsewhere in the Caribbean and Central America during 2016 that persisted into 2017.
The recent Zika virus epidemic strained our public health systems due to its surprising severity and scale. It also revealed weaknesses in our surveillance networks as it circulated for more than a year in the Americas without detection. These weaknesses, some due to overlapping symptomology with other viruses and a lack of easy and inexpensive diagnostics, are also impeding our ability to determine the true scale of the epidemic, and importantly, when the epidemic can be declared over. Accurate and standardized reporting is key to fully understanding the burden of the Zika epidemic.
There are two primary ways in which active Zika virus transmission is reported. 1) Local reporting by countries engaging in clinical Zika virus surveillance (usually suspected and confirmed cases), in which the data is submitted to the Pan American Health Organization (PAHO) for open dissemination. These data provide the most comprehensive picture of local transmission, but due to large discrepancies in public health capabilities and reporting structures, comparing Zika incidence rates among different countries and territories will be skewed by several local biases. 2) Imported, or travel, infections are also reported by several agencies in regions with high travel volumes to regions with active Zika transmission, like the Florida Department of Health (DOH), US Centers for Disease Control and Prevention (CDC), and the European CDC (ECDC). The advantage of using imported cases detected through sentinel surveillance is that they can be utilized to understand outbreak dynamics in regions without local reporting.
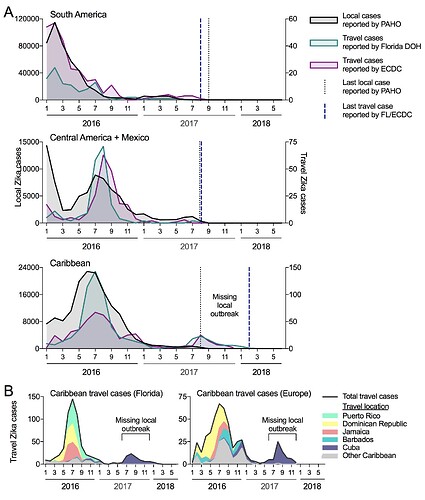
We compared the temporal distribution of reported local and travel Zika cases to see if the trends overlap and if the travel cases are revealing evidence for transmission not captured locally (Figure 1A). We obtained local cases from individual countries and territories provided on the PAHO website (we converted bar graphs to spreadsheet: data here). We worked directly with the Florida DOH to obtain monthly travel cases (based on symptoms onset) by country of origin (data here), and requested similar data from the ECDC. The last local cases reported by PAHO from South America, Central America (+ Mexico), and the Caribbean were during August of 2017. For South America and Central America (+ Mexico), this also corresponded with the last travel cases from individuals visiting those regions, suggesting that the epidemic ended in 2017. For the Caribbean, however, travel cases were reported until February of 2018 and revealed a sudden spike in cases in the summer of 2017 (not captured by the local PAHO data). When we further sorted the Florida DOH and ECDC travel cases by the country of origin, we found that almost all of the Zika positive travelers recently visited Cuba (Figure 1B), suggesting that there was a local outbreak that went undetected.
Figure 1. Travel cases reveal missing Zika virus outbreak in Cuba during 2017. (A) Local Zika cases reported to PAHO (left axis) and travel cases reported by the Florida DOH and the ECDC (right axis) were sorted by region. The ECDC data only extends to the end of 2017, while the Florida DOH data extends to June of 2018. (B) The Caribbean Zika travel reported by the Florida DOH and ECDC were sorted by the five most common and “other” origins.
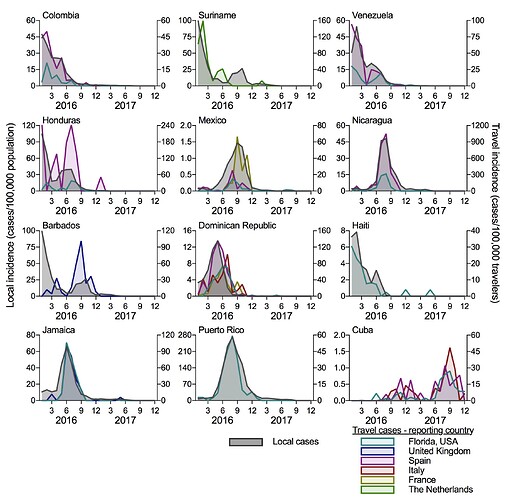
To determine if travel cases can accurately reconstruct local Zika virus transmission, we compared the local incidence rates (local cases/100,000 population, from PAHO data) to travel incidence rates (travel cases/100,000 travelers per month) for each country of origin (Figure 2). We separated the ECDC travel data by the reporting country (United Kingdom, Spain, Italy, France, and The Netherlands) and show data for each origin-destination pair with at least 20 reported travel cases. We obtained air passenger travel volumes from the US Department of Transportation and the International Air Transport Association to calculate the travel incidence rates. For each country reporting local cases (all shown in Figure 2, except for Cuba), the travel incidence rates strongly correlate with local incidence (mean Spearman r = 0.747 [range = 0.577-0.884]). This suggests that surveillance of international travelers for infectious disease can be used when local disease reporting is not available. Importantly for this exercise, it also suggests that Cuba experienced a small Zika outbreak in 2016 followed by a large outbreak in 2017. By comparing the travel incidence rates to other countries, the 2017 Zika outbreak in Cuba appears to be as large as what was reported in 2016 for other Caribbean Islands, like the Dominican Republic, Jamaica, and Puerto Rico. If this is correct, based on the surrounding local standards, we could have expected 10,000 to 40,000 cases reported from Cuba during 2016-2017; the actual number of cases reported from Cuba were 187 in 2016 and none in 2017. We are actively developing a model to estimate the temporal distribution of cases that should have been reported and would love feedback on best methods to use, as well as ideas how best to tackle such questions.
Figure 2. Travel Zika incidence is correlated with the reported local incidence when data is available. The travel Zika cases were sorted by country/territory of origin and for the ECDC data, the reporting European country. Travel data is shown for all origin-destination combinations with at least 20 Zika cases. The local and travel incidence rates were correlated (mean Spearman r = 0.747; range = 0.577 [Mexico-Florida travel] - 0.884 [Puerto Rico-Florida travel]), except for Cuba that did not report temporal local cases. Monthly air passenger volumes between each route was used to calculate the travel incidence.
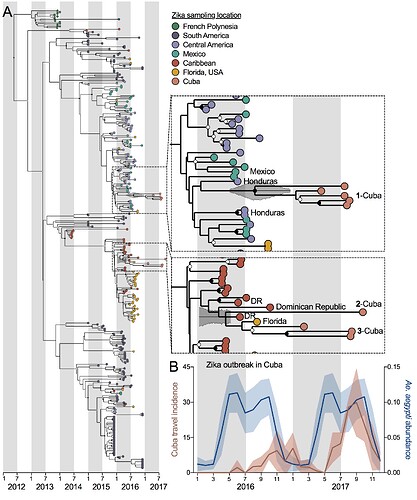
We sequenced Zika virus from eight infected Florida travelers arriving from Cuba during 2017 (data here) and obtained one Zika virus genome from a Cuban pregnant traveler diagnosed in Spain to determine the origins of the outbreak in Cuba (Figure 3A). Using these nine Cuban Zika virus genomes, plus other available data from French Polynesia and the Americas, we constructed a time-resolved maximum clade-credibility phylogenetic tree with BEAST. Based on the placement of the Cuban Zika virus genomes, we detected at least three separate introductions into Cuba (though clade 3 could be two separate introductions) coming from both Central America (perhaps Honduras) and the Caribbean (perhaps the Dominican Republic). It appears that most of these “successful” introductions occurred during 2016, corresponding to peak transmission elsewhere in the Caribbean and Central America and peak predicted Aedes aegypti abundance in Cuba (Figure 3B). Thus, the 2017 outbreak was sparked by long-living Zika virus transmission chains, persisting through low mosquito abundance during the dry season. The travel incidence data for Cuba in 2016 provides a rare look at transmission patterns, suggesting that large Ae. aegypti-borne virus outbreaks may be caused by “stuttered” transmission chains that persist from the season prior.
Figure 3. Multiple Zika virus introductions into Cuba during 2016 sparked the 2017 outbreak. (A) A maximum clade-credibility phylogenetic tree was constructed using 9 Zika virus genomes from Cuban travelers (8 that we sequenced) and available Zika virus genomes from French Polynesia and the Americas (analysis of the entire protein coding sequence). Insets zoom in on the the Cuba genomes. (B) The mean (with standard deviation) of the Zika virus travel incidence rates (cases/100,000 travelers) measured from Florida (USA), Spain, and Italy and predicted Ae. aegypti abundance (as previously estimated).
The point of releasing our data and preliminary analyses now was to make the public aware of the Zika virus outbreak in Cuba, to receive feedback on our approaches, and to promote new research directions. Please let us know if you have any questions, concerns, advice, or complementary data/analyses. We are also in the process of making the travel data available, upon permission from the Florida DOH and the ECDC. A preprint of our completed analyses, including data from chikungunya and dengue viruses, will be available within a couple months.
Nathan D. Grubaugh (Yale University School of Public Health), on behalf of:
Sharada Saraf, Karthik Gangavarapu, Glenn Oliveira, Nathaniel L. Matteson, Kristian G. Andersen: The Scripps Research Institute
Amanda L. Tan, Sharon Isern, Scott F. Michael: Florida Gulf Coast University
Andrea Morrison, Danielle Stanek, Blake Scott, Vanessa Landis, Stephen White, Leah Gillis, Ian Stryker, Marshall Cone, Edgar Kopp, Andrew Cannons, Lea Heberlein-Larson: Florida Department of Health
Alexander Watts, Deepit Bhatia, Kamran Khan: St. Michael’s Hospital, University of Toronto
Jason T. Ladner: Northern Arizona University
Lauren Gardner: University of New South Wales
Moritz U.G. Kraemer: University of Oxford & Harvard University
Michael Wiley, Karla Prieto, Gustavo Palacios: US Army Medical Research Institute of Infectious Diseases


