
Genomic characterization of the 2026 Bundibugyo virus disease outbreak in the Democratic Republic of the Congo
Prepared by Tony Wawina-Bokalanga, Placide Mbala-Kingebeni, Tania Bishola Tshitenge, Dav M Ebengo, and Eddy Lusamaki (INRB) | Jonathan Pekar and Andrew Rambaut (University of Edinburgh) | and Ciara Judge, Bernardo Gutierrez and Moritz Kraemer (University of Oxford) in collaboration with the genomic epidemiology team at INRB with national and international partners.
Full list of collaborators and acknowledgements
Please contact Tony Wawina-Bokalanga ([email protected]), Placide Mbala-Kingebeni ([email protected]), Tania Bishola Tshitenge ([email protected]), and Eddy Lusamaki ([email protected]) for more information.
This analysis includes 989 Bundibugyo virus (BDBV) genomes sampled through October 5, 2026 and uploaded through October 19; report prepared October 28, 2026.
A copy of this report in PDF format is available here).
Previous reports: (English | Français)
Main findings
- The genomic epidemic size appears to have broadly stabilized since early June 2026; there is no longer an apparent decline in late August 2026. The genomes examined here comprise 3 provinces (Ituri, Nord Kivu, and Sud Kivu) and 29 health zones; the stabilization is likely due to the additional genomic diversity provided by genomes from outside of the Mongbwalu, Bunia, and Rwampara health zones.
- The stabilization of the effective population size therefore likely reflects the averaging of a declining outbreak in these health zones with growing outbreaks in other health zones. This would broadly corroborate the epidemiology, with cases in the rest of Ituri and Nord Kivu proportionally increasing through August and September 2026, whereas the daily number of cases in Mongbwalu, Bunia, and Rwampara appear to be decreasing in the same time period. We note that this is a preliminary finding and multiple explanations need to be investigated.
- There is an increase in health zones with confirmed cases but no genomes, including Biena, Mutwanga, and Manguredjipa.
- Although sublineages are broadly not structured within Ituri, the Mongbwalu BDBV genomes appear to have some structure in the phylogeny, suggesting there could be multiple patterns of movement in the outbreak.
- The intensifying outbreak in Nord Kivu is focused in Katwa, Beni, Butembo, Mabalako, Oicha, and Musienene health zone but limited genomic sampling means understanding how these are linked remains a challenge. Mandima in Ituri is currently undersampled considering its recent surge in cases in September and genomes from there only available through mid-August.
The latest genomic epidemiology situation and analysis is available on the INRB dashboard: https://inrb-umie.github.io/BDBV2026-Epidemic_Dashboard/genomic-epidemiology.html
Table 1 | Key quantitative parameters.
| Parameter | Value |
|---|---|
| Genomes generated/analysed | 989 generated; 982 after QC (978 Ituri, 10 Nord Kivu, 1 Sud Kivu) |
| Median genome coverage | 97.1% (IQR 92.0–97.2) |
| Evolutionary rate | 1.1e-03 subs/site/year (95% HPD 1.0e-03–1.2e-03) |
| Origin of circulating lineages (tMRCA)) | 19 February 2026 (95% HPD 04 January–21 March 2026) |
| Cases, 1 May – 5 Oct 2026 | 8,858 confirmed; 27.0% test positivity |
| Sequencing coverage vs. case burden | slope 0.71, R² = 0.55 |
| Median age, sex ratio (%) | 27 yr (IQR 16–39); 51.7% female |
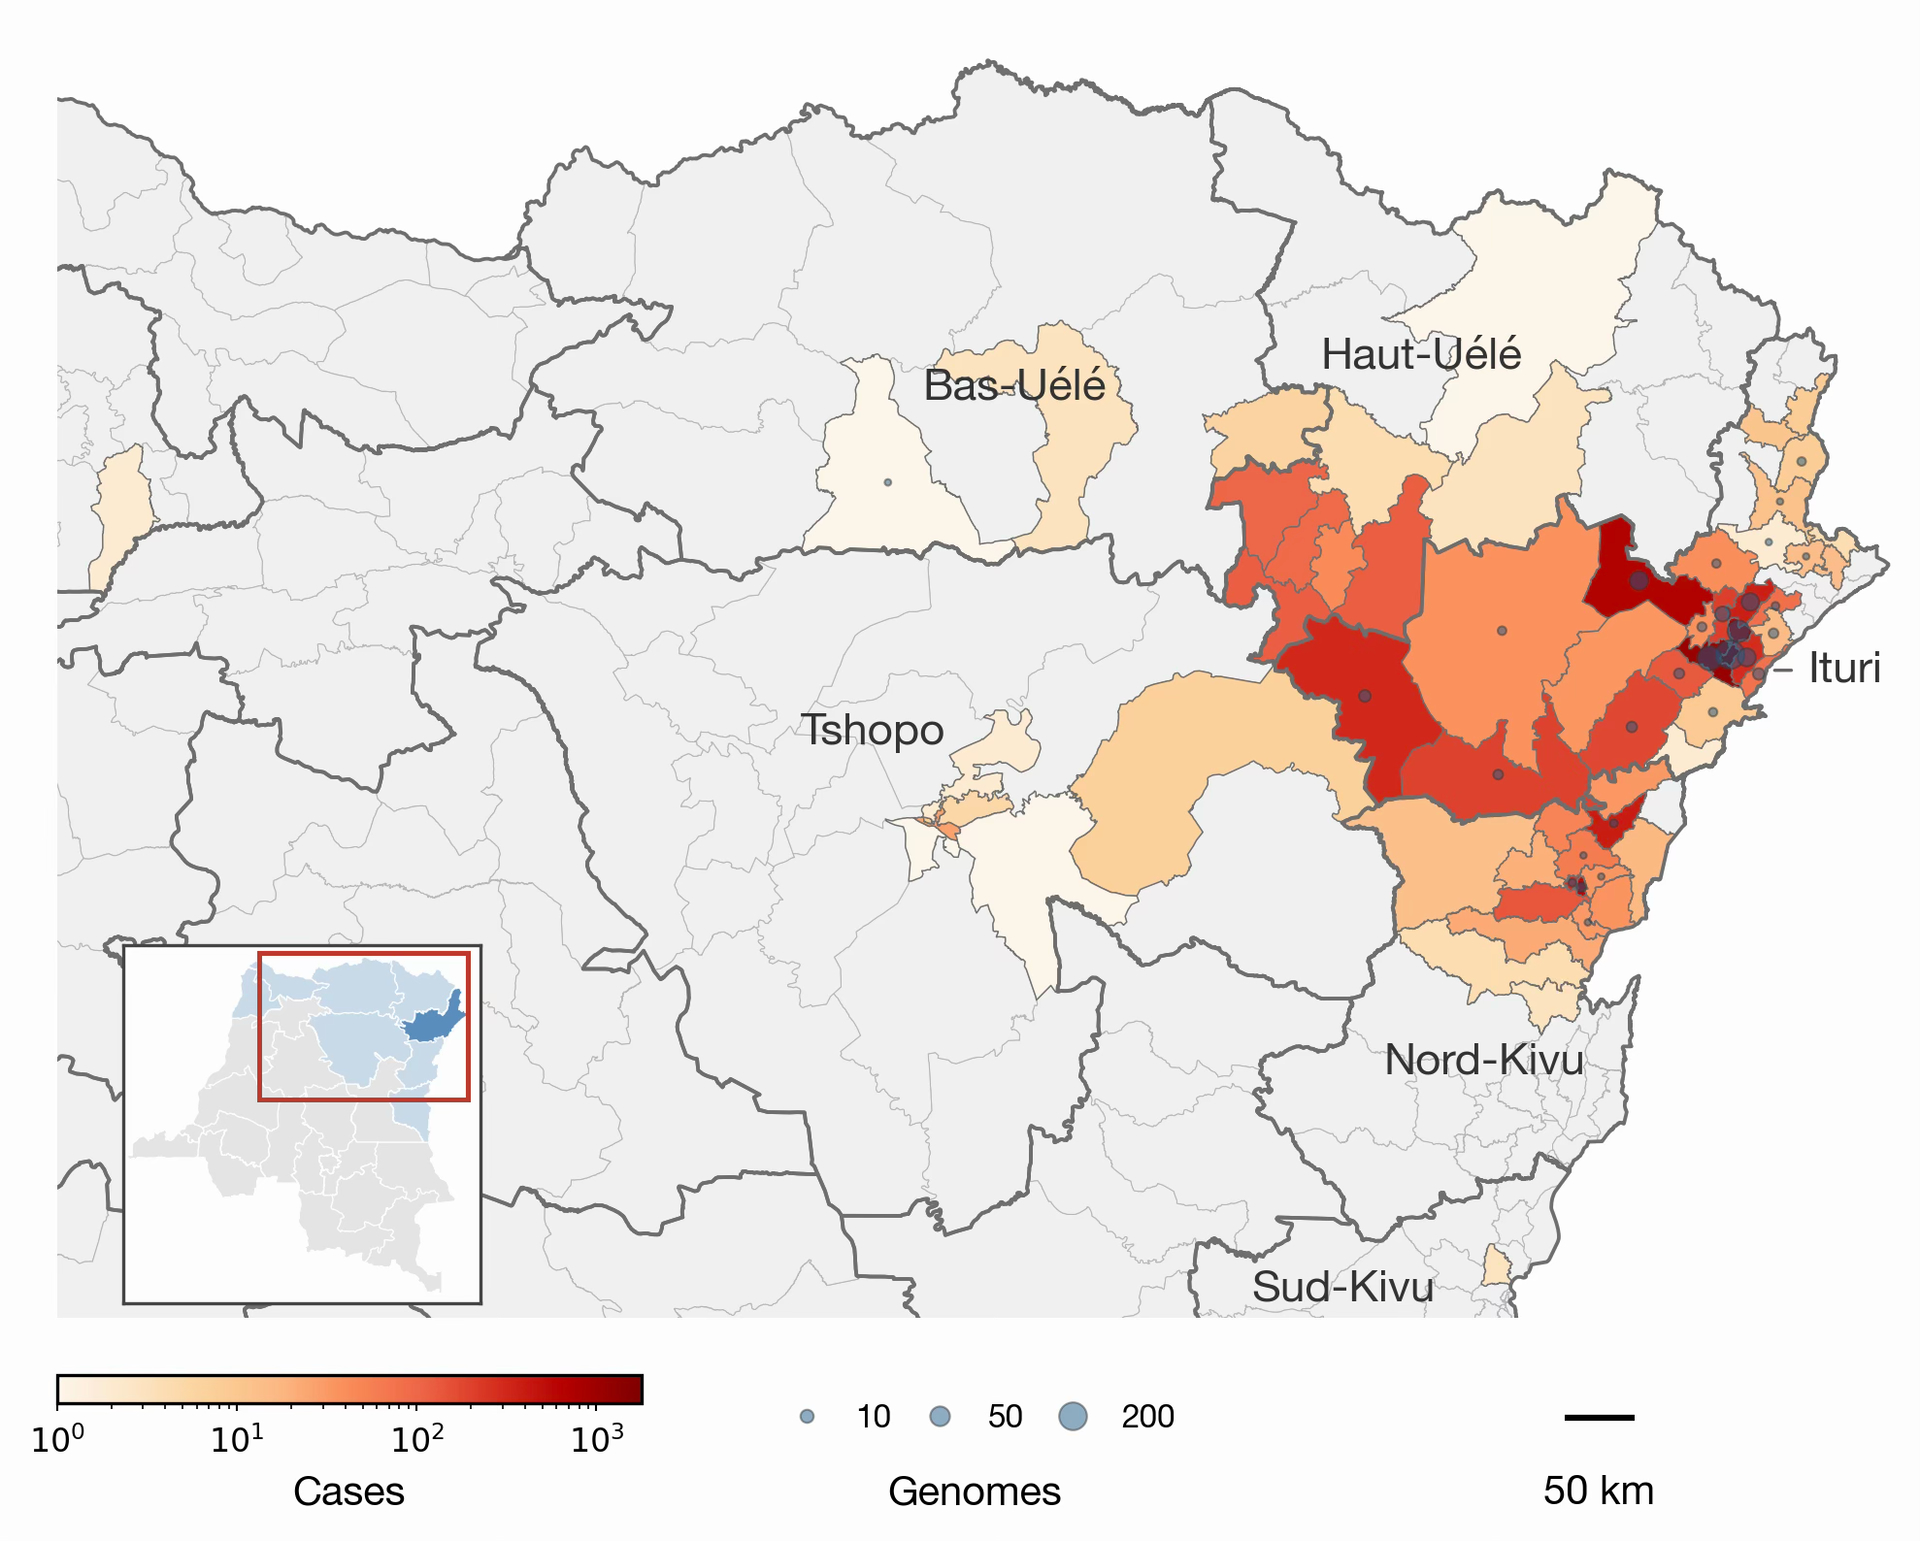
Figure 1 | Health zones with confirmed cases and BDBV genomes through 5 October 2026. Health-zone fill shows case counts and overlaid circle size shows genome counts. Inset locates the affected provinces (Ituri in dark blue); the red outline marks the mapped area.
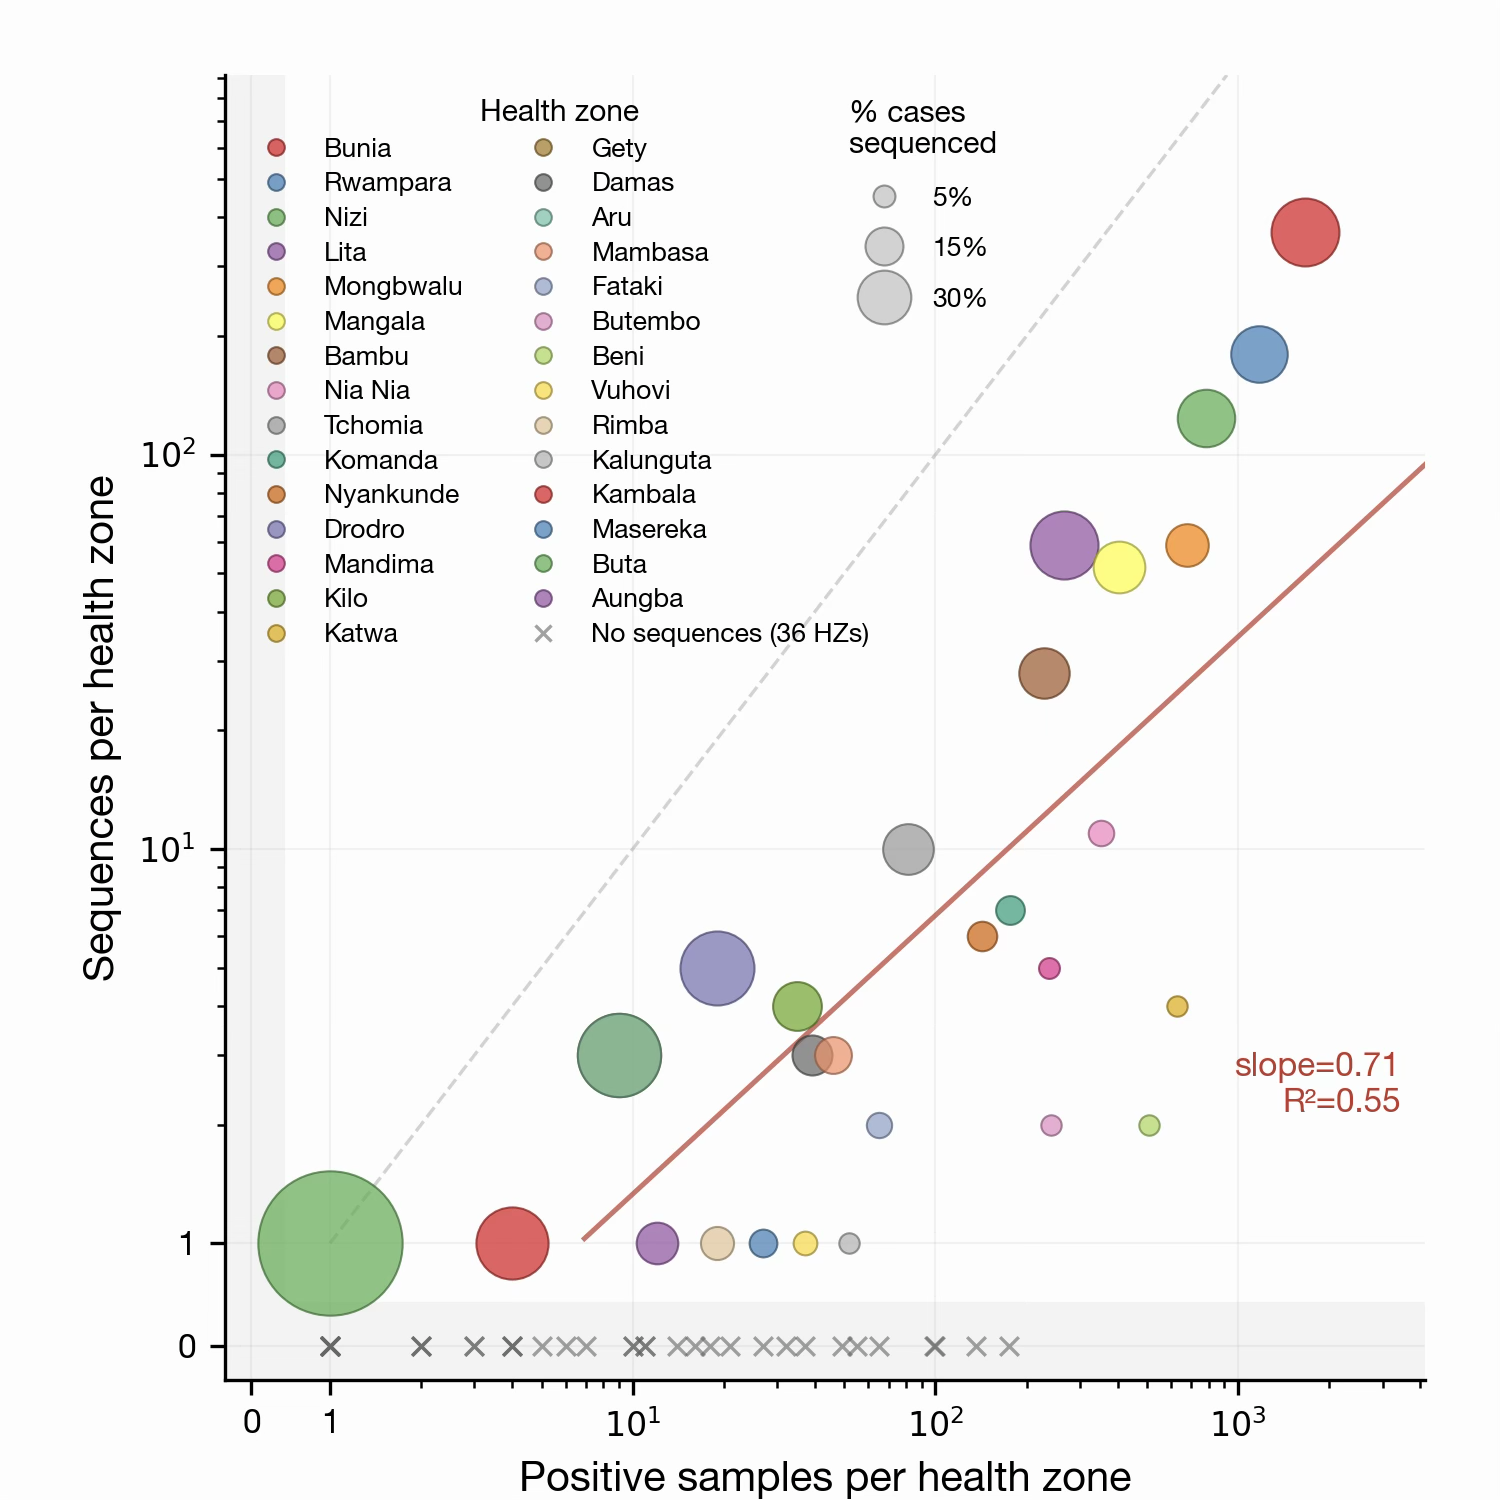
Figure 2 | Genomic sampling intensity by health zone. Each circle is a health zone, sized by the percent of cases sequenced. The dashed grey unity line represents one sequence per positive sample; the red line is the regression fit across health zones with ≥1 sequence (slope 0.71, R² = 0.55). Health zones with positives but no sequences are marked “×”.
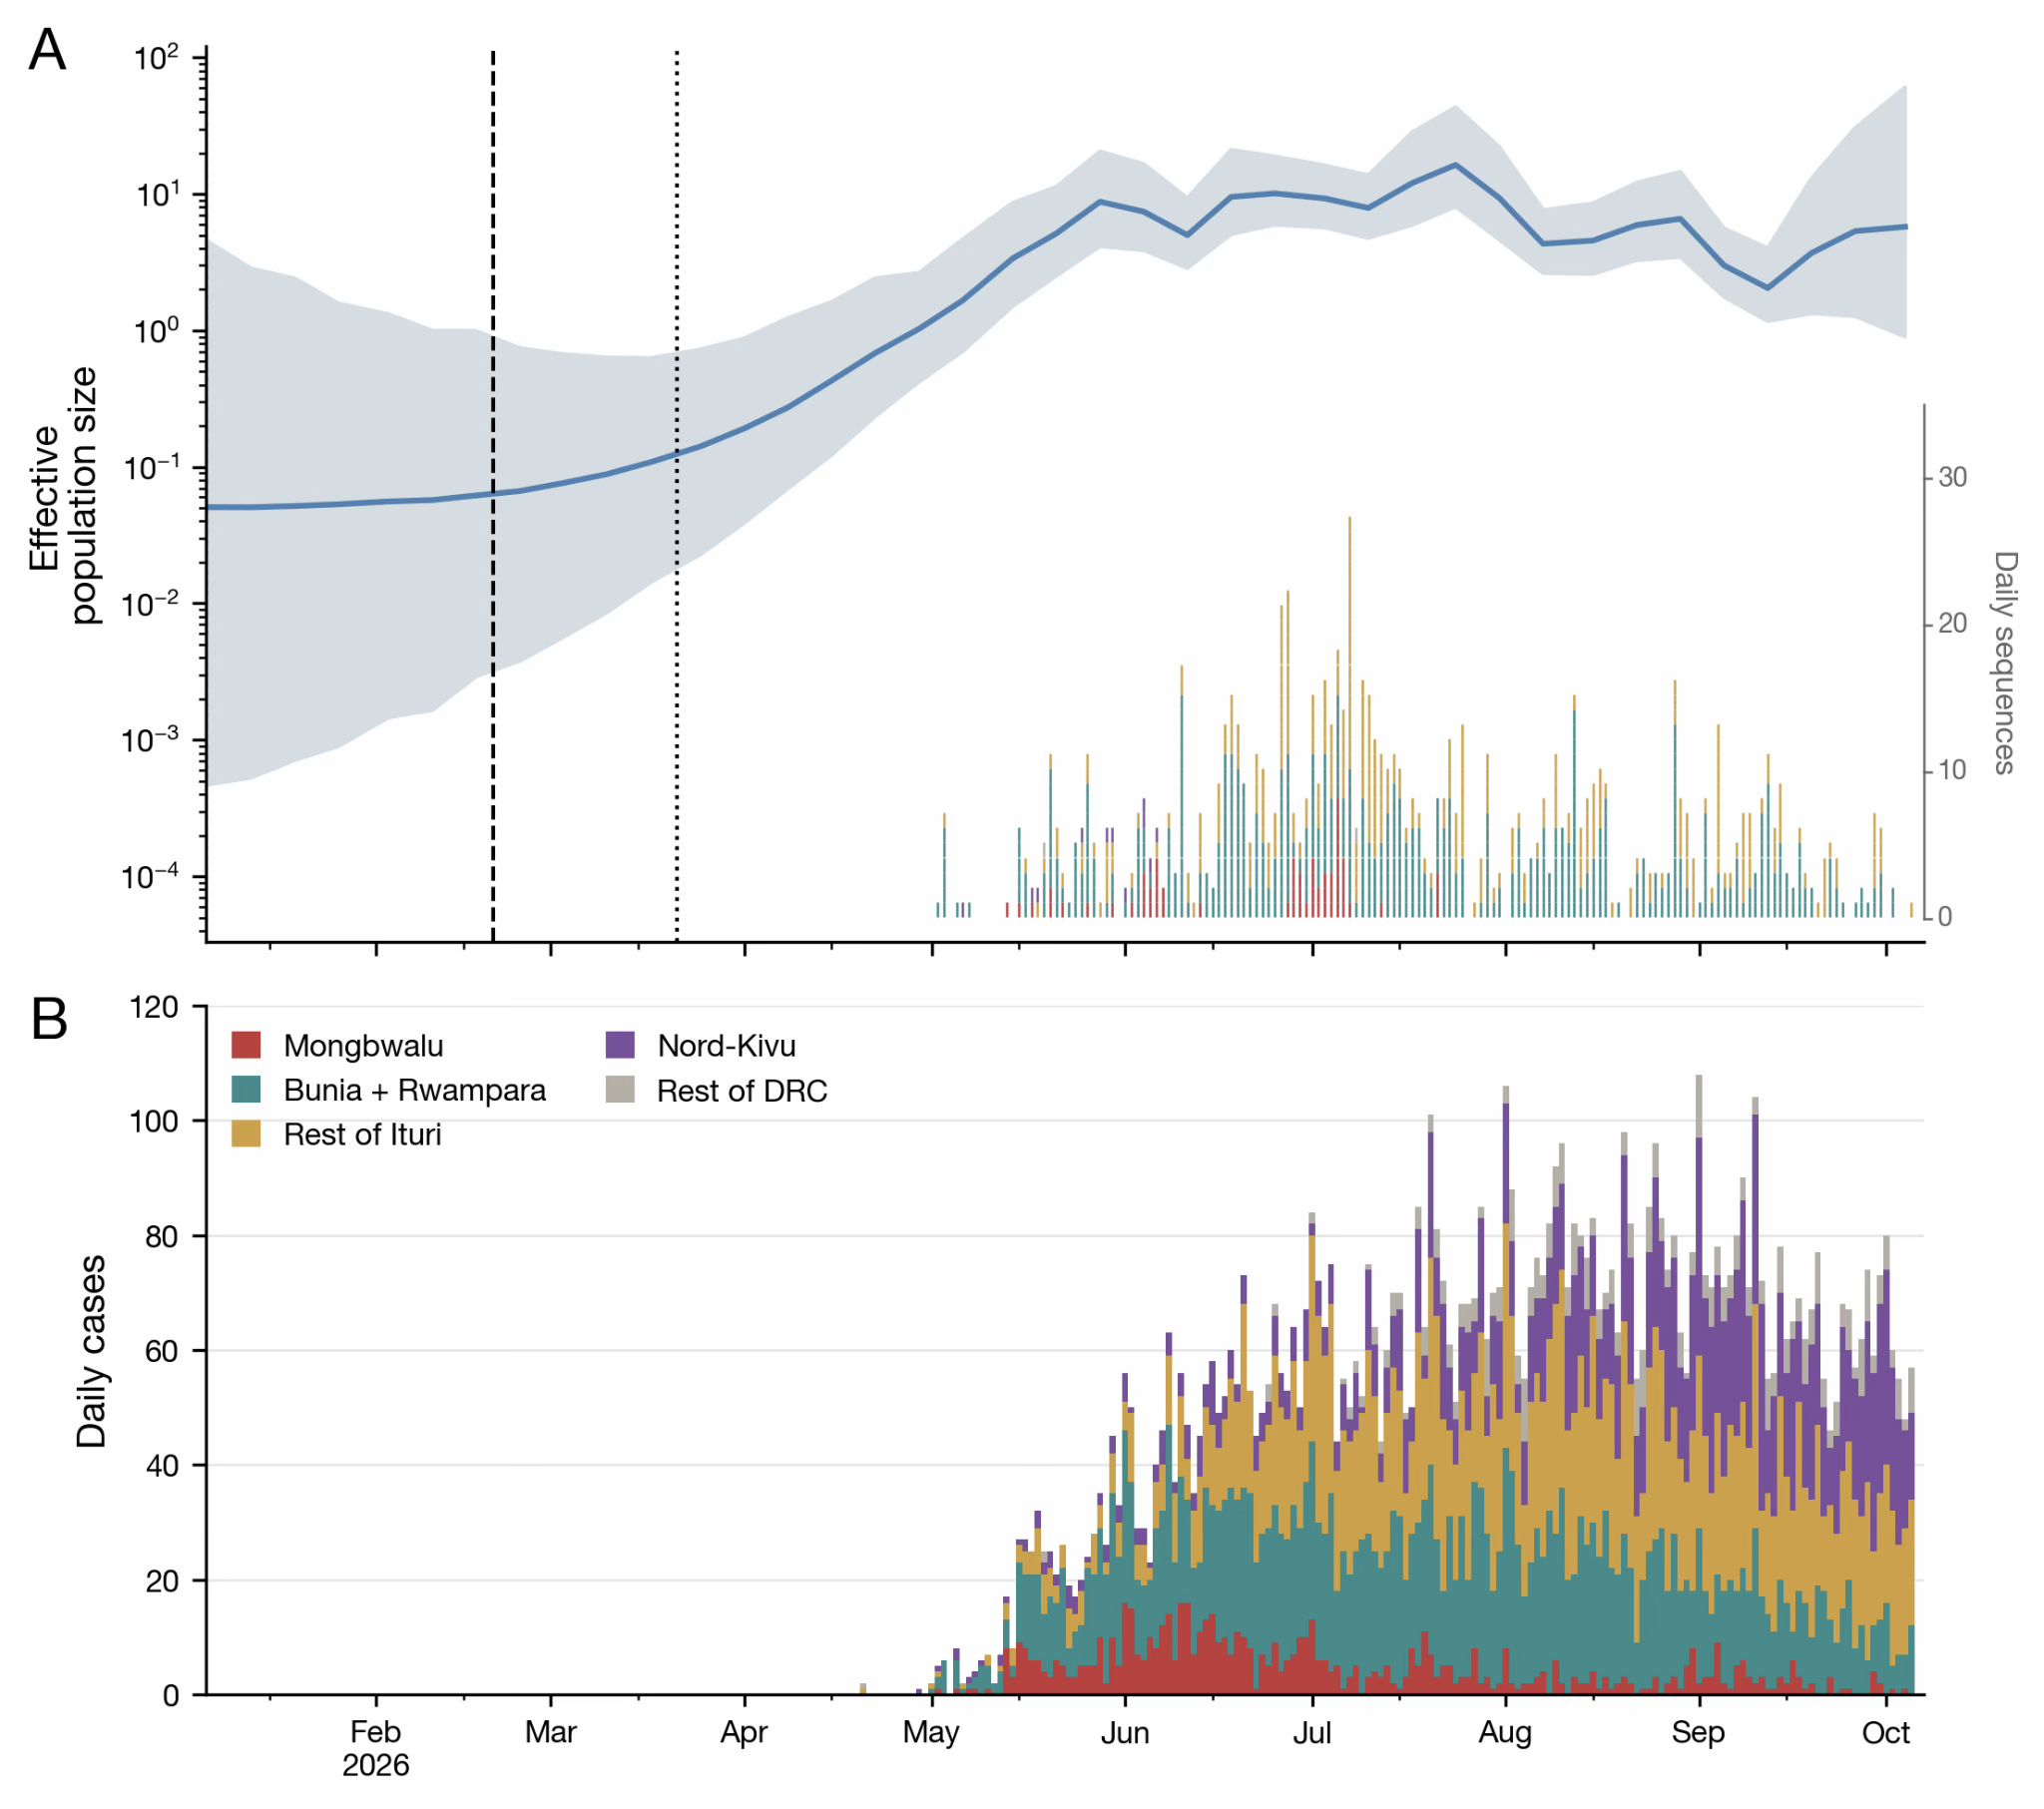
Figure 3 | Evolutionary history of the early 2026 Bundibugyo virus disease outbreak in the DRC. a, SkyGrid reconstruction of relative virus effective population size, an indirect measure of infections, over time (blue line, mean; shading, 95% HPD). The dashed line marks the median tMRCA and the dotted line the upper bound of its 95% HPD; the lower bound coincides with the y-axis limit. The rug plot shows dates and frequency of included genomes, coloured as in panel b. b, Daily PCR-positive case counts by symptom onset in Mongbwalu (red), Bunia and Rwampara (green), the rest of Ituri (gold), Nord-Kivu (purple), and the rest of the DRC (grey).
Implications and value of viral genome sequencing
- Continued effort to sequence samples from health zones newly reporting cases will help put their epidemics in the context of the wider epidemic.
- Sampling recent positive cases will allow continued situational awareness (e.g., is the epidemic growing or declining; are clusters of cases in one location related to frequent virus movements or a self-sustaining epidemic).
- Mandima, Beni, Katwa, Rwampara, Musienene, and Mambasa are currently undersampled with respect to the number of cases since the start of September and their recent growth rate (Figure 4). Oicha & Wamba have no sampled genomes, >70 cases, and consistent growth in the two weeks.
- Prioritising these areas for sequencing will provide better understanding of the drivers of the growth in cases they are experiencing.
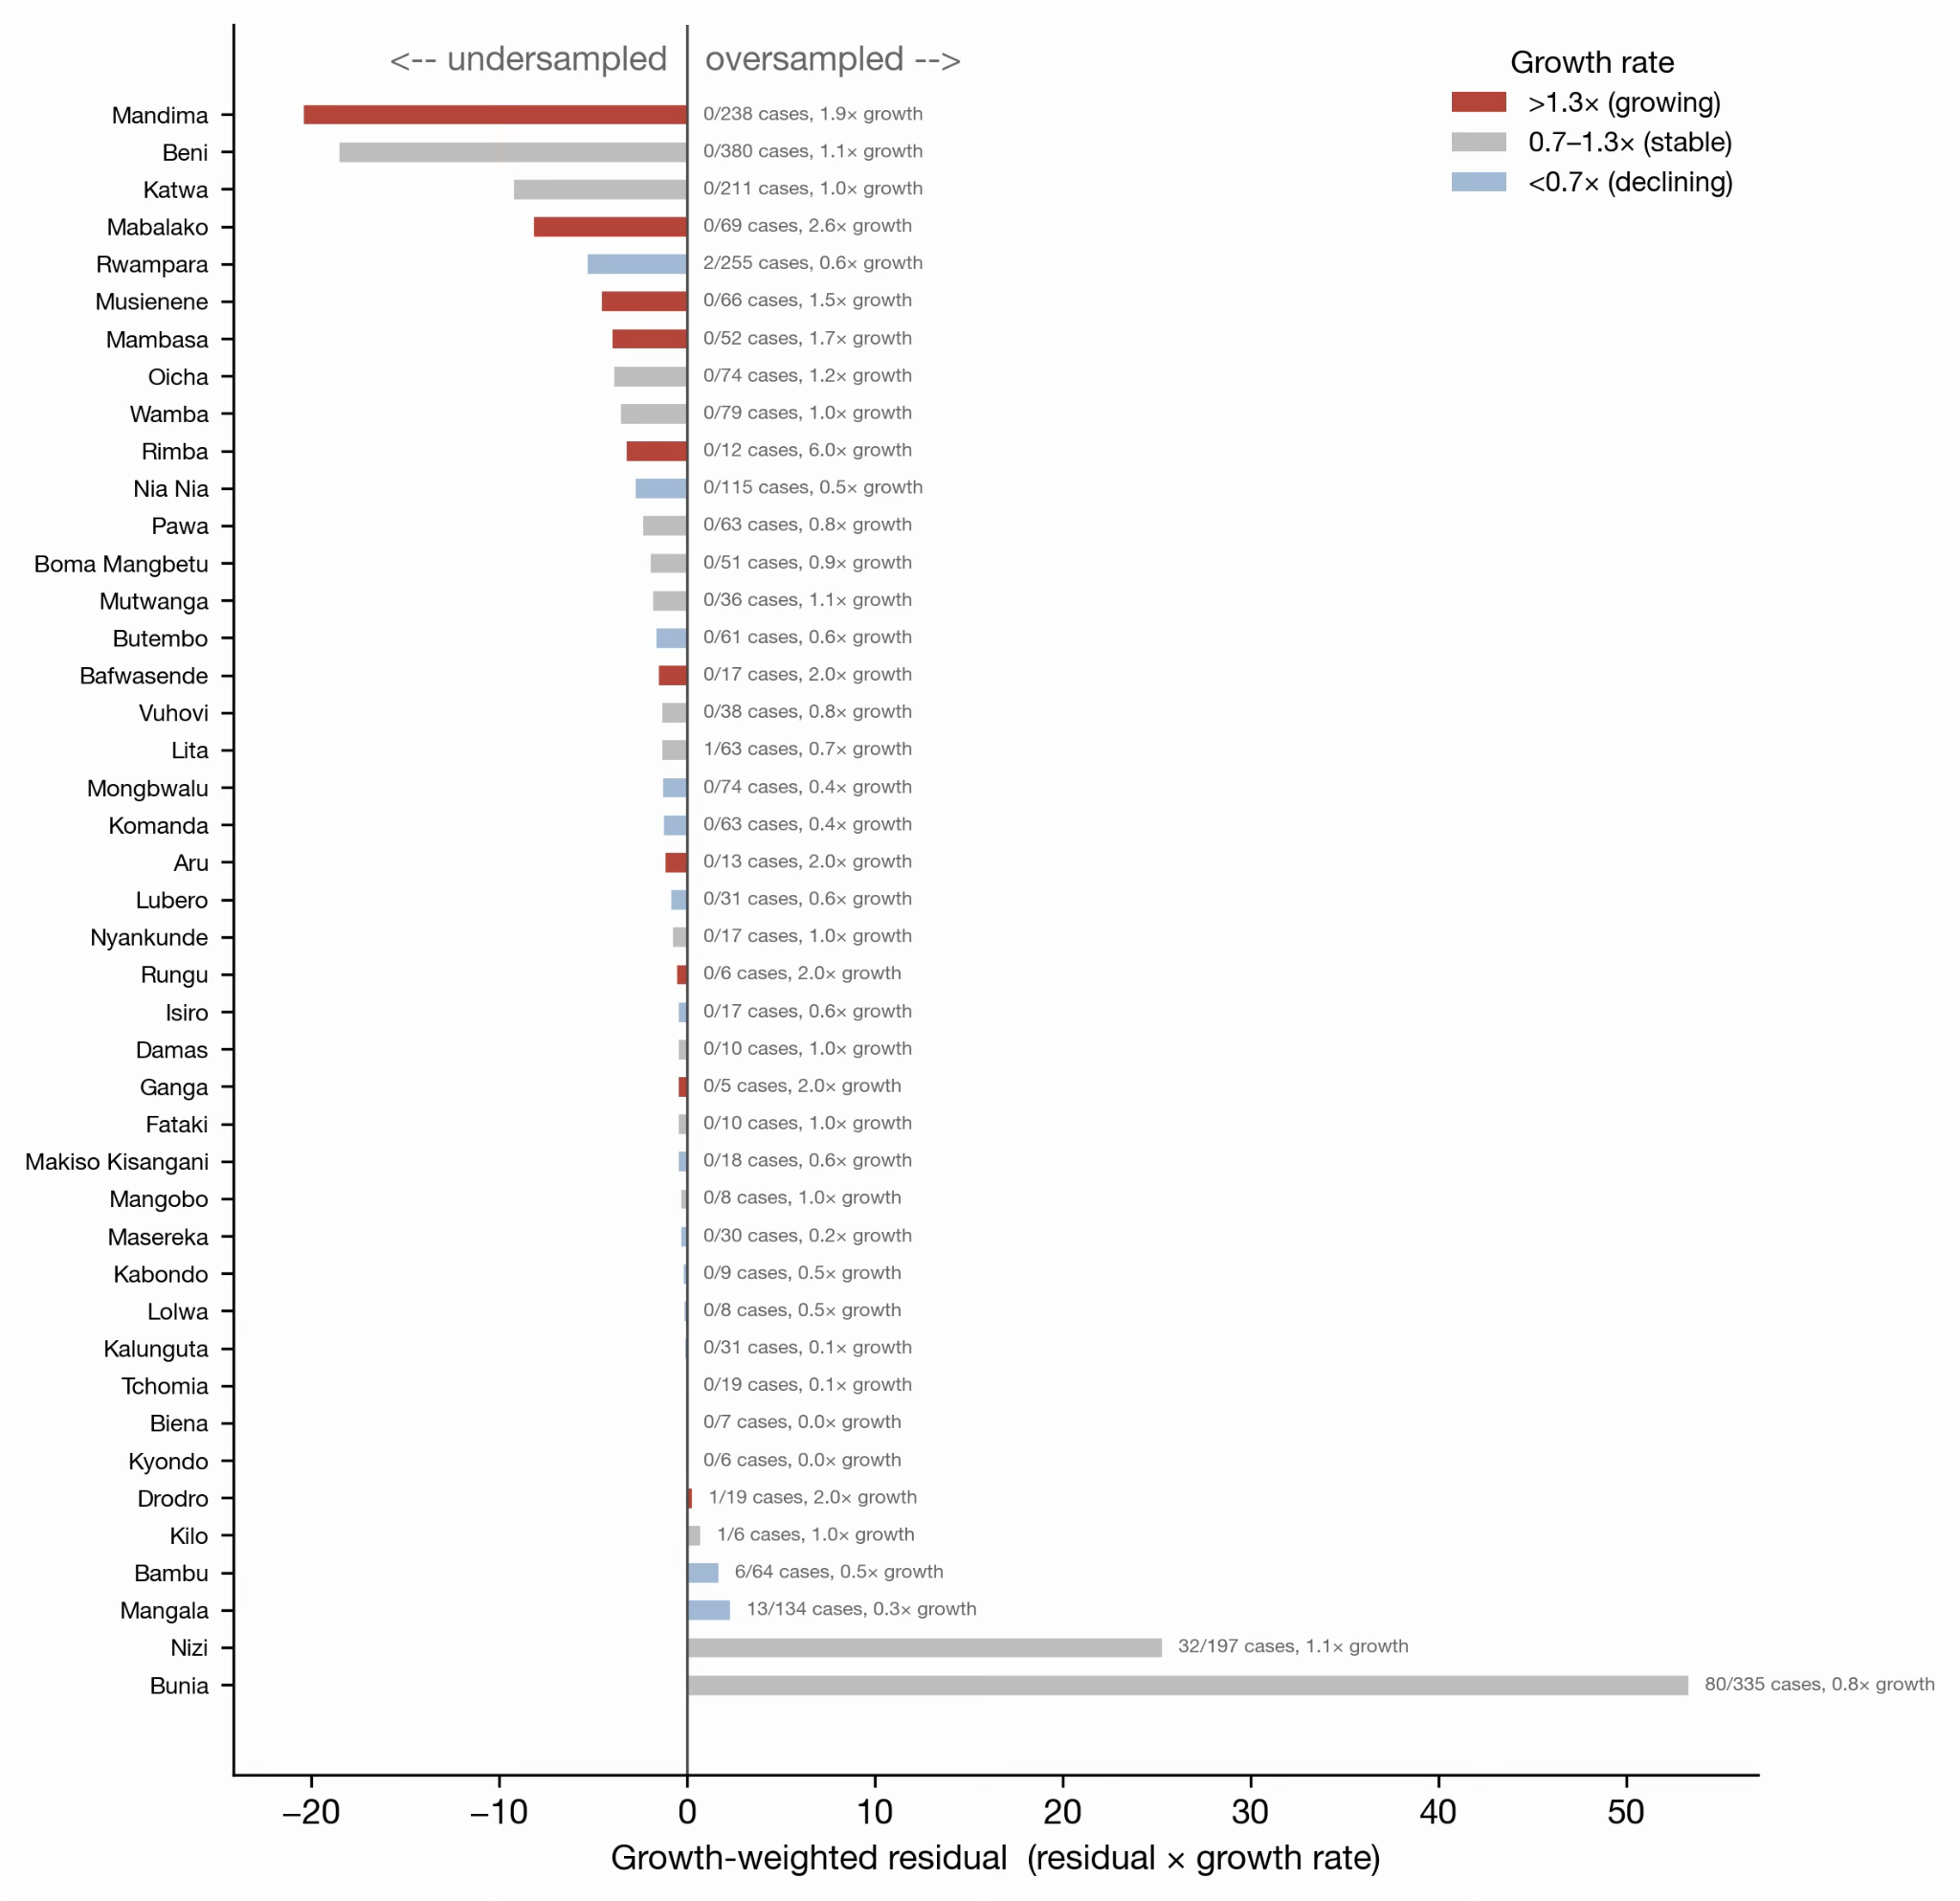
Figure 4 | Recent genomic sampling intensity relative to number of cases and growth rate of the outbreak. The bars indicate the residual (actual number of genomes per health zone minus the number expected had genomes been distributed proportionally to cases) multiplied by growth rate (number of confirmed cases in the two weeks leading up to 5 October divided by the number in the preceding two weeks). The number of sequenced cases in each health zone since 1 September indicated to the right of the bar. The bars are colored by the growth rate, indicating a relatively declining, stable, or growing outbreak in that health zone.
Technical Appendix
1. Data and methods
- Specimens. EDTA-whole blood from living patients and oropharyngeal swabs from decedents, collected 1 May – 5 October 2026 in Ituri and Nord Kivu provinces as part of the emergency response (ethics approval ESP/CE/81/2026, Kinshasa School of Public Health).
- Whole genome Sequencing. Samples with Ct < 31 were sequenced using two approaches: early-phase samples used viral probe-based capture enrichment, subsequently by tiled-amplicon using ARTIC pan-Ebola or BDBV-specific primer panels. Sequencing libraries were run on an Illumina NextSeq 2000 or Oxford Nanopore GridION sequencer. Consensus genomes were generated via the ARTIC amplicon-nf pipeline (ONT) or Viralrecon 2.6.0 (Illumina). Median genome coverage 97.1% (IQR 92.0–97.2).
- Quality control. Genomes aligned to reference were downloaded from Pathoplexus (https://pathoplexus.org/). Three genomes appeared to have sequencing issues and were excluded. Host ADAR-editing signatures (clustered T→C substitutions) were detected with raccoon and masked — including 49 excess T→C sites in the glycoprotein — to prevent inflation of the inferred substitution rate. Iterative root-to-tip regression removed one strong temporal outlier, giving a final set of 982 genomes (971 Ituri, 10 Nord Kivu, and 1 Sud Kivu).
- Phylogenetic inference and molecular dating. Maximum-likelihood tree in IQ-TREE 3 (GTR+F+R3, selected by ModelFinder). Time-scaled inference in BEAST X v10.6.0-beta4 using a SkyGrid coalescent model (46 weekly transition points, 47-week cut-off), GTR substitution model and a strict molecular clock; 100 million MCMC generations, 10% burn-in, all relevant ESS > 100.
- Epidemiological data. Confirmed-case line list and weekly situation reports, 1 May – 5 October 2026. Missing symptom-onset dates were imputed from the fitted onset-to-collection delay distribution (epidist R package v0.4). A live dashboard is maintained at https://inrb-umie.github.io/BDBV2026-Epidemic_Dashboard/.
2. Additional details on main results
2.1 Epidemiological distribution (Figures 1,2)
Between 15 May and 5 October 2026, 8,858 PCR-confirmed cases of Bundibugyo virus disease were reported with an overall test positivity of 27.0%. Ituri province accounted for 6,512 cases (73.5%), concentrated in four health zones: Bunia (1,656; 18.7%), Rwampara (1,172; 13.2%), Mongbwalu (676; 7.6%) and Nizi (781; 8.8%). Sequencing efforts tracked case burden closely but sub-proportionally (slope 0.71, R² = 0.55 on the log-log scale), and 36 health zones with confirmed cases yielded no sequences at all — a clear geographic gap in genomic coverage. The correlation coefficient (R² = 0.55) has declined since the previous report, with more affected health zones lacking genomic coverage than before.
2.2 Timing of emergence and evolutionary rate (Figure 5)
The estimated evolutionary rate is 1.1 × 10⁻³ substitutions per site per year (95% HPD 1.0–1.2 × 10⁻³), consistent with other orthoebolavirus outbreaks. Relative to our previous report (English | Français), we find a slightly earlier but broadly consistent tMRCA of mid-February, rather than early March, with a median tMRCA of 19 February 2026 (95% HPD 4 January – 21 March 2026). Because the tMRCA marks the common ancestor of sampled lineages, the true spillover may be earlier. We consider it possible that the virus may have been circulating in humans for roughly two to three months before the first laboratory confirmation.
2.3 Transmission dynamics (Figure 3)
The SkyGrid reconstruction shows three phases: a slow start in January–February 2026, marked acceleration from March to June, then stabilisation of effective population size through the end of the study period. The effective population size is an indirect measure of incidence and is mirrored in the case data. Our previous report (English | Français) showed a decline in late August and early September 2026, which was likely reflective of the core part of the outbreak (i.e., Mongbwalu, Bunia, and Rwampara) at that time experiencing a decline; since then the outbreak has spread to other regions and the effective population size estimates could represent an average of declining and growing outbreaks in different regions. Phylogenetic sub-clusters are not geographically structured within Ituri, indicating repeated movement of BDBV-infected individuals between health zones rather than contained local chains. Mongbwalu, Bunia, and Rwampara show a steady decline in daily case counts since July 2026.
2.4 Robustness and operational value of real-time genomics
Genome availability declined after mid-July 2026. Phylodynamic inference appears stable now, but the effective population size estimates could be the aggregation of both declining and growing outbreaks across the country.
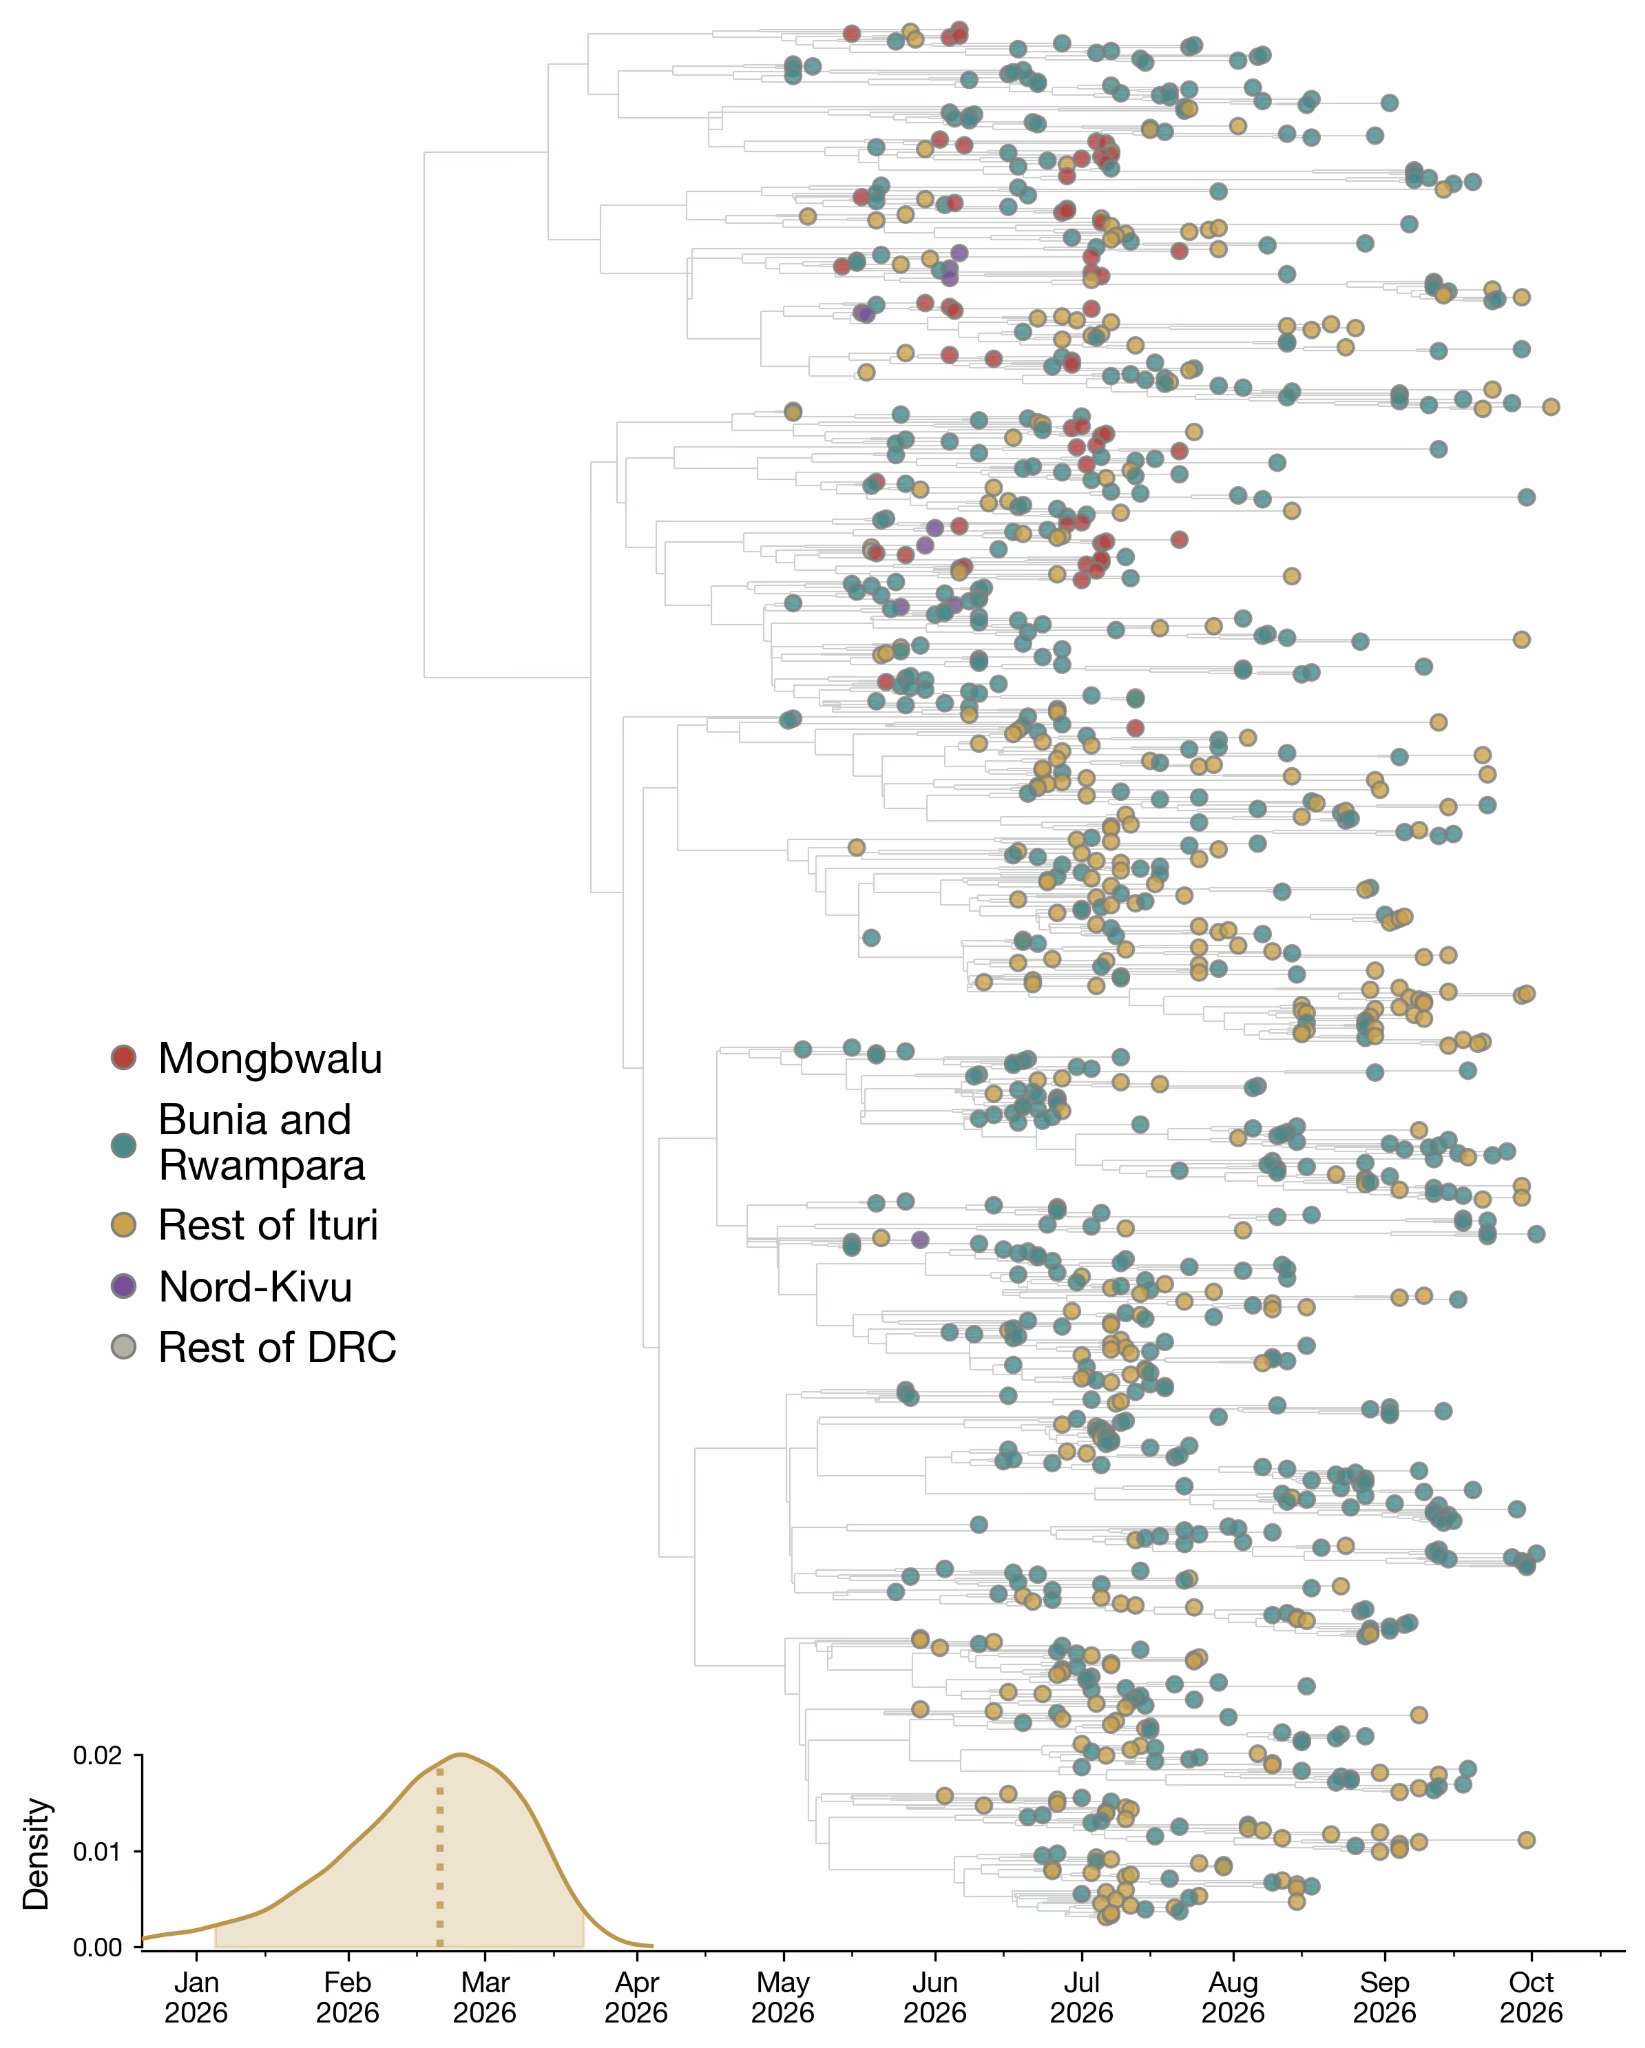
Figure 5. Time-resolved phylogeny of the 2026 Bundibugyo virus disease outbreak in the DRC. The density plot shows the time of the most recent common ancestor (tMRCA), with the dotted line indicating the median estimate and the shaded region representing the 95% HPDI.
3. Limitations and caveats
- Sampling is heavily Ituri-weighted. 971 of 982 analysed genomes are from Ituri, with ten genomes from Nord Kivu and one from Sud Kivu. Conclusions about spread to other provinces are not currently available from the genomic data.
- Estimates of population-size trajectories (Figure 2a) should be considered together with the presented uncertainty. This uncertainty becomes greater towards the present due to the delay between case detection and sequence availability.
- tMRCA is a lower bound on spillover timing. It dates the common ancestor of sampled lineages; unsampled early diversity would push the true introduction earlier.
- There are two data sources for case counts: Incident management system daily situation-reports (https://insp.cd/category/actualites/) and the surveillance line list. These two sources are reconciled with priority given to the daily situation-reports.
Acknowledgements
Key contributors to data collection/molecular testing/data interpretation/whole genome sequencing/bioinformatics analysis/phylogenetic analysis:
Institutions and partners
Institut National de Recherche Biomédicale (INRB), Kinshasa, DRC
- Adrienne Amuri-Aziza
- Prince Akil-Bandali
- Princesse Paku-Tshambu
- Pauline-Chloé Muswamba-Kayembe
- Rilia Ola-Mpumbe
- Gradi Luakanda-Ndelemo
- Ange Ponga-Museme
- Placide Matondo-Mbundu
- Emmanuel Lokilo-Lofiko
- Fiston Cikaya-Kankolongo
- Judith Tete-Sitra
- Raphael Lumembe - Numbi
- Julie Tuenakoko-Kulumbula
- Nelson Kashali
- David Isengelo-Sikatenda
- LeBon Matendo-Kakina
- Jean-Claude Makangara-Cigolo
- Servet Kimbonza
- Elzedek Mabika-Bope
- Patrick Mukadi-Kakoni
- Eddy Kinganda-Lusamaki
- Tania Bishola Tshitenge
- Dav Ebengo
- Steve Ahuka - Mundeke
- Jean - Jacques Muyembe-Tamfum
- Tony Wawina-Bokalanga
- Placide Mbala-Kingebeni
Institut National de Santé Publique (INSP), Kinshasa, DRC
- Christian Ngandu
- Pierre Akilimali
- Dieudonné Mwamba
Laboratoire Provincial de Santé Publique, Ituri, DRC
- Pascal Adroba Tandele
- Phine Malengo-Olokakoy
- Neema Kavugho-Sindani
- Lievin Tibasima-Dhessa
- Benjamin Djemba-Fundji
- François Berocan-Underos
- Berkias Bakambu-Nebape
Laboratoires P2/P3, Rodolphe-Merieux INRB-Goma, DRC
- Michel Ngimba
- Brigitte Modrada
- Noella Mukanya
- Daniel Mukadi-Bamuleka
Division Provinciale de la Santé, Ituri, DRC
- Alex Kalume-Albati
Africa Centres for Disease Control and Prevention, Addis Ababa, Ethiopia
- Collins Kipngetich Tanui
- Justus Nsio
- Yenew Kebede
- Placide Mbala-Kingebeni
Institute of Tropical Medicine, Antwerp, Belgium
- Adrienne Amuri-Aziza
- Tony Wawina-Bokalanga
- Daan Jansen
- Kevin K. Ariën
- Laurens Liesenborghs
- Koen Vercauteren
University of Edinburgh, UK
- Jonathan E. Pekar
- Áine O’Toole
- Andrew Rambaut
University of Oxford, UK
- Moritz U.G. Kraemer
- Bernardo Gutierrez
- Ciara Judge
- Joseph L.-H. Tsui
- Miles W. Carroll
University of Birmingham, UK
- Sam Wilkinson
- Josh Quick
- Chris Kent
- Sam Richardson
- Charlotte Pratt
- Nick Loman
Simon Fraser University, Canada
- Renny Doig
- Caroline Colijn
Gates Foundation, Seattle, USA
- Sofonias Kifle Tessema
- David Blazes
- Georgina Murphy
European Plotkin Institute for Vaccinology, Université Libre de Bruxelles (ULB), Brussels, Belgium
- Piet Maes
KU Leuven, Leuven, Belgium
- Adrienne Amuri-Aziza
- Laurens Liesenborghs
- Guy Baele
TransVIHMI, Université de Montpellier, INSERM, IRD, Montpellier, France
- Eddy Kinganda-Lusamaki
- Martine Peeters
- Ahidjo Ayouba
- Eric Delaporte
- Eric D’Ortenzio
University of Kinshasa, Kinshasa, DRC
- Eddy Kinganda-Lusamaki
- Daniel Mukadi-Bamuleka
- Steve Ahuka - Mundeke
- Jean - Jacques Muyembe -Tamfum
- Tony Wawina-Bokalanga
- Placide Mbala-Kingebeni
African Center of Excellence for Genomics of Infectious Diseases, Redeemer’s University, Ede, Nigeria
- Christian Happi
University of Basel, Switzerland
- Emma Hodcroft
University of California, Los Angeles, CA, USA
- Anne Rimoin
US Department of Agriculture, Manhattan, KS, USA
- Lisa E. Hensley
University of Manitoba, Winnipeg, Manitoba, Canada
- Jason Kindrachuk
World Health Organization
- Olga Ntumba-Tshitenge (WHO, Country Office, Kinshasa, DRC)
- Amadou Mouctar Diallo (WHO, Country Office, Kinshasa, DRC)
- John O. Otshudiema (WHO, Regional Office for Africa, Brazzaville, Republic of Congo)
- Marie-Roseline Belizaire (WHO, Regional Office for Africa, Brazzaville, Republic of Congo)
- Nicksy Gumede (WHO AFRO)
- Lorenzo Subissi (WHO, Geneva)
Acknowledgments and Funding
We thank the Ministry of Public Health, Hygiene and Social Welfare of the DRC. The authors gratefully acknowledge the ongoing support of the Africa Centers for Disease Control and Prevention (Africa CDC), the World Health Organization, and partner non-governmental organizations. We also acknowledge the support provided by the Unité de Gestion du Programme de Développement du Système de Santé (UG-PDSS), the Institute of Tropical Medicine (ITM) through Belgian Directorate-general for Development Cooperation and Humanitarian Aid (DGD FA5 project, the Culmen International LCC, the US CDC Atlanta, and the Agence Française de Développement through the AFROSCREEN project (grant agreement CZZ3209), coordinated by ANRS Maladies Infectieuses émérgentes in partnership with Institut Pasteur and Institut de Recherche pour le Développement, the French Ministry of Europe and Foreign Affairs through FEF programme and support provided by Institut de Recherche pour le Développement. AREBO project funded by ANRS-MIE. A.A.-A is supported by a DGD sandwich PhD scholarship. N.L., S.W., J.Q., C.K., R.D., C.C., E.H., J.E.P., A.O’T., A.R & P.M-K. acknowledge the support of the Wellcome Trust through the ARTIC Network (award 313694/Z/24/Z) and the Gates Foundation (award INV-092067). M.U.G.K. acknowledges funding from The Rockefeller Foundation (PC-2022-POP-005, also A.R.), Health AI Programme from Google.org, the Oxford Martin School Programmes in Pandemic Genomics & Digital Pandemic Preparedness, European Union’s Horizon Europe programme projects MOOD (#874850) and E4Warning (#101086640), Wellcome Trust grants 303666/Z/23/Z, 226052/Z/22/Z & 228186/Z/23/Z, the United Kingdom Research and Innovation (#APP8583), the Medical Research Foundation (MRF-RG-ICCH-2022-100069), UK International Development (301542-403), the Bill & Melinda Gates Foundation grants (INV-063472, INV-090281, INV-103122) and Novo Nordisk Foundation (NNF24OC0094346). The contents of this publication are the sole responsibility of the authors and do not necessarily reflect the views of the European Commission or the other funders. The authors are also grateful for the support of the John D. and Catherine T. MacArthur Foundation, Flu Lab, and a cohort of generous donors through TED’s Audacious Project, including the ELMA Foundation, MacKenzie Scott, the Skoll Foundation, and Open Philanthropy. We also acknowledge Oxford Nanopore Technologies (ONT) for providing sequencing R10 flow cells that partially supported this work.