A preliminary selection analysis of the South African V501.V2 SARS-CoV-2 clade
Sergei L Kosakovsky Pond, Eduan Wilkison, Steven Weaver, San Emmanuel James, Houriiyah Tegally, Tulio de Oliveira, and Darren Martin
An interactive notebook where you can explore this analysis and view additional information (e.g. map substitutions onto the tree) can be found at https://observablehq.com/@spond/zav501v2. This analysis is evolving and will be regularly updated.
Summary.
We investigated the nature and extent of selective forces acting on the Spike gene in V501.V2 clade sequences by performing a series of comparative phylogenetic analyses on 28 V501.V2 sequences and 441 sequences from GISAID chosen to represent the genomic diversity of SARS-CoV-2 (Figure 1).
Results
- There is evidence of diversifying positive selection acting on the V501.V2 sequences, both at the level of the entire gene (BUSTED p = 0.0500), and on ten individual codon sites (out of 165 amino-acid polymorphic sites) along the internal branches of the 501.V2 clade (Table 1, Figure 1). These sites include all clade-defining sites (S18, S80, S215, S246, S417, S484, S501, S701), and also at sites S5, S242. S5 and S18 have shown evidence of selective pressure in global SARS-CoV-2 selection analyses prior to November 2020; all other sites appeared more recently.
- When comparing the strength of selection on V501.V2 to the 441 reference sequences along internal tree branches, five individual sites along the internal branches of the clade (Table 2) showed statistically significant differences (false discovery rate ≤ 0.2). In all cases selection in the V501.V2 is more intense; this includes three clade-defining sites (S18, S215, S417) and also at S242, and S1182; these sites are possible locations of clade-specific adaptation not seen (or seen with weaker intensity) in other SARS-CoV-2 isolates. A gene-level test showed (RELAX p-value 0.0111) that selection on V501.V2 was intensified relative to the reference branches (K = 1.72).
- Over the entire tree ten sites showed evidence of directional selection (Table 3); this analysis is able to identify selection which can be missed by diversifying selection tests (e.g. one substitution followed by fixation).
- It is plausible that, as has been observed in other rapidly evolving viruses (HIV, IAV), adaptive mutations in the surface/envelope gene might have had associated fitness costs that were subsequently recouped by secondary mutations elsewhere in the gene. The codons within which adaptive mutations occur and those within which associated compensatory mutations occur would be expected to co-evolve. We attempted to detect such coevolving codon pairs using the Bayesian Graphical Model approach which infers a network of conditional dependence relationships among sites. This revealed one pair (codons 215 and 417) of spike gene codon sites with evidence of coevolution in the V501.V2 clade (Table 4); because we only consider a small number of branches in this test, the power is necessarily limited. Both of these sites are individually detectably evolving under diversifying positive selection with S215 further showing evidence of directional selection favouring changes to amino acid charge.
Figures and tables
Figure 1 Maximum likelihood phylogeny of Spike sequences from this analysis with two sets of internal branches used for testing highlighted. Terminal branches (considered as as “nuisance set” in most tests) are shown in gray.
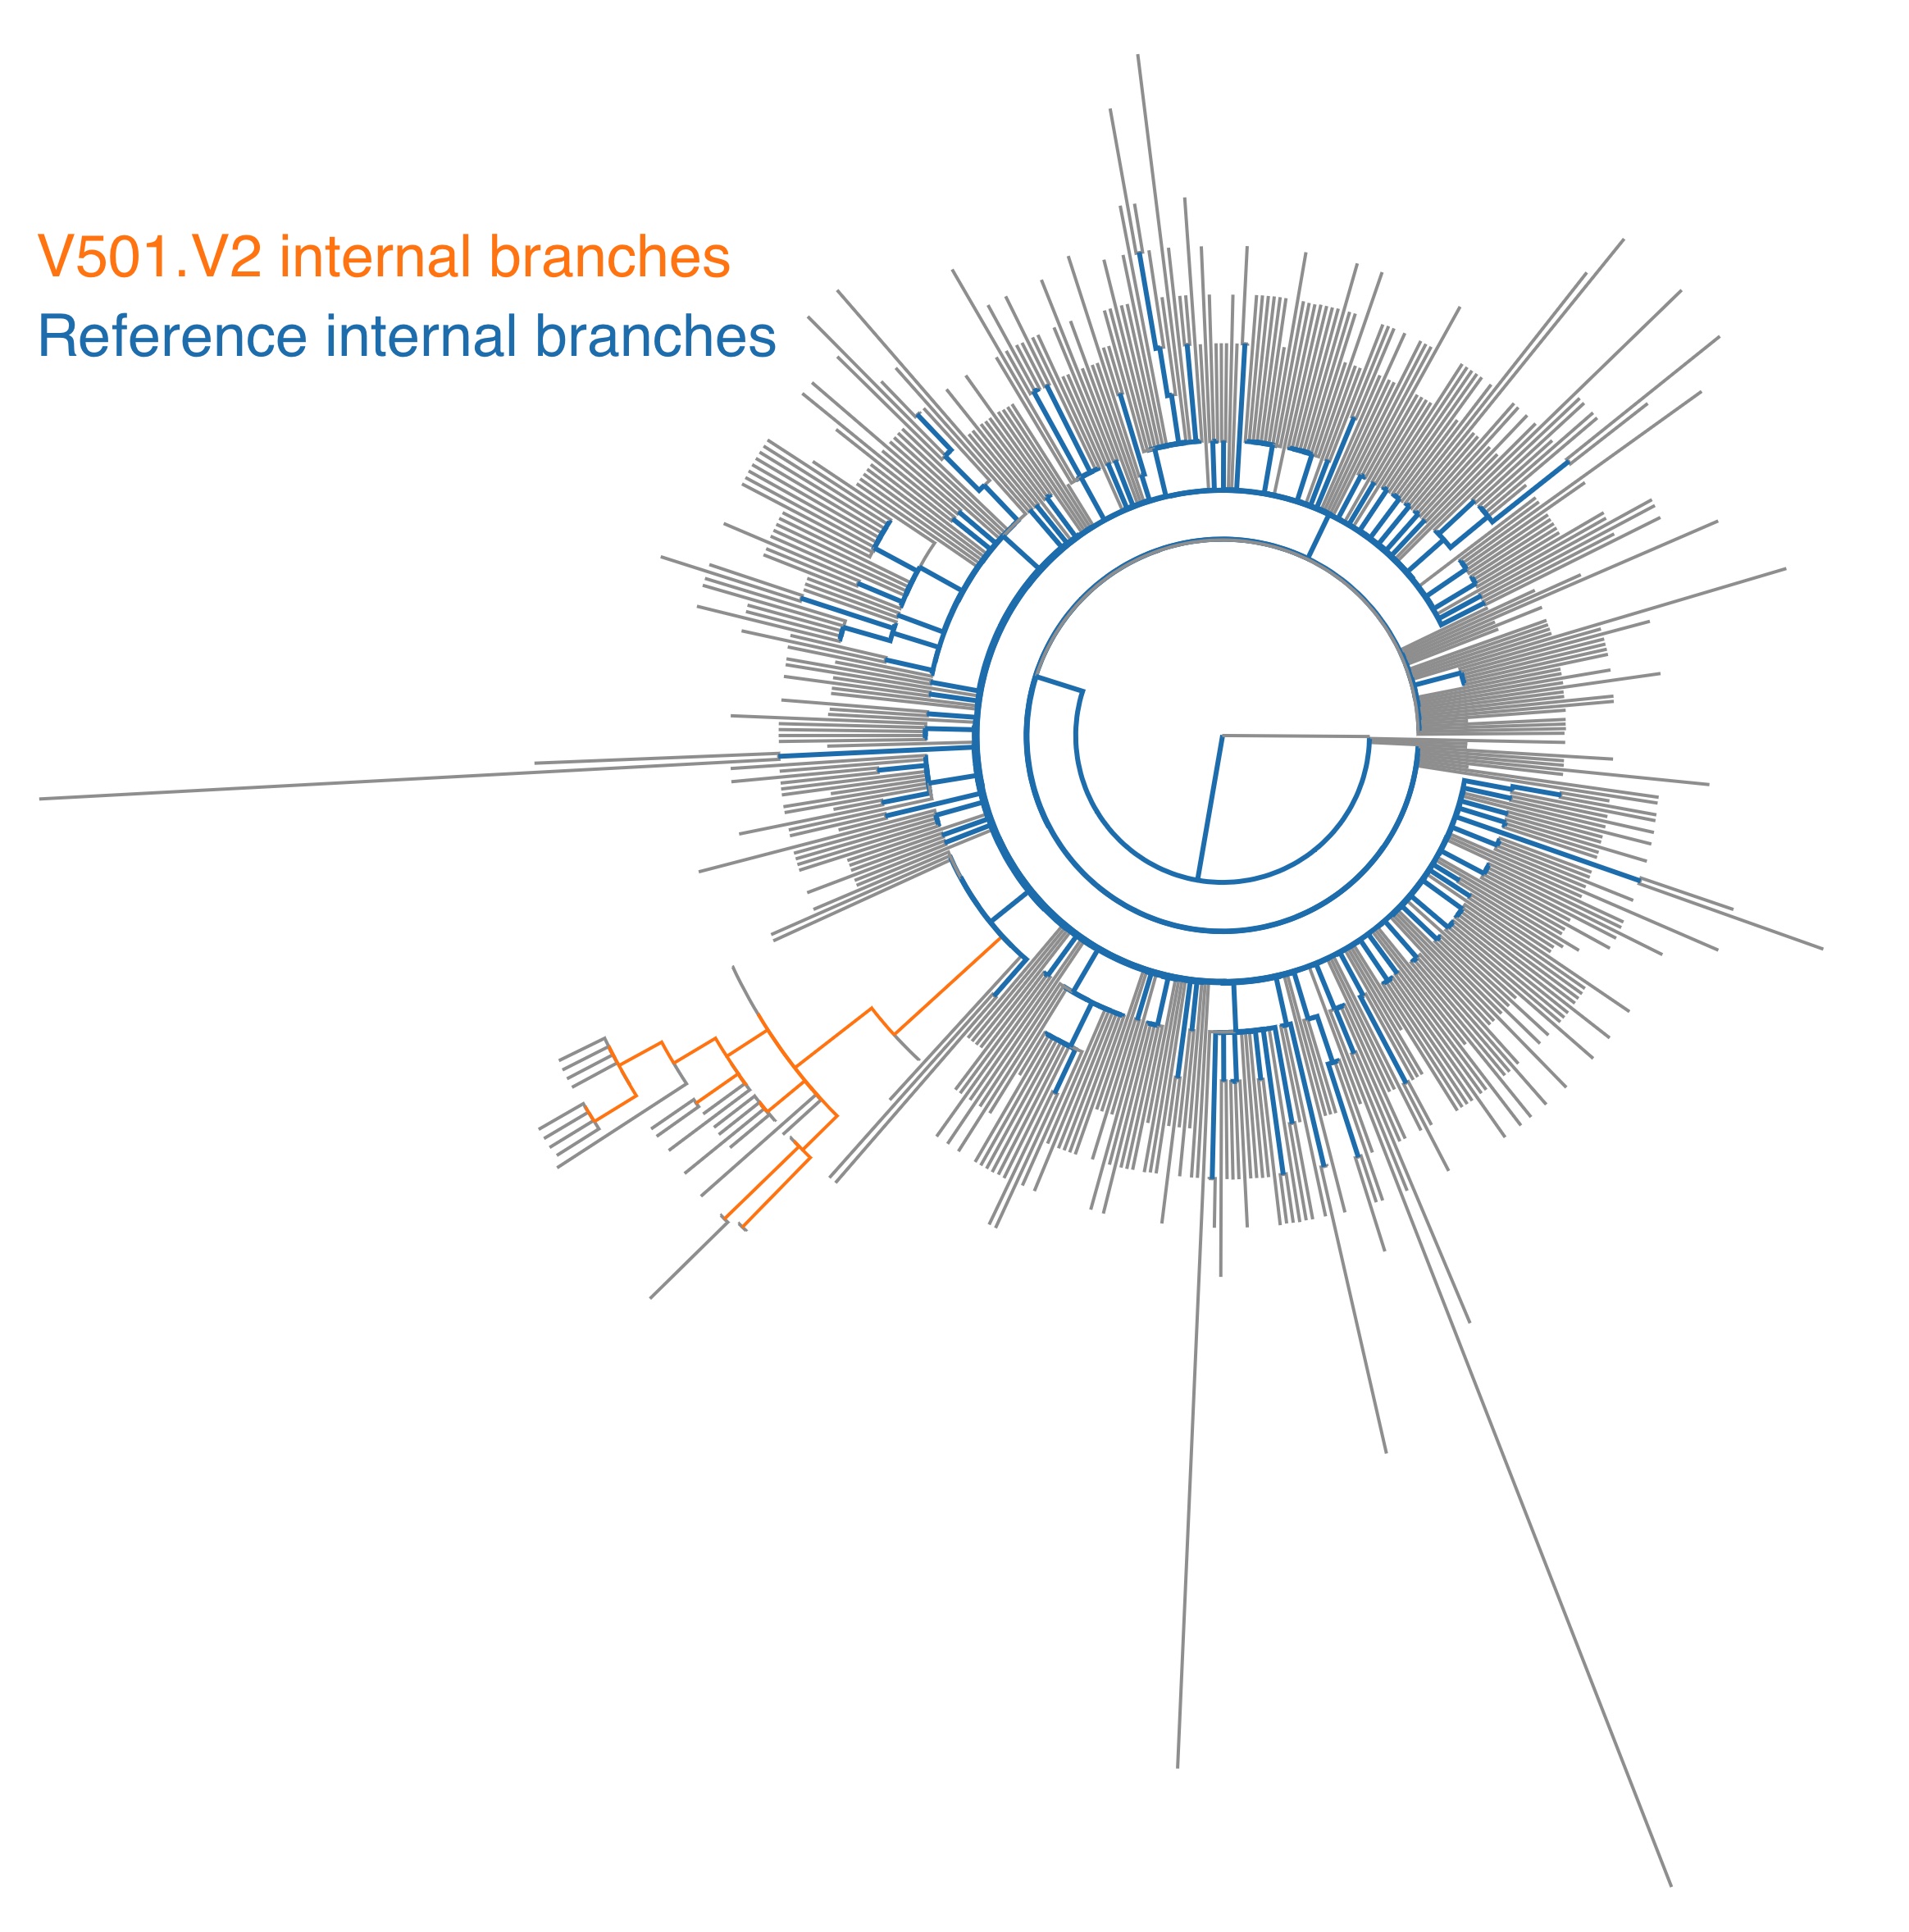
Table 1 List of sites found to be under selection by MEME (p≤0.05) along internal branches in V501.V2, as well as biochemical properties that are important at this site (via the PRIME method)
| Coordinate (SARS-CoV-2) | Gene | Codon | % of branches with ω>1 | p-value | q-value | Properties |
| 21574 | S | 5 | 99.0% | 0.00337 | 0.715 | |
| 21613 | S | 18 | 100% | 0.0000181 | 0.00766 | |
| 21799 | S | 80 | 91.9% | 0.00399 | 0.726 | |
| 22204 | S | 215 | 99.0% | 0.00000168 | 0.00214 | overall, secondary (constrained) , volume (constrained) , charge (changing) |
| 22285 | S | 242 | 21.7% | 0.00000694 | 0.00441 | |
| 22297 | S | 246 | 53.1% | 0.00712 | 1.00 | |
| 22810 | S | 417 | 100% | 0.0000320 | 0.0102 | |
| 23011 | S | 484 | 100% | 0.0320 | 1.00 | |
| 23062 | S | 501 | 38.5% | 0.00210 | 0.535 | |
| 23662 | S | 701 | 99.0% | 0.00556 | 0.885 |
- Coordinate: the starting coordinate of the codon in the NCBI reference SARS-CoV-2 genome
- Gene: which gene or ORF does this site belong to
- Codon : the location of the codon in the corresponding Gene/ORF
- % of branches with ω>1: the fraction of tree branches (internal branches in the V501.V2 clade) that have evidence of diversifying positive selection at this site (100% – pervasive selection, <100% – episodic selection).
- p-value: the p-value for the likelihood ratio test that a non-zero fraction of branches have ω > 1 (i.e. episodic diversifying selection at this branch). This is not corrected for multiple testing; the MEME test is generally conservative on real data.
- q-value: multiple-test corrected q-value (Benjamini-Hochberg)
- Properties: which, if any, of the five compositive biochemical properties from Atchley et al are conserved or changed at this site.
Table 2 List of sites found to be selected differentially along internal branches between V501.V2 and reference sequences (FDR ≤ 0.2) using the Contrast-FEL method
| Coordinate (SARS-CoV-2) | Gene | Codon | Ratio of ω
(V501.V2 : reference) |
p | q |
| 21613 | S | 18 | 24.3 | 0.000399 | 0.101 |
| 22204 | S | 215 | 53.9 | 0.00000421 | 0.00535 |
| 22285 | S | 242 | 124 | 0.000142 | 0.0453 |
| 22810 | S | 417 | Infinite | 0.0000311 | 0.0198 |
| 25105 | S | 1182 | Infinite | 0.0000564 | 0.0239 |
- Coordinate: the starting coordinate of the codon in the NCBI reference SARS-CoV-2 genome
- Gene: which gene or ORF does this site belong to
- Codon : the location of the codon in the corresponding Gene/ORF
- Ratio of ω (V501.V2 : reference): the ratio of site-level ω estimates for the two sets of branches. If this ratio is >1, then selection on V501.V2 is stronger. These values are highly imprecise and should be viewed as qualitative measures.
- p-value: the p-value for the likelihood ratio test that ω ratios between the internal branches of the two clades are different. This is not corrected for multiple testing.
- q-value: multiple-test corrected q-value (Benjamini-Hochberg)
Table 3 List of sites found to be evolving under directional selection in the entire tree, using a FUBAR-like implementation of the DEPS method. The tree was rooted on the genome reference sequence for this analysis.
| Coordinate (SARS-CoV-2) | Gene | Codon | Target amino-acids |
| 21574 | S | 5 | F |
| 21595 | S | 12 | F |
| 21613 | S | 18 | F |
| 21844 | S | 95 | I |
| 22918 | S | 453 | F |
| 23041 | S | 494 | P |
| 23602 | S | 681 | H |
| 24376 | S | 939 | F |
| 25243 | S | 1228 | L |
| 25285 | S | 1242 | I |
- Coordinate: the starting coordinate of the codon in the NCBI reference SARS-CoV-2 genome
- Gene: which gene or ORF does this site belong to
- Codon : the location of the codon in the corresponding Gene/ORF
- **Target amino-acid :**which amino-acids have statistical support (Bayes Factor ≥ 100) for accelerated evolution towards them.
Table 4 Pairs of sites found to have epistatic (co-evolving) substitution patterns by BGM method
| Gene | Codon 1 | Codon 2 | Posterior probability of non-independence |
| S | 215 | 417 | 0.563 |
- Gene: which gene does this pair belong to
- Codon 1/2 : the location of the codon in the corresponding Gene/ORF
- Posterior probability of non-independence: estimated posterior probability that substitutions which occur on the interior branches of the V501.V2 clade are not independent.
Methods.
- We aligned all query (South African V501.V2) and reference (GISAID unique haplotypes in Spike) sequences to the GenBank reference genome S protein sequence using a codon-aware alignment tool bealign (part of the BioExt Python package, also used by HIV-TRACE) with the HIV-BETWEEN-F scoring matrix (similar viral sequences). This approach does not consider insertions relative to the reference genome in subsequent analyses.
- Because selection analyses gain no power from including identical sequences, and minimal power from the inclusion of sequences that are essentially identical, we filtered both South African and reference (GISAID) sequences using pairwise genetic distances complete linkage clustering with the tn93-cluster tool. All groups of sequences that are within D genetic distance (Tamura-Nei 93) of every other sequence in the group and represented by a single (randomly chosen) sequence in the group. We set D at 0.0005 for V501.V2 sequences, and, and at 0.0015 for GISAID “background” sequences.
- We inferred a maximum likelihood tree from the combined sequence dataset using raxml-ng using default settings (GTR+G model, 20 starting trees).
- We partitioned internal branches in the resulting tree into two non-overlapping sets used for testing (Figure 1) and annotated the Newick tree.
- We used HyPhy v2.5.24 to perform a series of selection analyses. We focus most of the analyses on internal branches because of a well-known feature of viral evolution where terminal branches include “dead-end” (maladaptive or deleterious on the population level) events within individual hosts which have not been “seen” by natural selection, whereas internal branches must include at least one transmission event.
- Gene level test for selection on the internal branches of the V501.V2 clade using BUSTED with synonymous rate variation enabled.
- Gene level test for differences in selective pressures between on internal branches between in the V501.V2 clade and the reference branches using RELAX with synonymous rate variation enabled.
- Site-level tests for episodic diversifying (MEME) and pervasive positive or negative selection (FEL) on the internal branches of the V501.V2 clade
- Tests for directionally evolving sites, using FADE on the protein-translated sequence alignment using the ML tree rooted on the reference sequence. This test was applied across the entire tree, including internal and terminal branches.
- Site-level tests for biochemical property importance (PRIME) on the internal branches of the V501.V2 clade
- Epistasis/co-evolution inference on substitutions along internal branches of the V501.V2 clade using Bayesian Graphical models.
- We combined all the results using a Python script and visualized results using several open source libraries in ObservableHQ (https://observablehq.com/@spond/zav501v2)