Animation of reconstructed movement of Ebola virus between the geographical districts of Guinea, Sierra Leone and Liberia over the course of 2014 and 2015. Moving line segments represent a single reconstructed movement (black segments are within a country, coloured segments represent inter-country movements). Individual districts are coloured with saturation proportional to the number of recorded cases each week. Green denotes Guinea, blue Sierra Leone and red Liberia.
The reconstruction is based on a time-scaled phylogenetic reconstruction using BEAST with a discrete phylogeographical model. 1561 genome sequences kindly provided by many labs and groups. Animation made using Python by @evogytis. Analysis and data is the work of many people.
The analysis is part of a paper in preparation. I will post more results here shortly.
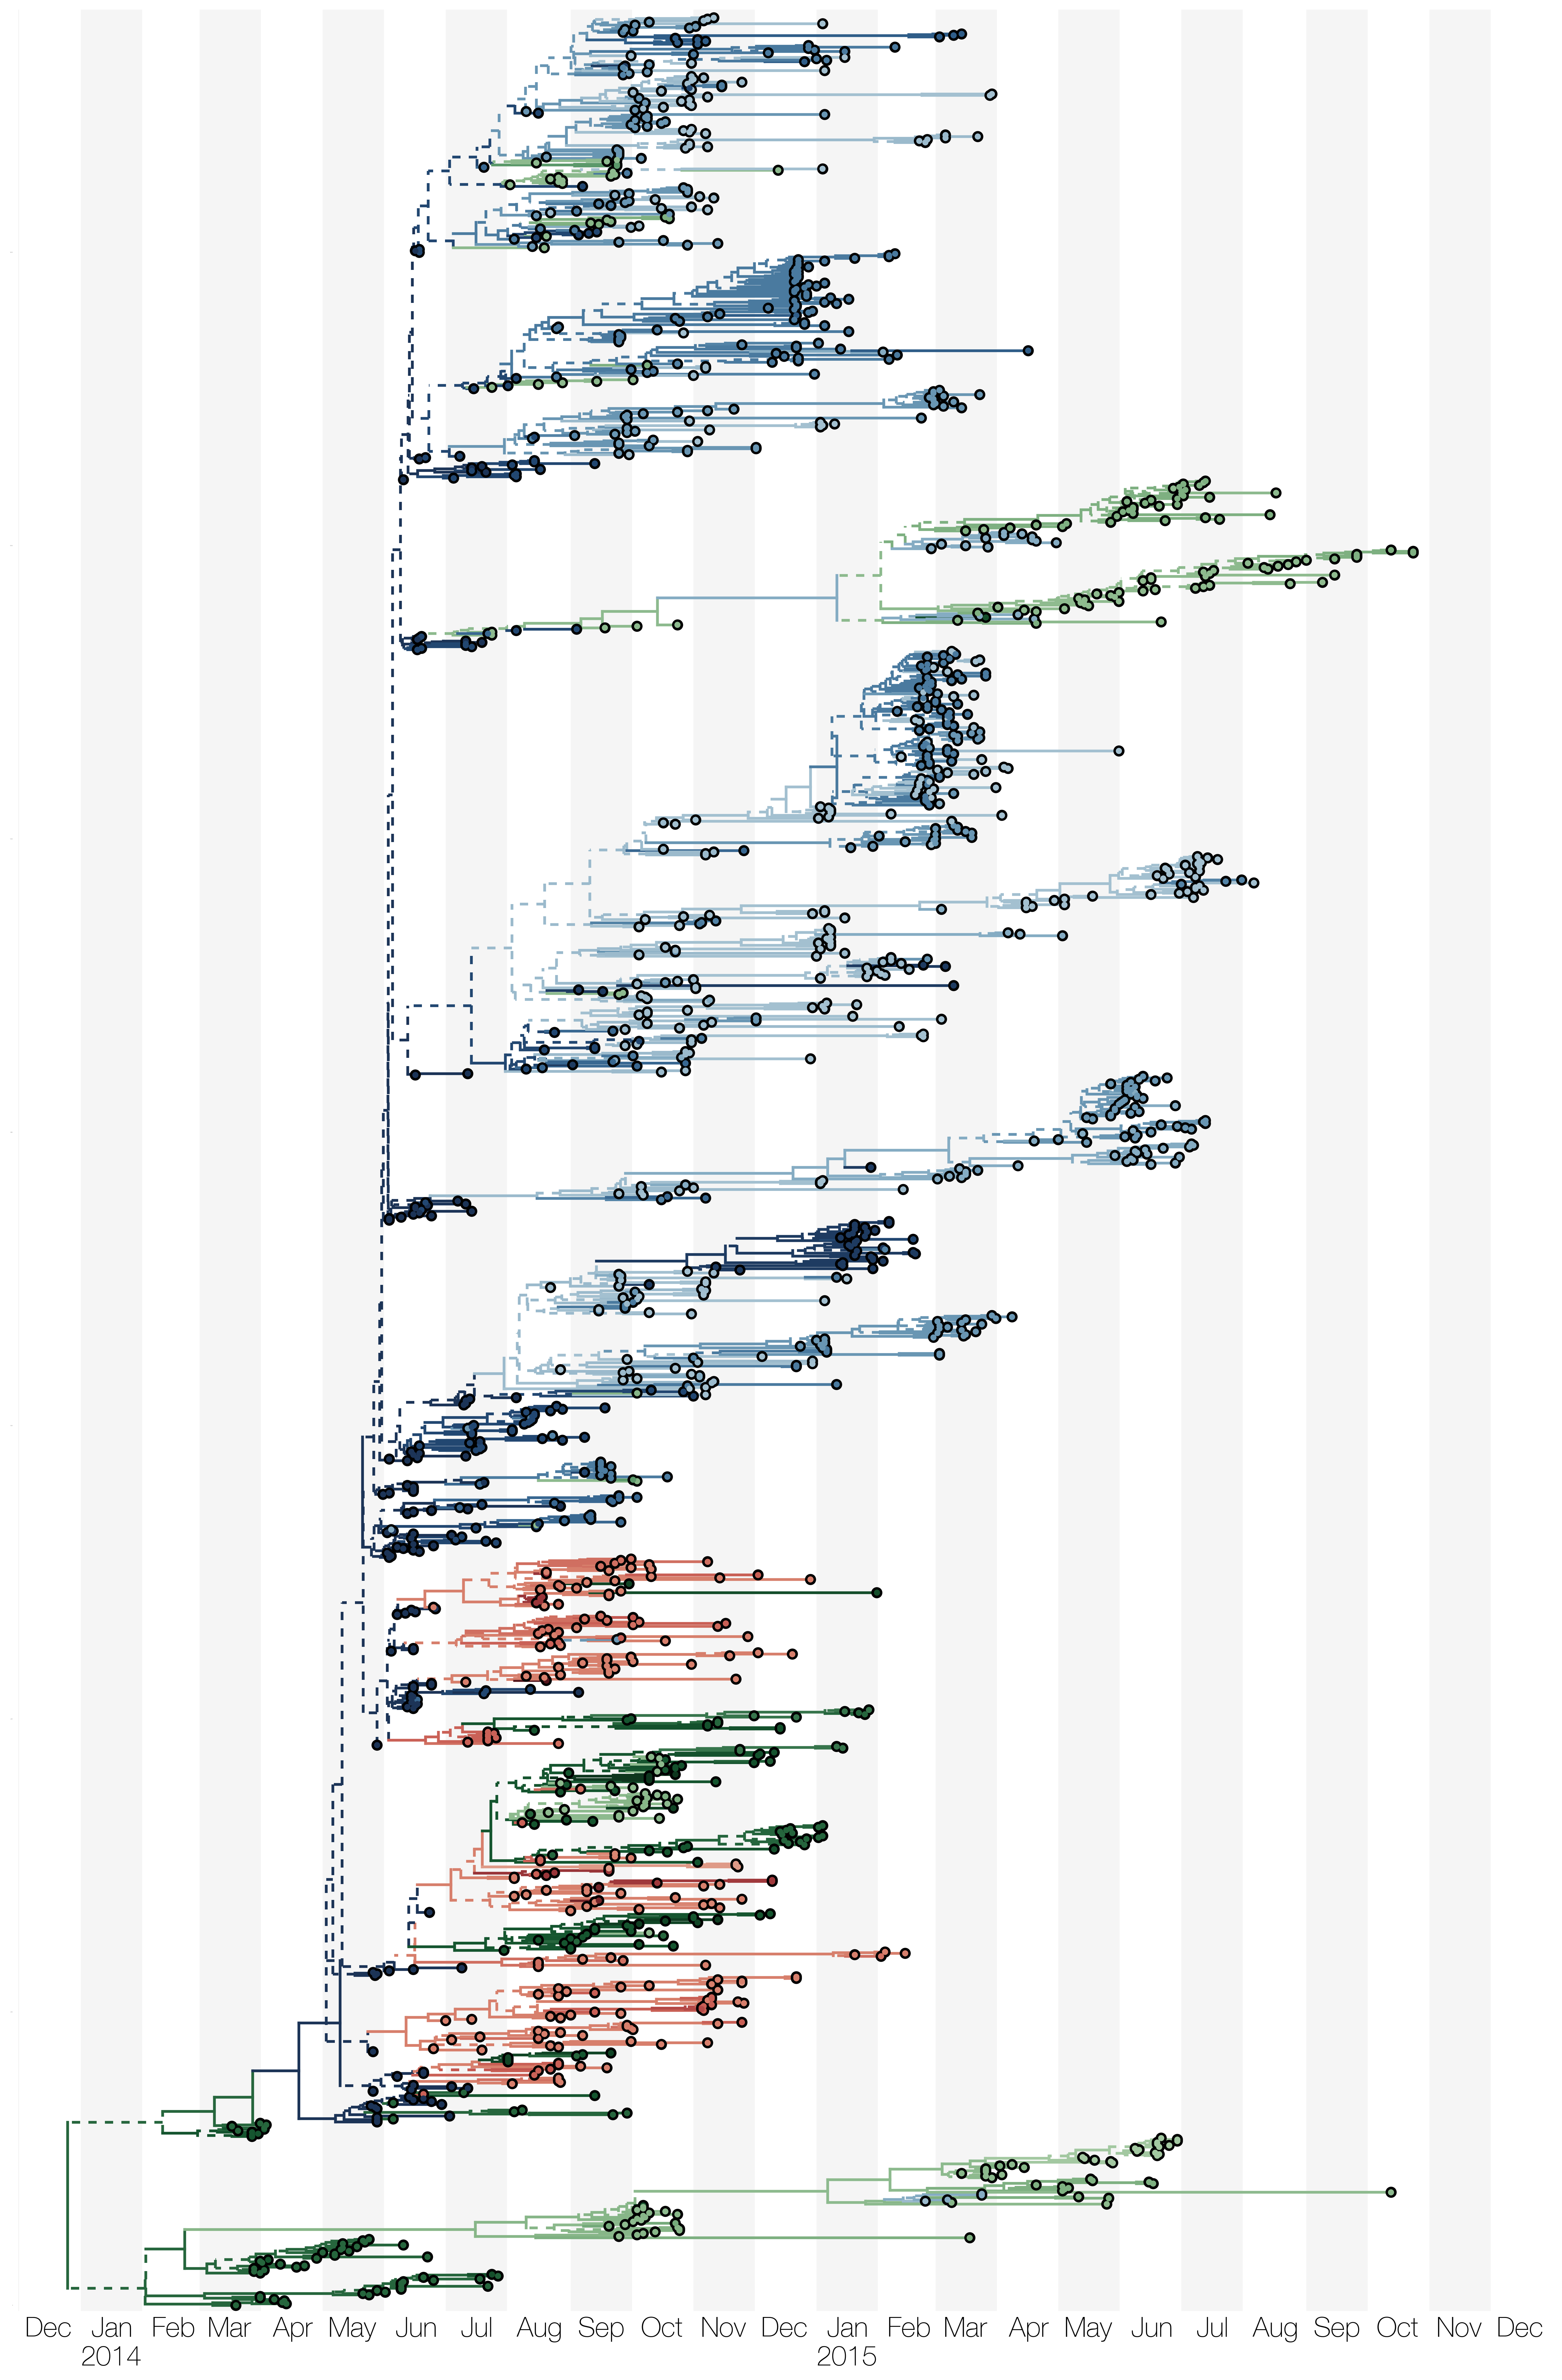
To follow up on that - here’s the maximum clade credibility (MCC) tree coloured by district (Sierra Leone in blue, Guinea in green, Liberia in red), depending on where the population centroid falls within the country along an east-to-west gradient. Branches that have relatively low support (posterior probability < 0.5) are shown as dashed lines.
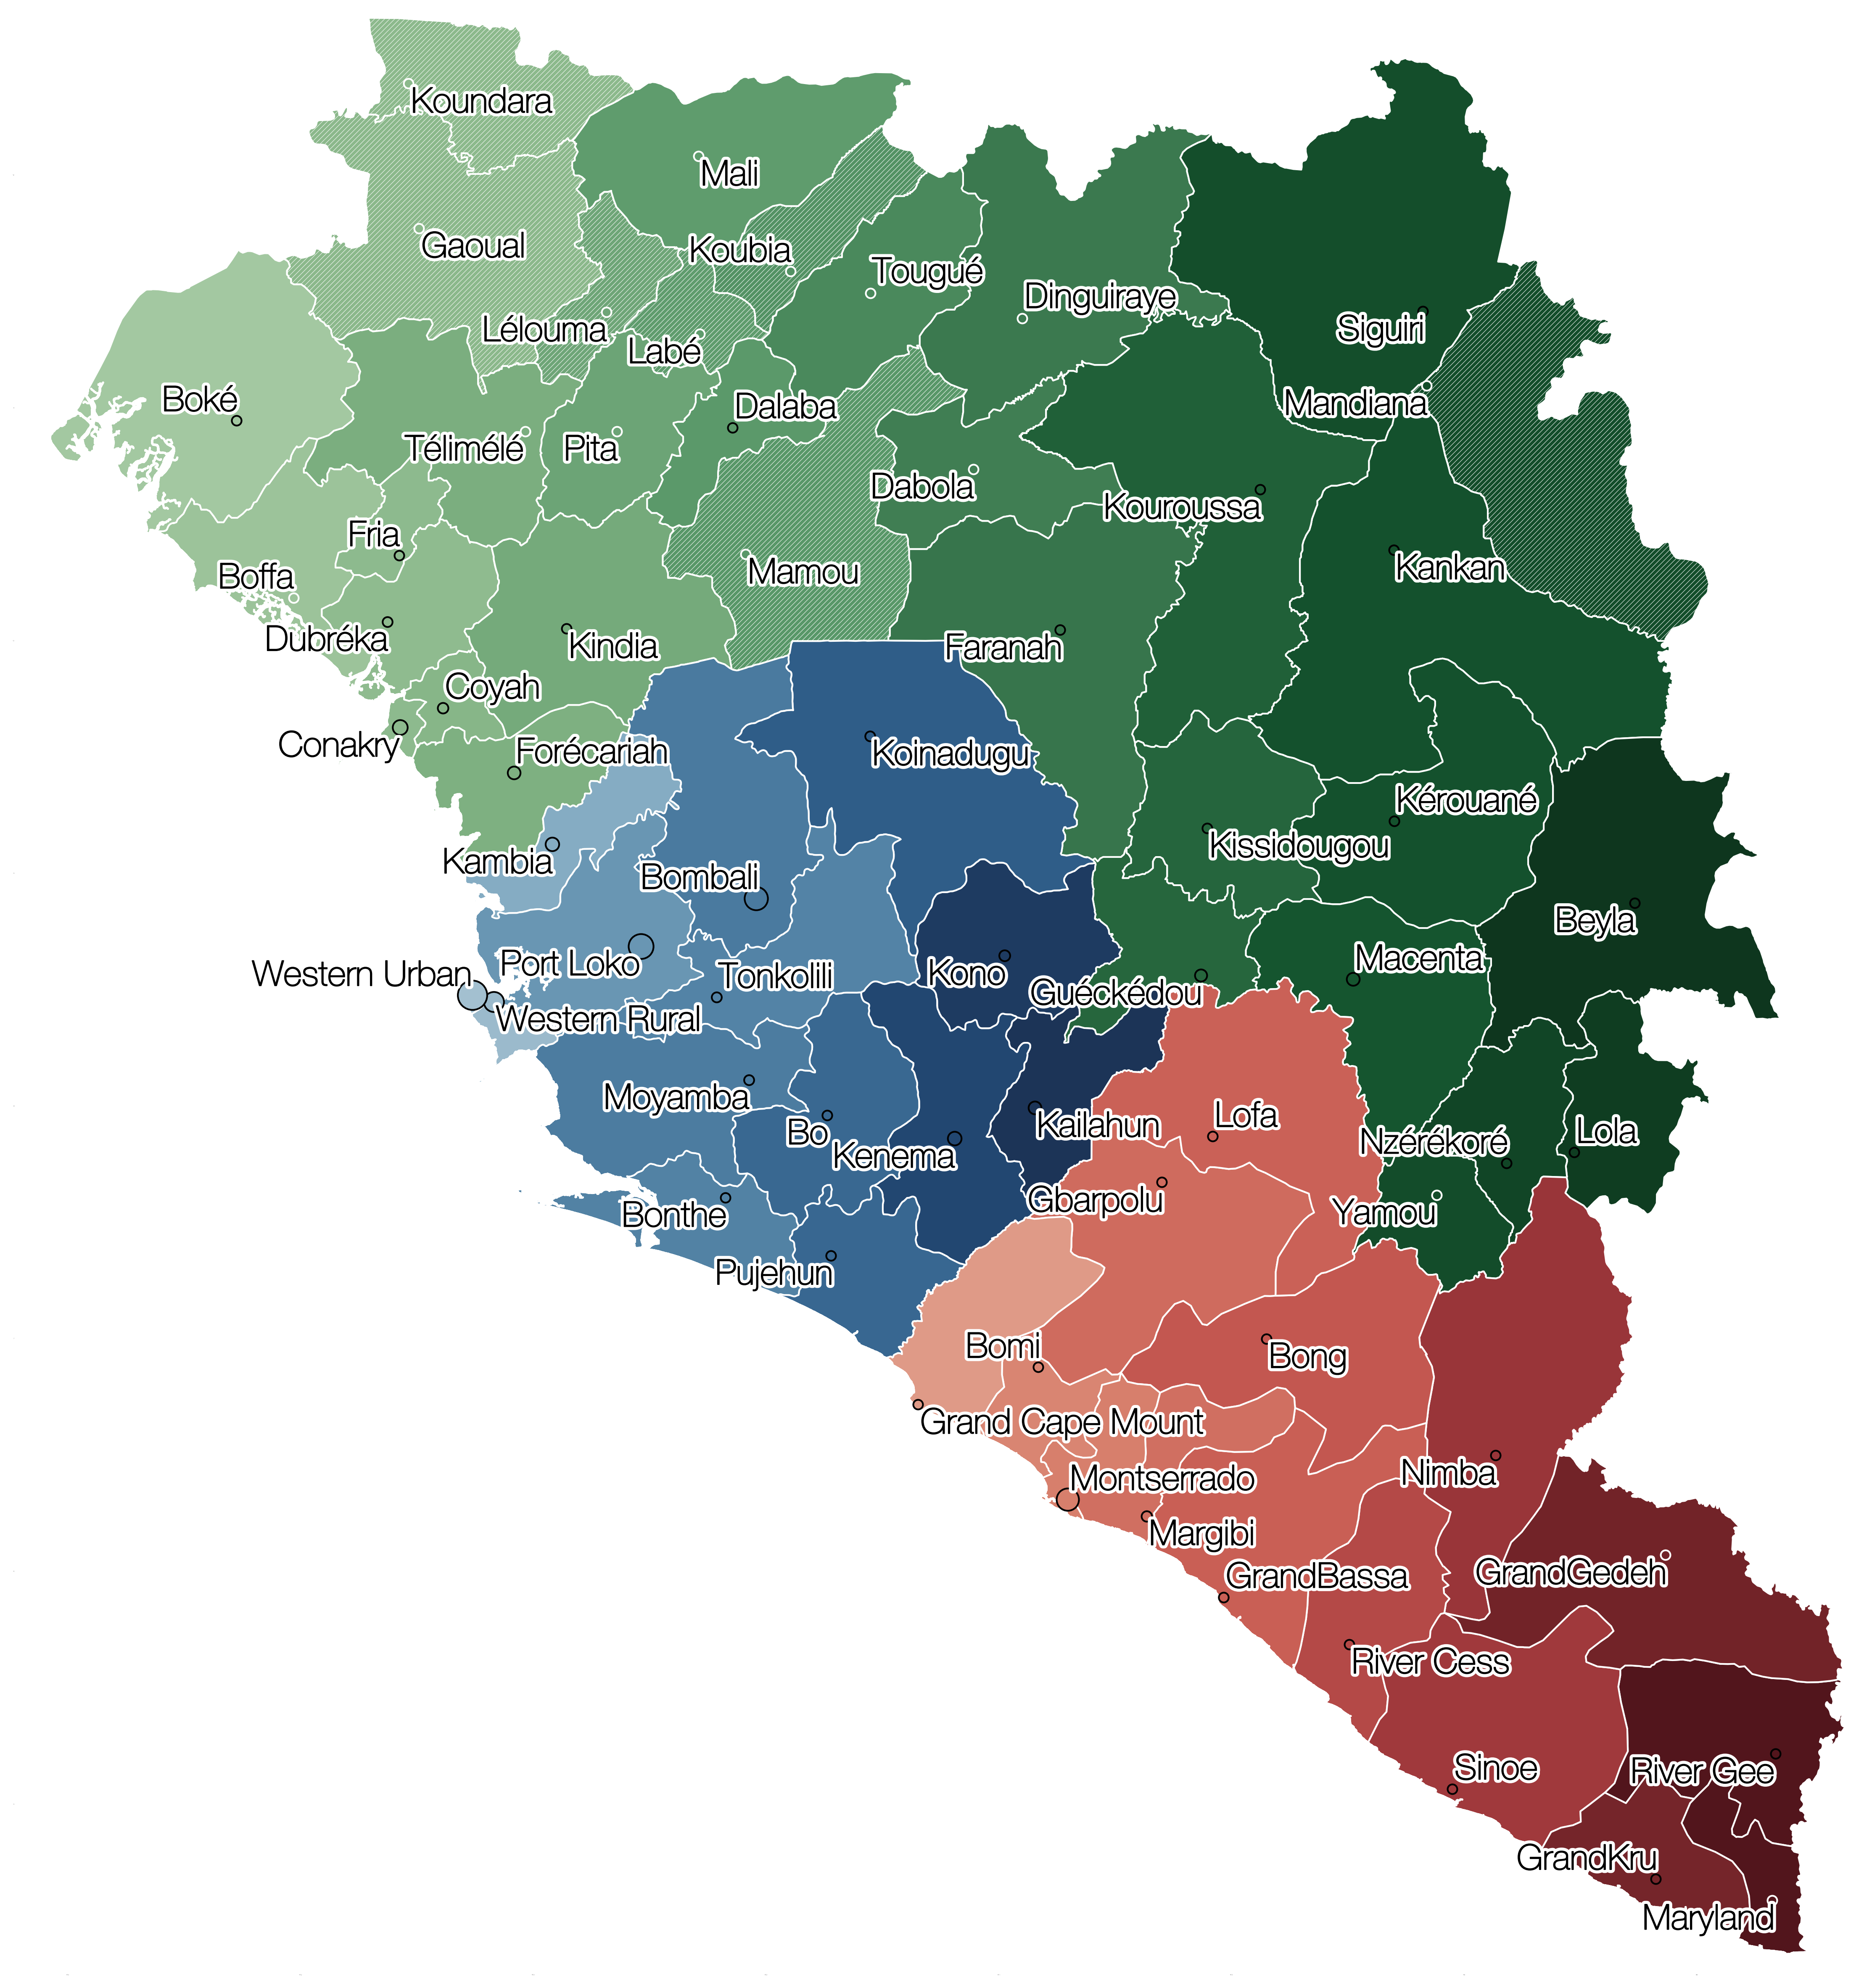
This is a map to decode locations in the tree. Districts with white hatching indicate locations that did not report or were not suspected to have cases of EBOV by the WHO. Circle size at population centroids indicate how much inferred cumulative time EBOV lineages have spent in that location. Circles outlined in white indicate locations where no Ebola virus sequences were sampled.
To evogytis. Looking at the maximum clade credibility (MCC) tree colored by district (Sierra Leone in blue, Guinea in green, Liberia in red) I notice that in March 2014 there are 3 branches (which may be consistent with March 2014 Epi data; but I need to check and compare with the samples that have been sequenced):
2 branches seems to have a similar origin end of January or beginning of February 2014
the 3 branches seems to have one origin end of December 2013; these findings may be consistent with the hypothesis that the whole outbreak started in Meliandou. But could be consistent with two different introductions in the human population: correct?
How solid are the dates for the roots?
Thanks,
Pierre
We infer Gueckedou as the most probable origin of the root (posterior probability = 0.96), but our analyses are too coarse (geographically speaking) to assess whether a smaller subdivision of the prefecture is the location of the original reservoir-to-human host jump. Meliandou is in Gueckedou prefecture, however.
The split into two lineages near the root of the tree simply reflects the unsampled diversity of the virus in time. Lineages can be diverging in time without accumulating mutations. The earliest sequences we have from Guinea from March 2014 are sufficiently similar to each other and have mutations consistent with a single origin of the entire epidemic, however.
The uncertainty in the age of the root for human outbreak sequences is roughly no older than early October 2013 and no later than mid-February. The mean of the root age distribution is pretty much on top of December 2013/January 2014 boundary. Since December 2013 is the generally accepted date for the beginning of the epidemic I think the tree supports a single introduction scenario too. If there were multiple introductions from the reservoir and we assume a fairly large EBOV population size in the reservoir, which seemed to be the case for Gabon and DRC bats, then we would expect a much older common ancestor for human outbreak lineages.
@evogytis and @Pierre_F I think it’s fair to say that because of lack of sampling in the early days of the outbreak (and from the reservoir), based on the sequence data alone it’s difficult to say whether there was only one ‘spill-over’ event or multiple. Because the reservoir (let’s say bats for the sake of argument, but could be different animal) remains unsampled, a hypothetical scenario that would also be consistent with the data would be e.g. an infected bat in, say, october 2013 starts infecting other bats that then starts infecting people - hence the early diversity we see on the tree could be reflective of (recent) diversity in the bats, and not in humans.
We know from earlier outbreaks, however, that if we sample EBOV from non-human primates (sadly no good data from bats), then the EBOV population is quite diverse (because of older ancestry). So based on those earlier observations, the epidemiological data available from the 2013-2016 EVD epidemic, and the sequence data, I agree with @evogytis that the most parsimonious explanation would be a single introduction. The data is certainly in agreement with this, but unfortunately can’t prove (or disprove) it. One thing we can say with almost certainty, however, is that once this outbreak got going no further spill-over events were observed.
We’ve updated the colour scheme from previous versions. Each branch is coloured by country, as before, but the colour intensity corresponding to location (prefecture/district/county) within the country is now based on principal component 1 of population centroid coordinates (rather than longitude as before). This corresponds quite nicely with a general south-east to north-west gradient in all 3 countries. Here’s the key to the colours in the tree:
Yes, and it could even be intrahost diversity within the individual source animal (likely bat) following a period of chronic carriage/infection. Is much known about genetic diversity of Ebola within individual bats?
Nobody has properly sequenced EBOV from a bat - as in, we only have a few sequenced amplicons (~1kb) from a couple of bats in the literature.
I think it’s definitely tricky - wanna bring that MinION to Sierra Leone and come hunt for some bats with me…? I know @rfgarry would be excited about this and has the setup to make it happen!
It is undoubtedly the huge unanswered question in this whole epidemic. I guess the question is how it should be done that is better than what has been done before. FIeld PCR testing of samples could help but would there be any advantage in field-sequencing?
It’s a good question; field sequencing using a total RNA sequencing method would let you get a census of what pathogens are carried by what populations, i.e. in an unbiased metagenomics way. It might also have better sensitivity for divergent populations of animal viruses that PCR might miss. It would also potentially let you detect both the species and the pathogen by sequencing some of the host DNA (e.g. in poo), which might clue you in a bit more. But it’s true that if it’s hard to find already with trad methods it’s still going to be hard to find this way.
Yup, totally agree on all of these points. However, nothing beats sequencing fresh samples - so much better than having to transport them to a lab or shipping abroad which always causes massive sample loss. So what I’m envisioning is a setup running from the back of a truck - centrifuge, PCR machine, MinION. We’d be able to detect very low-input samples without the risk of sample degradation en-route to the lab.
Uh… do we seriously believe that we’re at a point where you can definitively determine what was inside the bat (infecting it) vs. outside the bat vs. environmental contaminants? Don’t go publishing a “bradyrhizobium correlated with EBOV host switching” paper!
I’ll consider your endeavors lucky if you can just get EBOV genomes from a bat.
Being serious though - lab contamination for pathogen discovery is a genuine concern particularly if that lab has a history of sequencing a particular pathogen or pathogens. This hampers ancient DNA studies massively. Moving it to field could partially alleviate that problem as the workflow and reagents can be entirely one-use and disposable.