Phylogenetic analysis of SARS-CoV-2 genomes
06-Mar-2020
Verity Hill and Andrew Rambaut, University of Edinburgh, Edinburgh, UK
[email protected],[email protected]
This is a brief report following previous Virological posts on the phylogenetic analysis of sequences which have been made publicly available on GISAID or NCBI. It is not intended as academic work and is to provide on-going estimates of key phylodynamic parameters. Acknowledgements and details of genome sequences used in this analysis are given in Table 8 at the end of this document.
Phylogenetic analysis
This analysis uses 116 whole genome viral sequences made available on GISAID and NCBI Genbank platforms. Sequences which were too short, were too error-prone, or were sequenced from the same patient sample as another sequence were omitted. Furthermore, only the sequences of the index cases of each epidemiologically-identified cluster were used in an attempt to mitigate sampling bias.
The most recent sequence (an export to the USA) in this dataset is 23-Feb-2020, and the most recent sequence in the dataset taken from a patient in China is from 08-Feb-2020. This analysis therefore represents the situation a few weeks ago. However, additional sequences from earlier on in the epidemic have been released, providing additional information.
As there is now local transmission in multiple regions, only sequences which were from patients in mainland China, or direct exports from mainland China were used in this analysis.
The phylogenetic tree of the Chinese sequences and direct exports is shown in Figure 1. This tree is a single representative from the full posterior sample and should be interpreted with caution. Branches drawn with paler shades of grey should not be used to infer relationships between sequences as they were present in only a few trees in the posterior sample. The estimates of parameters, below, are made over the full posterior set of trees.
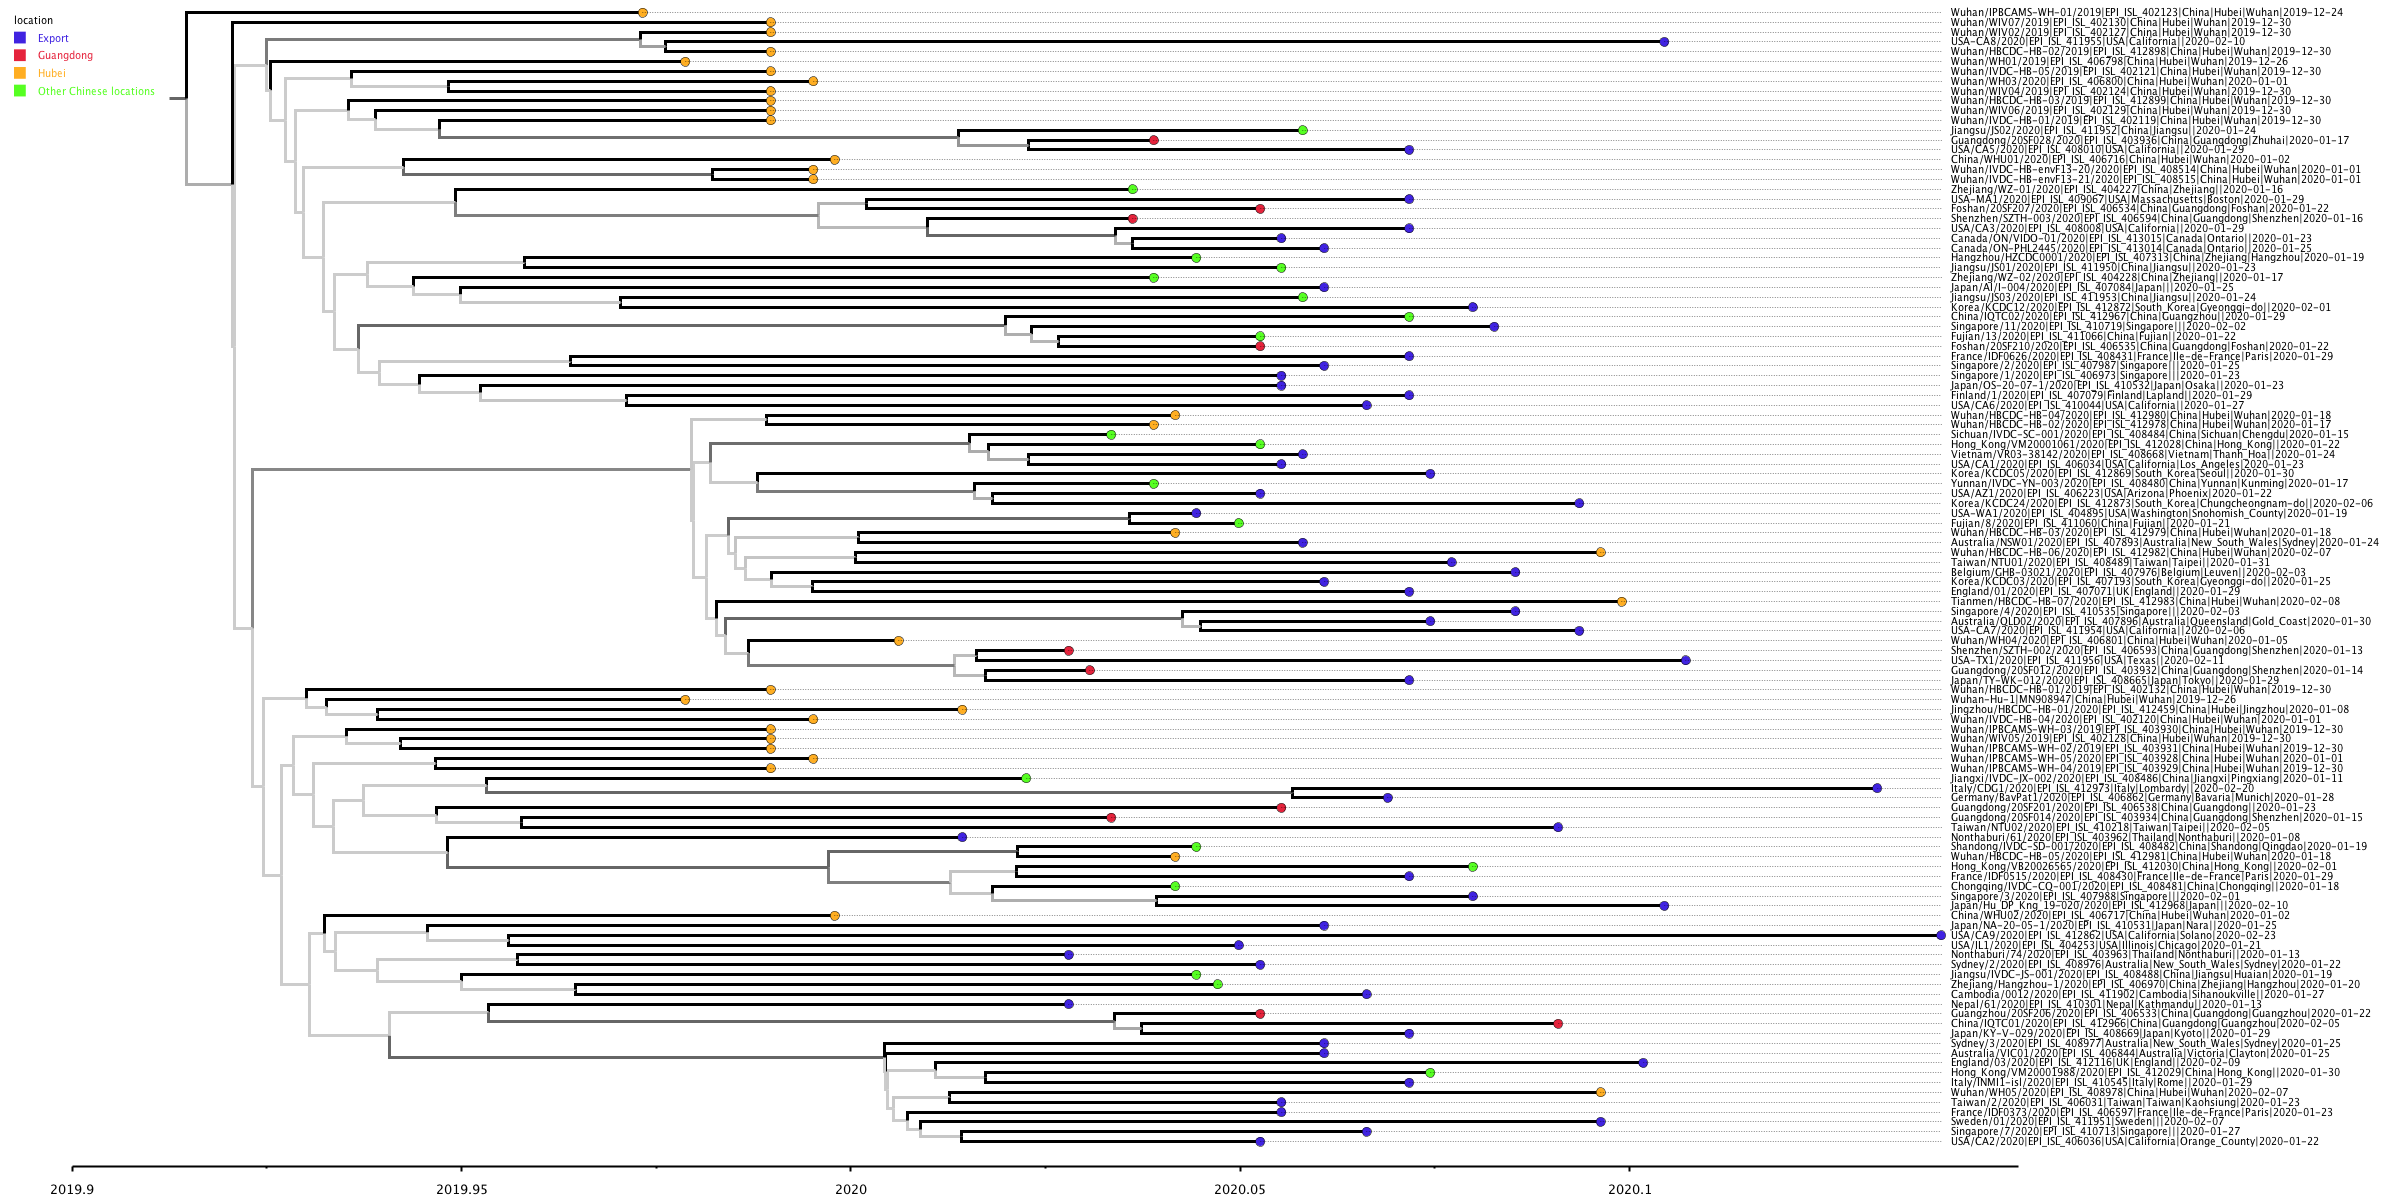
Figure one: MCC tree constructed using BEAST [1,2] and TreeAnnotator under a constant population size coalescent model. Visualised using FigTree. Tips are coloured by location within China, or as “export”. Branches are coloured by confidence in that node, with higher confidence leading to darker branches.
Estimating the date of origin, rate of evolution and growth rate
The software package BEAST [1,2] was used to estimate the date of the most recent common ancestor (MRCA) of the genomes used in the analysis. The MRCA is the point where all of the sampled viruses were in the same host, whether human or non-human, and so its timing can represent when the epidemic began to diverge. Commonly, for zoonoses, this is used to time the spillover of the pathogen from the animal host to the first human case. It can also be used to date introductions into new regions.
Two different variants of the coalescent model as the tree prior has been used: the constant size model, and exponential growth model. However, as there is strong evidence that the epidemic is growing, only the latter is reported. The former is available on request.
| Data | Coalescent model | Estimated rate | 95% interval |
|---|---|---|---|
| 12-Feb, 75 genomes | Exponential growth | 0.92x10⁻³ | 0.33x10⁻³ – 1.46x10⁻³ |
| 24-Feb, 86 genomes | Exponential growth | 0.80x10⁻³ | 0.14x10⁻³ – 1.31x10⁻³ |
| 04-March, 116 genomes | Exponential growth | 1.04x10⁻³ | 0.71x10⁻³ – 1.40x10⁻³ |
Table 1: estimated rate of evolution (substitutions per site per year) of sampled SARS-CoV-2 genomes
| Data | Coalescent model | Estimated MRCA | 95% interval |
|---|---|---|---|
| 12-Feb, 75 genomes | Exponential growth | 29-Nov-2019 | 28-Oct-2019 – 20-Dec-2019 |
| 24-Feb, 86 genomes | Exponential growth | 17-Nov-2019 | 27-Aug-2019 – 19-Dec-2019 |
| 04-March, 116 genomes | Exponential growth | 03-Dec-2019 | 16-Nov-2019 – 17-Dec-2019 |
Table 2: Estimated most recent common ancestor (MRCA) of the sampled SARS-CoV-2 genomes
| Data | Growth rate (/year) | 95% interval | Doubling time (days) | 95% interval |
|---|---|---|---|---|
| 12-Feb, 75 genomes | 41.03 | 20.56 – 62.17 | 6.2 | 4.1 – 12.3 |
| 24-Feb, 86 genomes | 35.38 | 15.49 – 53.47 | 7.2 | 4.7 – 16.3 |
| 04-March, 116 genomes | 37.40 | 24.58 – 51.01 | 6.8 | 5.0 – 10.3 |
Table 3: Estimated growth rate and doubling time
Interpretation
The earliest reported date of symptom onset was the 1st December 2019 [3], from the cluster of cases connected to the Wuhan Seafood market, although this first case is reported as having no known connection to the market or any other known case. The date of the MRCA of the tree is consistent with a jump to humans from the second half of November to the first half of December.
Appendix
Priors used in exponential growth model analysis:
| Parameter | Prior |
|---|---|
| Evolutionary rate | CTMC rate reference prior |
| Kappa | logNormal[1.0,1.25] |
| Frequencies | dirichlet[1.0,1.0] |
| Alpha | exponential[0.5] |
| Population size | logNormal[1.0,2.0] |
| Growth rate | laplace[100] |
Previous estimates of evolutionary rates for human coronaviruses
The time of the most recent common ancestor (MRCA) depends on the rate of evolution. The estimate reported is generally compatible with estimates made for other human coronaviruses.
| Virus | Estimated rate | Reference |
|---|---|---|
| SARS-CoV | 0.80 - 2.38 | Zhao et al. 2004 [4] |
| MERS-CoV | 0.63 [0.14-1.1] | Cotten et al. 2014 [5] |
| 1.12 [0.88-1.37] | Cotten et al. 2014 [6] | |
| 0.96 [0.83-1.09] | Dudas et al. 2018 [7] | |
| HCoV-OC43 | 0.43 [0.27 - 0.60] | Vijgen et al. 2005 [8] |
References
- Drummond AJ, Suchard MA, Xie D, Rambaut A. Bayesian Phylogenetics with BEAUti and the BEAST 1.7. Mol Biol Evol. 2012;29: 1969–1973.
- Suchard MA, Lemey P, Baele G, Ayres DL, Drummond AJ, Rambaut A. Bayesian phylogenetic and phylodynamic data integration using BEAST 1.10. Virus Evol. 2018;4: vey016.
- Huang C et al. Clinical features of patients infected with 2019 novel coronavirus in Wuhan, China. Lancet 2020; https://doi.org/10.1016/S0140-6736(20)30183-5
- Gill M., Lemey P., Faria N., Rambaut A., Shapiro B., Suchard M., Improving Bayesian population dynamics inference: a coalescent-based model for multiple loci Mol Biol Evol. 2013;30:713-724
- Zhao Z, Li H, Wu X, Zhong Y, Zhang K, Zhang Y-P, et al. Moderate mutation rate in the SARS coronavirus genome and its implications. BMC Evol Biol. 2004;4: 21.
- Cotten M, Watson SJ, Kellam P, Al-Rabeeah AA, Makhdoom HQ, Assiri A, et al. Transmission and evolution of the Middle East Respiratory Syndrome Coronavirus in Saudi Arabia: a descriptive genomic study. Lancet. 2013;382: 1993–2002.
- Cotten M, Watson SJ, Zumla AI, Makhdoom HQ, Palser AL, Ong SH, et al. Spread, Circulation, and Evolution of the Middle East Respiratory Syndrome Coronavirus. MBio. 2014;5: e01062–13.
- Dudas G, Carvalho LM, Rambaut A, Bedford T. MERS-CoV spillover at the camel-human interface. Elife. 2018;7. doi:(http://dx.doi.org/10.7554/eLife.31257 7)
- Vijgen L, Keyaerts E, Moës E, Thoelen I, Wollants E, Lemey P, et al. Complete genomic sequence of human coronavirus OC43: molecular clock analysis suggests a relatively recent zoonotic coronavirus transmission event. J Virol. 2005;79: 1595–1604.
Genome Data Acknowledgements
Table eight: nCoV2019 genome sequences used in this analysis, the GISAID accession numbers and submitting labs.