nCoV's relationship to bat coronaviruses & recombination signals (no snakes) - no evidence the 2019-nCoV lineage is recombinant

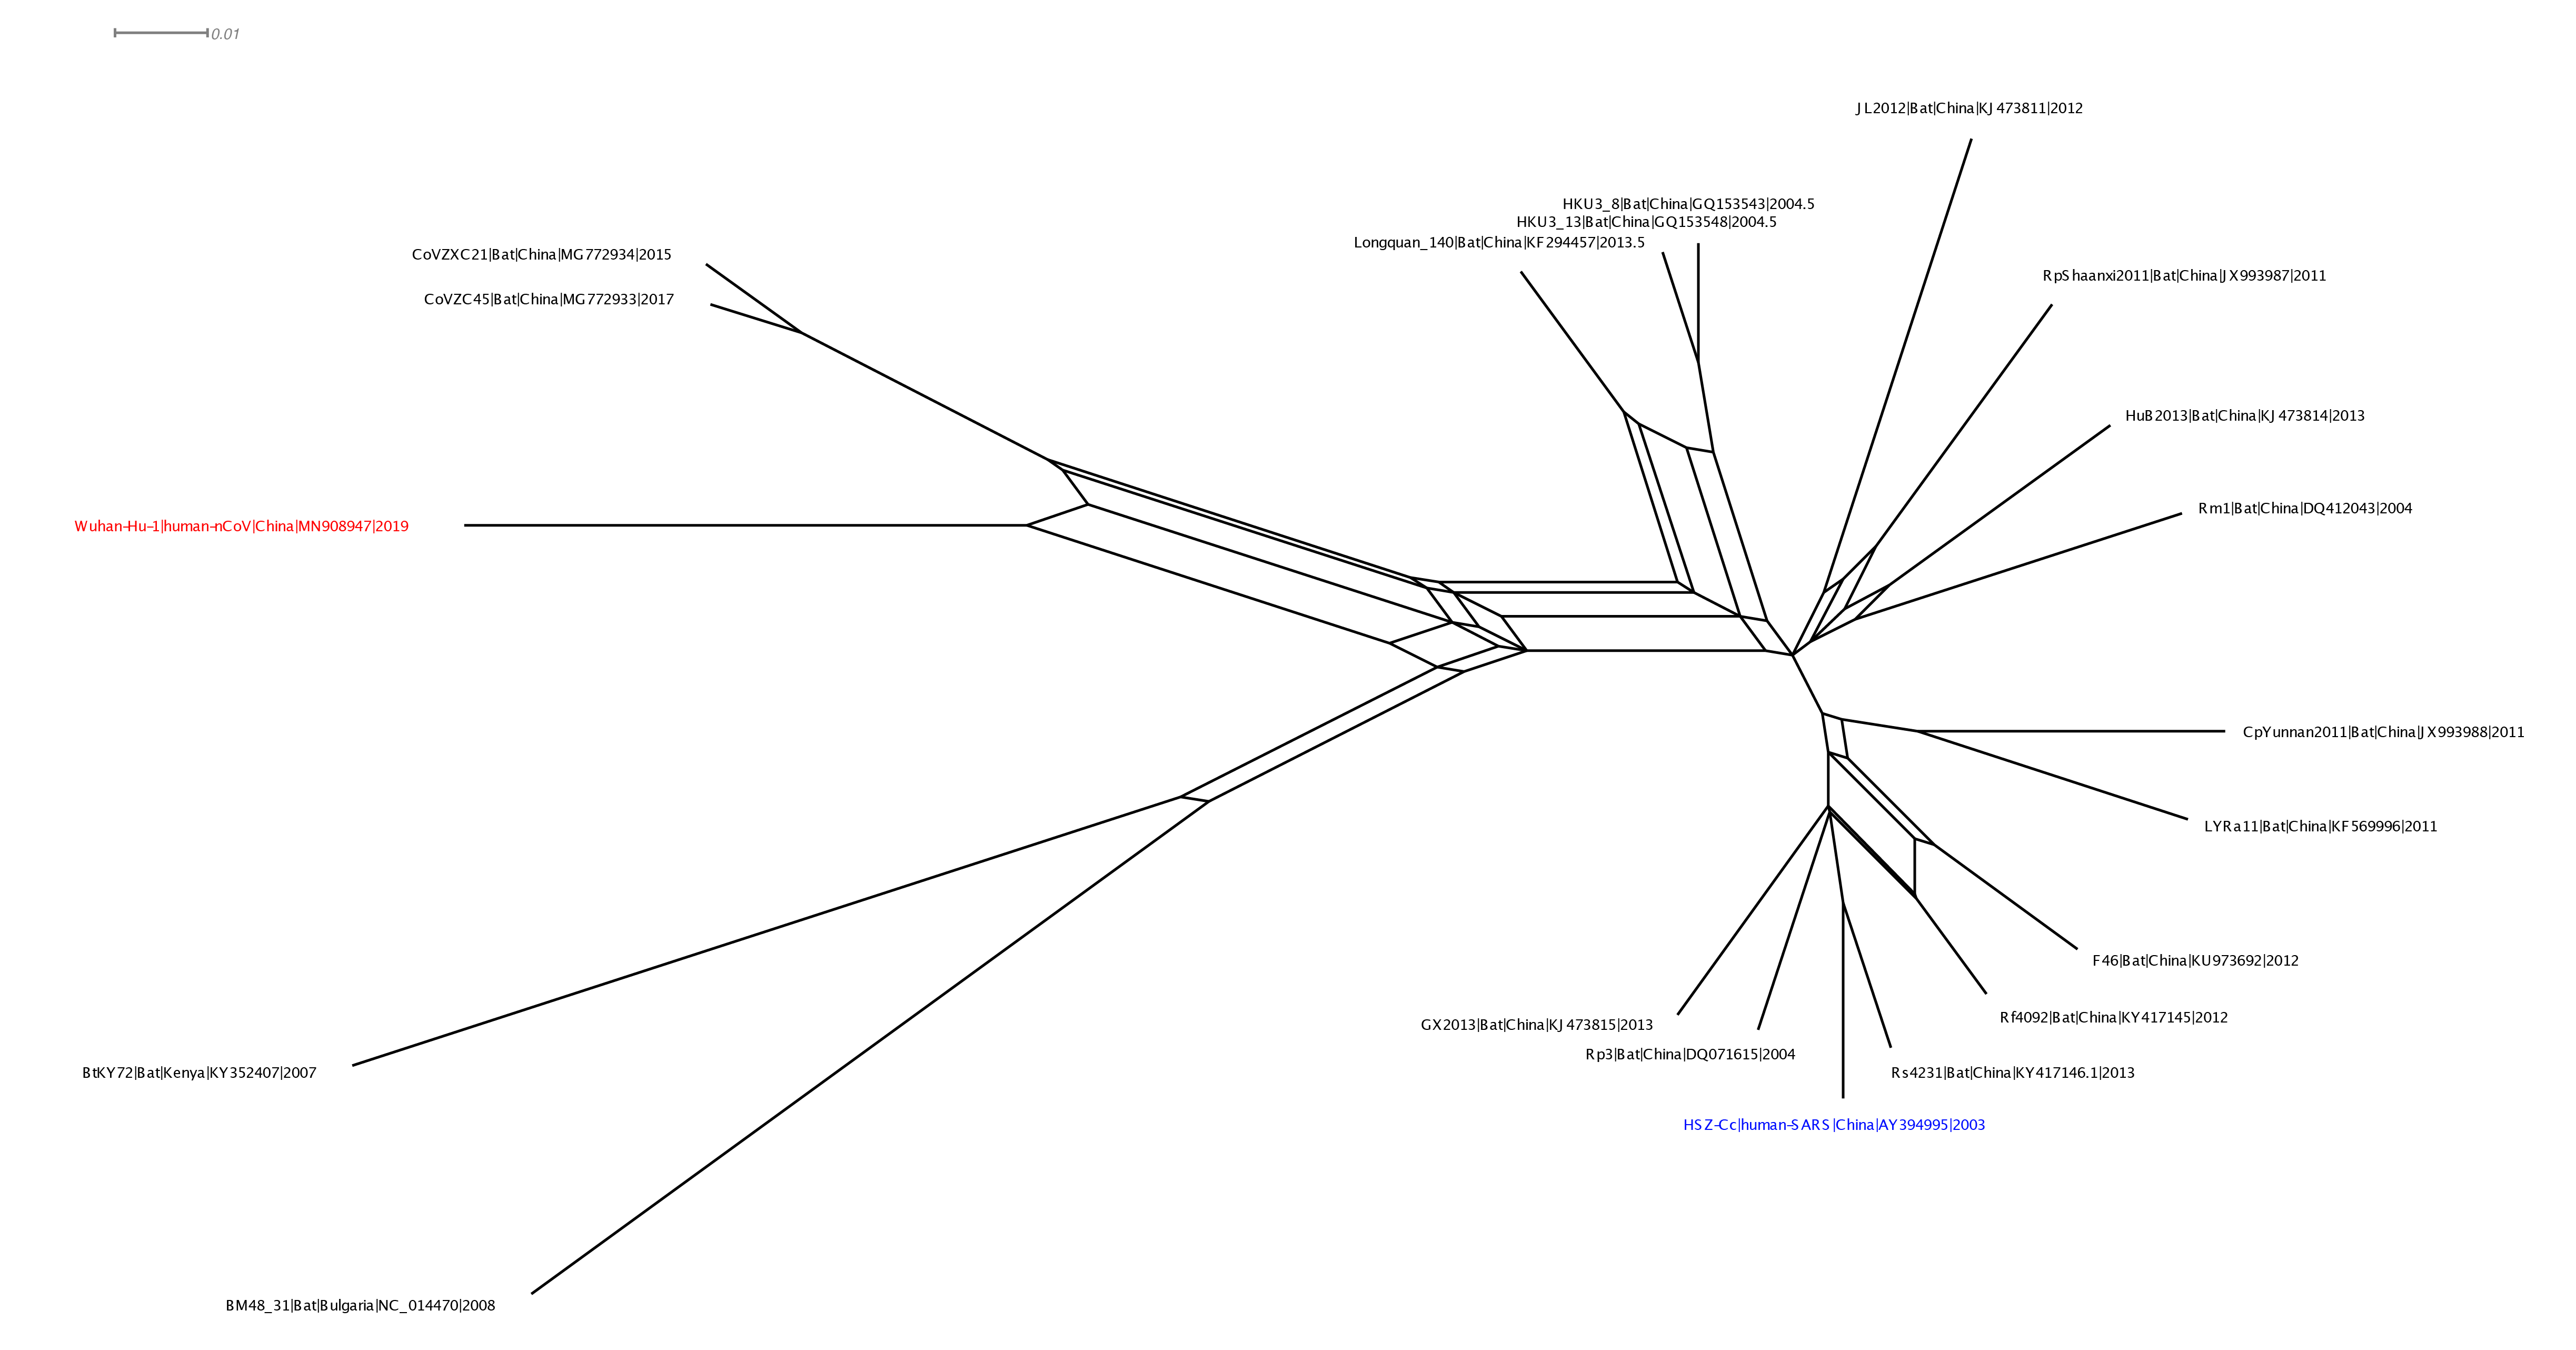
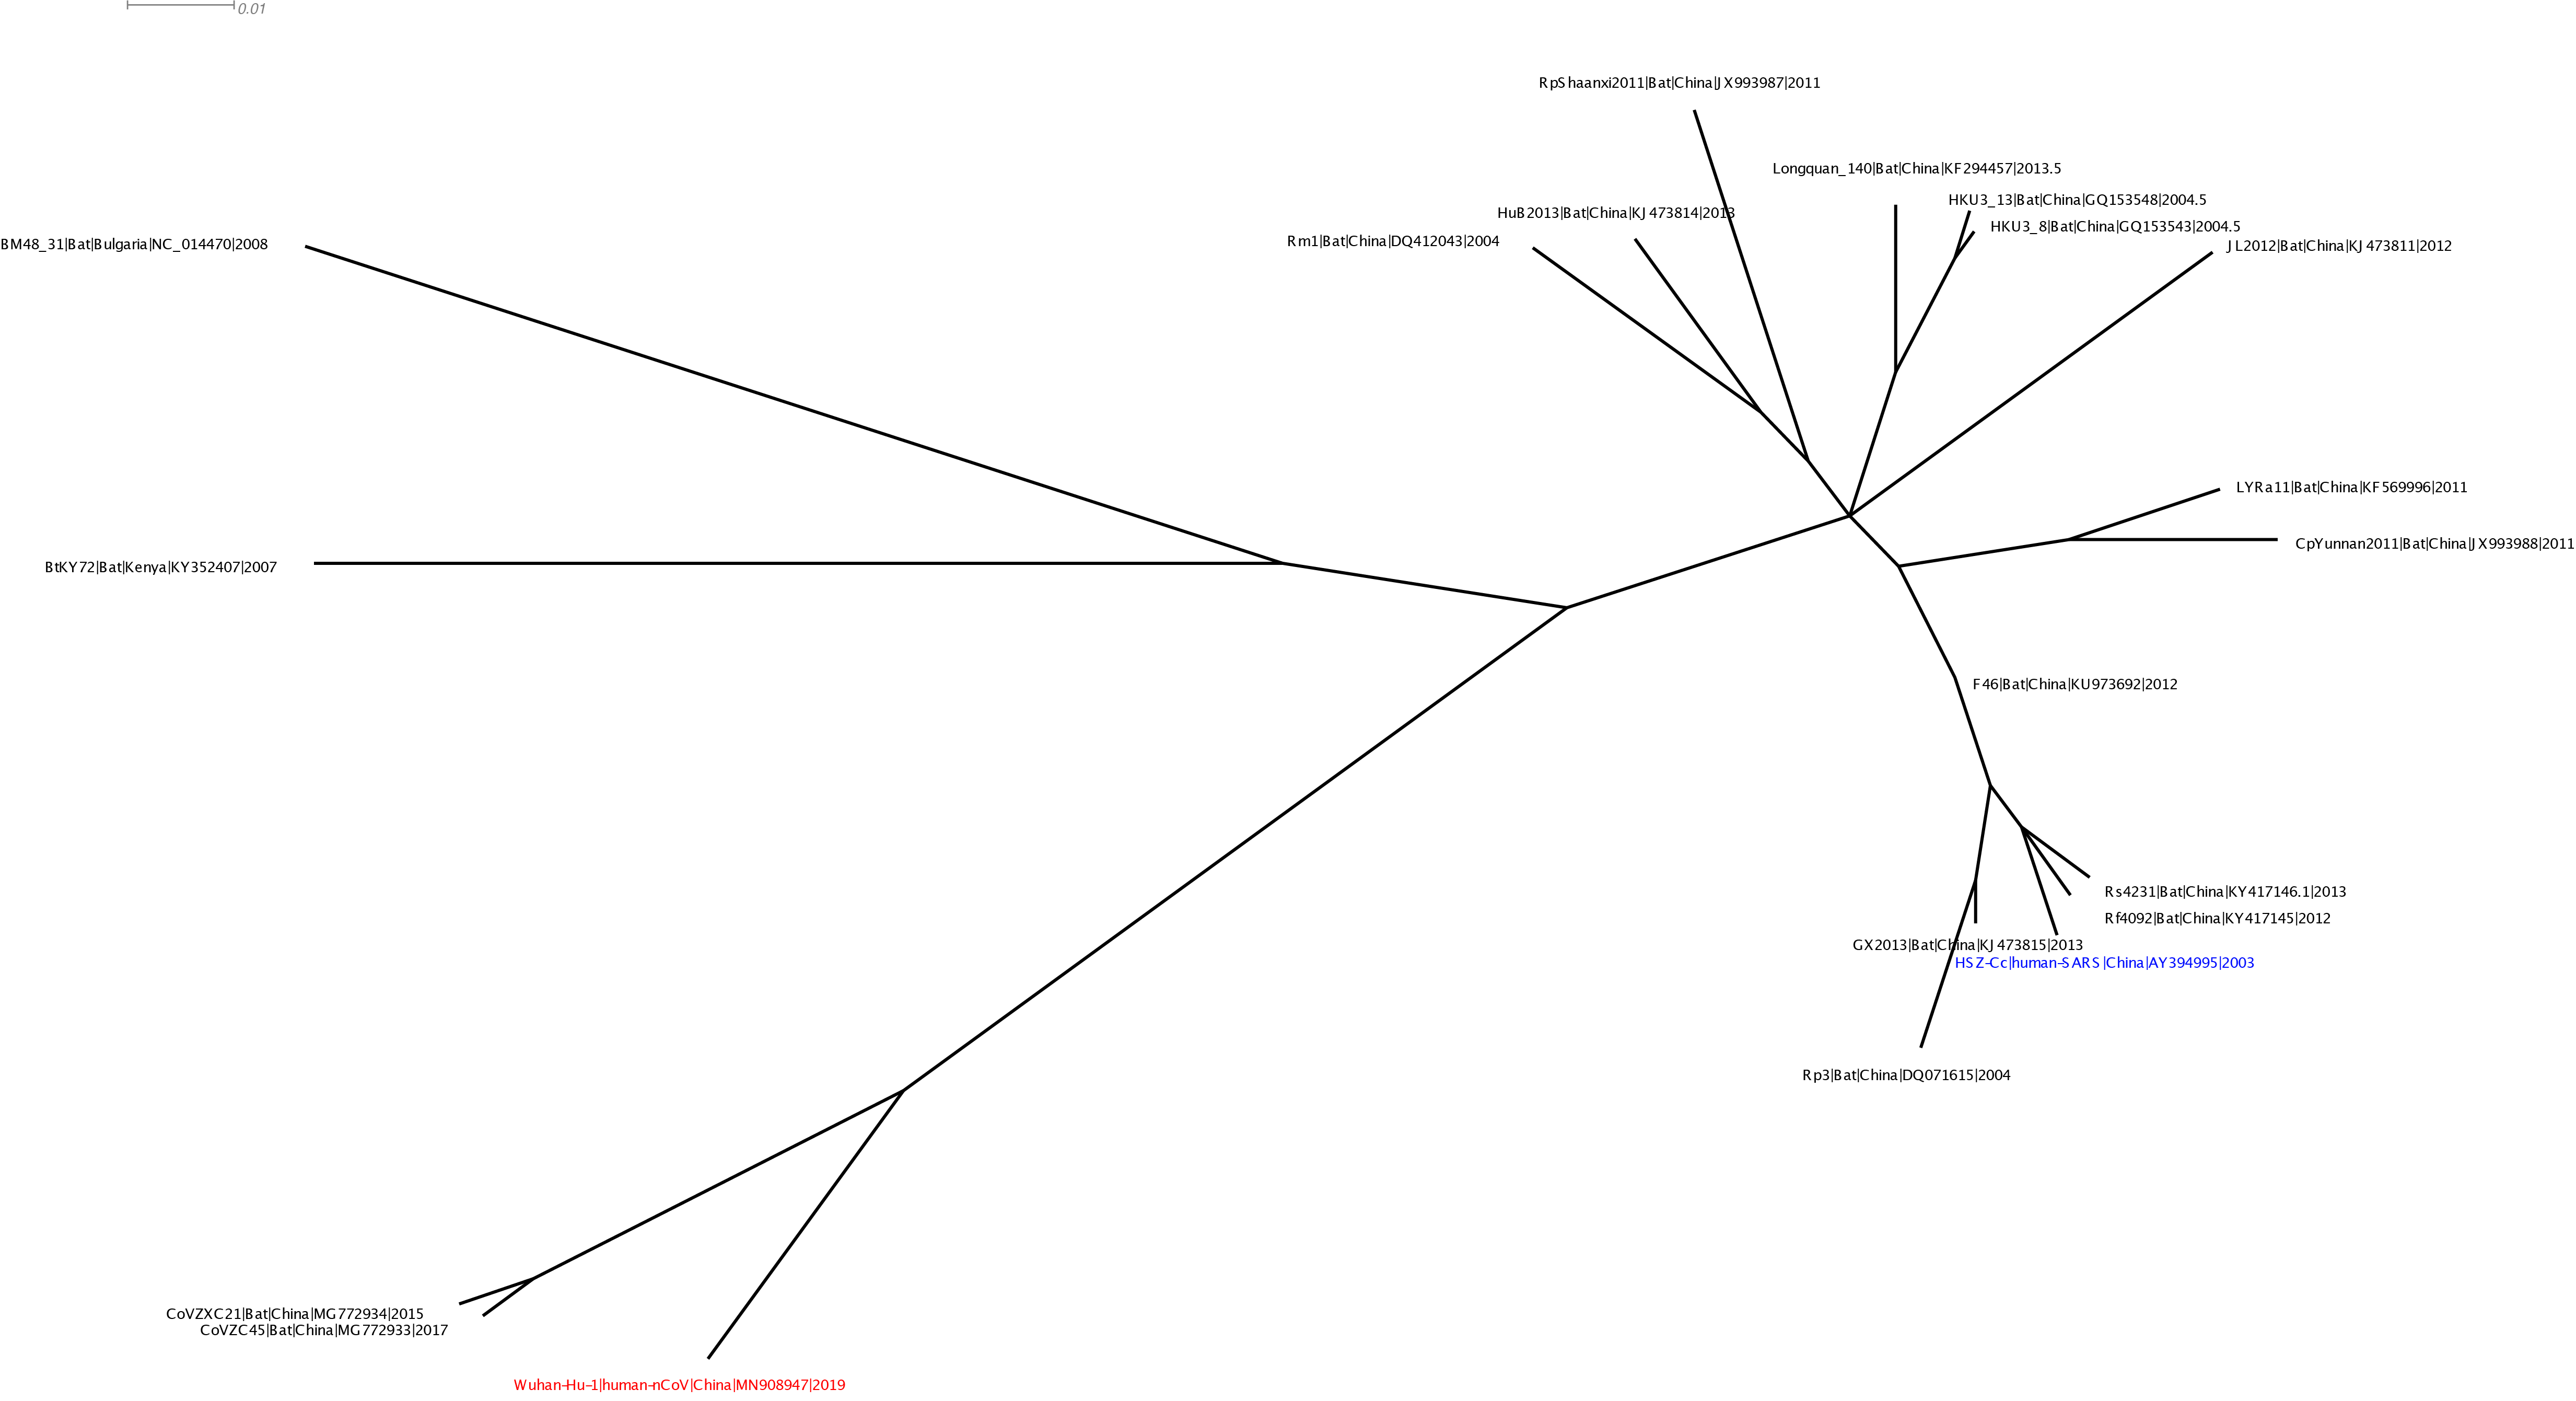
With Xiaowei Jiang at XJTLU we’ve carried out a preliminary evolutionary analysis to characterise the evolutionary origins of the Wuhan virus, nCoV. Focus of our analysis is on the Wuhan-Hu-1 virus (accession no. MN908947, released on GenBank by Shanghai Public Health Clinical Center and School of Public Health, Fudan University, Shanghai, China) as all nCoV cluster together so will share the same evolutionary ancestry. It’s clear from phylogenetic analysis the new human virus is most closely related to bat coronaviruses in the Betacoronaviruses genera. While this is apparent from both the previously reported BLAST and full-genome phylogenetic analysis the closest related bat viruses (CoVZC45 and CoVZXC21) are in fact recombinants with shared breakpoints either side of ORF1b:

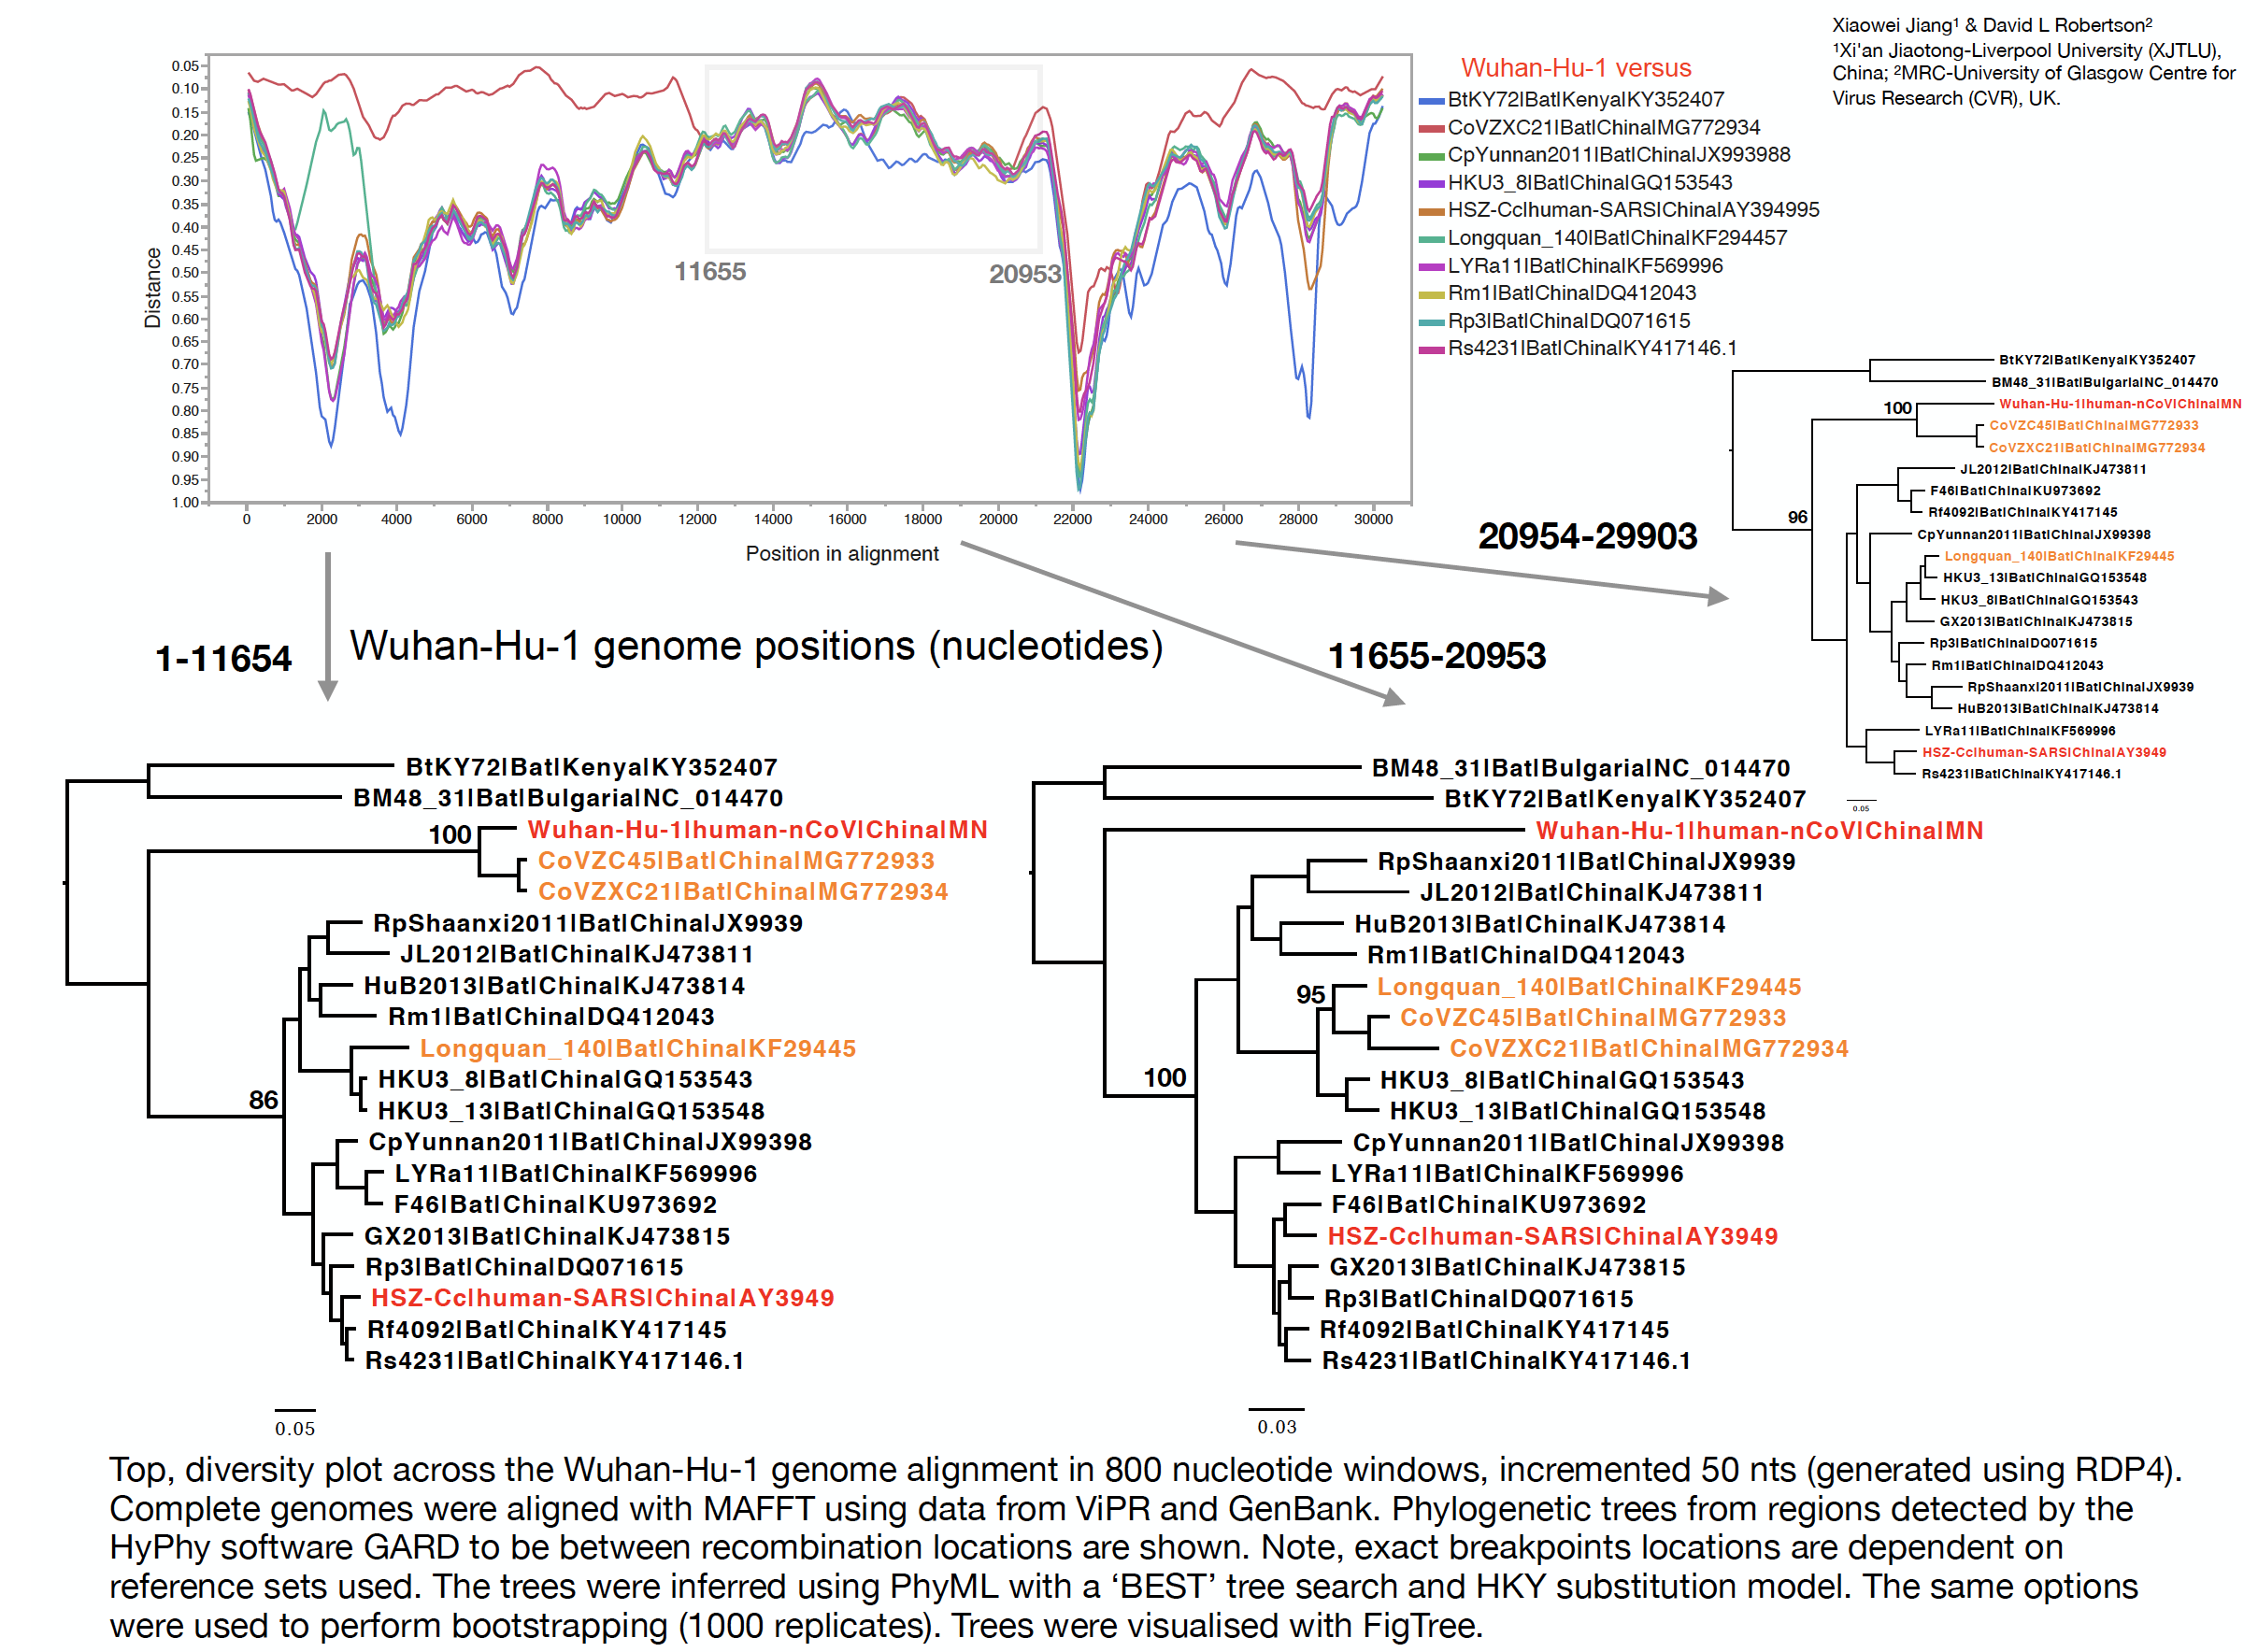
The phylogenetic clustering of the Wuhan-Hu-1 virus is consistently as a sister group to the SARS-related bat coronaviruses. Interestingly, a third bat coronavirus (Longquan_140) is a recombinant involving the Wuhan virus lineage in part of ORF1a.

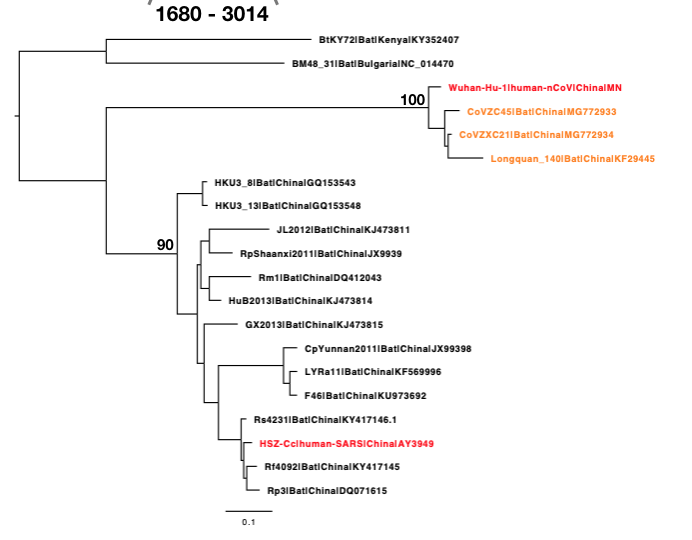
This analysis has detected three bat coronavirus recombinants (two with shared breakpoints) involving the nCoV lineage indicating greater diversity in the Chinese Sarbecovirus group than previously appreciated. The clustering of the related Sarbecovirus viruses from Kenya and Europe suggest the Wuhan virus is still part of the Sabecovirus sub-genre, and these recombination events probably occurred in bats. Although. given the propensity of coronaviruses to switch hosts, involvement of another species cannot be discounted. There is also a very good chance that a non-bat intermediate species is responsible for the beginning of the current outbreak in Wuhan. Given the tight clustering of the nCoV viruses in phylogenetic trees it seems most likely one event has occurred.

Several of these bat coronaviruses have been previously detected to be recombinant under-scoring the importance of doing appropriate analysis when analysing these viruses using phylogenetic methods. Recombination, in this case between divergent coronaviruses circulating in bats, violates our assumption of a single evolutionary tree and so needs to be considered carefully when inferring coronavirus evolution from complete genome alignments. We’re looking into the patterns of breakpoints to see if there’s any clues to the significance (or not) of these recombination events.

We’d like to thank the researchers and health professionals for making the nCoV data available. Credit also needs to be given to the surveillance projects for generating the data that is now available for comparison and to the software developers for making the tools we’ve used freely available: FigTree, available at: FigTree; GARD, available at http://www.hyphy.org; MAFFT, available at MAFFT - a multiple sequence alignment program; PhyML, available at ATGC: PhyML; and RDP4, available at ATGC: PhyML.

5 Likes

Note, Spike is at positions 21717 to 25693 in our diversity plot and recombination analysis so to the right of the recombination breakpoint in the bat viruses CoVZC45 and CoVZXC21. In a Spike phylogeny nCoV clusters with these bat viruses. There is no evidence of snakes being involved as incorrectly reported here https://onlinelibrary.wiley.com/doi/abs/10.1002/jmv.25682!

Hi David
Thanks for sharing this. Interesting dive into the hidden world of these viruses in their reservoir (presumably). I guess there will be insufficient sampling of bat viruses do dabble at when this may have occurred?

Would also like to hear your opinion on the "snake"paper. I see it criticised but am not familiar enough with the specific analyses to make a real assessment.

Marion

Yes there’s a reasonable set of bat viruses relatively closely related to SARs. Interestingly the nCoV lineage appears to be a sister group to these and its the SARS-related bat viruses that have picked up part of this lineage (at least on two occasions) in our analysis. This would suggest there’s more diversity than currently detected and these viruses are most probably in bats. We can’t, however, conclude anything about intermediate host from this analysis.

On the ‘snake paper’ they’ve correctly detected there’s recombination in the data set but then get the breakpoint wrong. If you look in our diversity plot across the Spike region (21717 to 25693) although it’s harder to call which virus is closest due to the increase in diversity, it’s still clear that there’s been a switch back to the bat-coronavirus CoVZXC21 being the closest. However, in their figure they’ve concluded from this that it’s the Spike that’s part of the recombination region, i.e., the breakpoint being to the right, which is not the case and not where the breakpoint is detected by the more sophisticated maximum likelihood method GARD (or other methods in RDP). The bootstrapping method they mention but don’t show is notorious for not detecting breakpoints reliably. Worse they’ve concluded it’s the Wuhan lineage that’s recombinant when in fact it’s the bat viruses that are changing their phylogenetic position and no longer clustering with Wuhan over ORF1b. On their linking the virus codon usage to snakes if you look at their figure 3A, it shows that nCoV and bat virus cluster together but not with snakes so their own analysis doesn’t support this conclusion. There is thus no evidences that snake are involved.

1 Like

Sincere apologies there was an error in the top figure. The tree on the very right from the region 20954 - 29903 was showing the tree from region 1680 - 3014 from further down in the post. This has been updated.

Here’s a CSV file of the “codon usage” table from the JMV paper, in case anyone wants to check it out. Data entry is very calming, I can recommend it. Please let me know if you see any errors.

,beta CoV Wuhan WIV04,bat SL CoV ZC45,Bungarus multicinctus,Naja atra,Marmota,Erinaceus europeaus,manis javanica,Rhonolophus sinicus,Gallus gallus,Homo sapiens
Phe,UUU,1.41,1.33,1.14,1.15,0.94,0.91,0.93,0.99,0.91,0.93
,UUC,0.59,0.67,0.86,0.85,1.06,1.09,1.07,1.01,1.09,1.07
Leu,UUA,1.64,1.38,0.73,0.86,0.46,0.49,0.48,0.56,0.42,0.46
,UUG,1.07,1.19,1.24,1.21,0.77,0.88,0.85,0.87,0.72,0.77
,CUU,1.75,1.78,1.3,1.11,1.11,1,1,1.04,1.05,0.79
,CUC,0.59,0.65,0.78,0.79,1.23,1.17,1.2,0.96,1.14,1.17
,CUA,0.66,0.6,0.5,0.47,0.62,0.63,0.57,0.57,0.6,0.43
,CUG,0.3,0.4,1.45,1.55,1.81,1.83,1.89,2,2.06,2.37
Ile,AUU,1.53,1.58,1.37,1.46,1.09,1.02,1.06,1.28,1.02,1.08
,AUC,0.56,0.57,0.92,0.86,1.27,1.21,1.23,1.25,1.36,1.41
,AUA,0.91,0.85,0.71,0.68,0.64,0.77,0.71,0.47,0.61,0.51
Met ,AUG,1,1,1,1,1,1,1,1,1,1
Val,GUU,1.95,1.89,1.08,1.02,0.89,0.82,0.83,0.87,0.85,0.73
,GUC,0.57,0.55,0.74,0.71,1.04,0.99,1,0.95,1.02,0.95
,GUA,0.9,0.9,0.88,0.71,0.56,0.59,0.56,0.53,0.51,0.47
,GUG,0.58,0.66,1.29,1.56,1.51,1.6,1.61,1.66,1.62,1.85
Ser,UCU,1.96,2.04,1.5,1.43,1.04,1.02,1.02,1.14,0.88,1.13
,UCC,0.47,0.44,0.85,0.81,1.18,1.12,1.16,1.31,1.16,1.31
,UCA,1.66,1.66,1.21,1.16,1.13,1.22,1.15,1,1.13,0.9
,UCG,0.11,0.15,0.17,0.26,0.39,0.4,0.38,0.28,0.41,0.33
,AGU,1.43,1.36,1.35,1.39,0.89,0.86,0.87,0.85,0.93,0.9
,AGC,0.37,0.36,0.91,0.93,1.37,1.38,1.41,1.42,1.5,1.44
Pro,CCU,1.94,1.83,1.7,1.66,1.17,1.08,1.12,1.15,1.05,1.15
,CCC,0.3,0.34,0.57,0.59,1.09,1.09,1.11,1.35,1.12,1.29
,CCA,1.6,1.59,1.51,1.58,1.23,1.27,1.25,1.13,1.02,1.11
,CCG,0.16,0.25,0.21,0.17,0.51,0.56,0.51,0.37,0.81,0.45
Thr,ACU,1.78,1.75,1.3,1.28,1,0.97,0.97,0.96,0.99,0.99
,ACC,0.38,0.44,1.07,1.06,1.25,1.2,1.24,1.39,1.15,1.42
,ACA,1.64,1.58,1.38,1.33,1.29,1.31,1.31,1.15,1.24,1.14
,ACG,0.2,0.24,0.24,0.34,0.47,0.52,0.49,0.5,0.62,0.46
Ala,GCU,2.18,2.13,1.54,1.34,1.15,1.12,1.12,1.25,1.14,1.06
,GCC,0.57,0.55,0.93,0.97,1.24,1.22,1.27,1.59,1.26,1.6
,GCA,1.09,1.09,1.33,1.38,1.12,1.14,1.13,0.93,1.08,0.91
,GCG,0.15,0.24,0.2,0.31,0.48,0.52,0.48,0.24,0.52,0.42
Tyr,UAU,1.22,1.19,1.25,1.21,0.97,0.95,0.94,0.9,1.02,0.89
,UAC,0.78,0.81,0.75,0.79,1.03,1.05,1.06,1.1,0.98,1.11
His,CAU,1.39,1.39,1.19,1.04,0.99,0.95,0.95,1,0.9,0.84
,CAC,0.61,0.61,0.81,0.96,1.01,1.05,1.05,1,1.1,1.16
Gln,CAA,1.39,1.24,0.89,0.94,0.85,0.8,0.75,0.76,0.81,0.53
,CAG,0.61,0.76,1.11,1.06,1.15,1.2,1.25,1.24,1.19,1.47
Asn,AAU,1.35,1.35,1.16,1.06,1,0.94,0.97,0.93,0.92,0.94
,AAC,0.65,0.65,0.84,0.94,1,1.06,1.03,1.07,1.08,1.06
Lys,AAA,1.31,1.2,1.16,1.18,0.99,0.94,0.96,1,0.93,0.87
,AAG,0.69,0.8,0.84,0.82,1.01,1.06,1.04,1,1.07,1.13
Asp,GAU,1.28,1.24,1.32,1.27,0.96,0.93,0.94,1.08,1.02,0.93
,GAC,0.72,0.76,0.68,0.73,1.04,1.07,1.06,0.92,0.98,1.07
Glu,GAA,1.44,1.27,1.15,1.17,1.03,1.01,0.99,0.92,1.04,0.84
,GAG,0.56,0.73,0.85,0.83,0.97,0.99,1.01,1.08,0.96,1.16
Cys,UGU,1.56,1.48,1.03,1,0.9,0.85,0.87,1.14,0.86,0.91
,UGC,0.44,0.52,0.97,1,1.1,1.15,1.13,0.86,1.14,1.09
Trp,UGG,1,1,1,1,1,1,1,1,1,1
Arg,CGU,1.45,1.51,0.42,0.59,0.43,0.41,0.44,0.69,0.66,0.48
,CGC,0.59,0.64,0.48,0.43,0.66,0.67,0.65,0.87,0.82,1.1
,CGA,0.29,0.33,0.66,0.6,0.6,0.55,0.55,0.72,0.71,0.65
,CGG,0.19,0.1,0.67,0.69,0.73,0.79,0.78,1.1,0.99,1.21
,AGA,2.67,2.63,2.29,2.07,2.07,1.97,1.94,1.42,1.46,1.29
,AGG,0.81,0.79,1.47,1.61,1.51,1.61,1.63,1.19,1.36,1.27
Gly,GGU,2.34,2.16,0.99,0.93,0.66,0.63,0.63,0.79,0.7,0.65
,GGC,0.71,0.76,0.75,0.77,1.07,1.09,1.09,1.39,1.03,1.35
,GGA,0.83,0.92,1.59,1.64,1.39,1.33,1.31,1.03,1.29,1
,GGG,0.12,0.16,0.77,0.81,0.88,0.62,0.95,0.88,0.99,1.01

Hi David - do you have your alignment posted somewhere? I will run this through the new 3SEQ (not in RDP4 yet) which can compute exact breakpoints for alignments with >5000 polymorphic sites. New version is here: http://mol.ax/pdf/lam18a.pdf and it has recombination results for MERS-CoV.

Thanks
Maciek

If anyone is interested in doing it the obvious thing to do with respect to the ‘snake’ analysis is to look at a few more coronaviruses that have known hosts such as MERS (camel), bovine coronavirus (bovines), bat coronaviruses (bats) etc etc. My guess is that snakes have an particular codon usage bias that just happens to be in the same direction as coronaviruses (in general).

1 Like

How conserved is codon usage in vertebrates? Perhaps there’s plenty of codon usage biases to pick from within snakes (or other vertebrates).

I did a quick comparison, using coding sequences from Ensembl genomes, so the snakes there are Eastern Brown snake and Mainland Tiger Snake. Using the same euclidian distance on RSCU values as in the paper, it does look like snakes are closer to the Wuhan coronavirus than human, bats, cow, pig, cat, dog, chicken. But, I get the same result for MERS and SARS, and as Andy pointed out also Ebola. Just trying to automate it a bit to share the results tables

1 Like

I have a pipeline set up for CAICal - I’ll run some quick analyses looking at MERS, SARS, and nCoV against a bunch of species. Will post in a few hours.

As I’m setting up these analyses, I have already identified the main problem - the codon tables they used for the snakes (Naja atra and Bungarus multicinctus) are highly biased. Specifically, these codon tables are built on only 57 and 59 CDSs, which typically leads to completely wrong estimates of codon adaptation (which is how they link nCoV to snakes). Compare this to the human codon table (93487 CDSs) or Chicken (6017 CDSs - a notoriously badly undersampled genome).

Given how many genes snake genomes have, one can’t possibly create a representative codon table from less than 60 genes.

Also, remember there is variation in base composition across any 1 genome, and also between genomes.

Highly correlated (as in almost perfectly so). E.g., see Fig S5 from our Lassa paper: https://1kqjk8ux43922ffco17voba8-wpengine.netdna-ssl.com/files/andersen-cell.pdf

We looked at many others not in the paper too.

I attempted to replicate the recombination analysis on an alignment provided by Trevor Bedford (from this nextstrain tree). Alignment length is 29874nt and the number of polymorphic sites is 11586.

I used the new 3SEQ (v1.7) algorithm which can handle alignments with thousands of polymorphic sites. Source code for 3SEQ is here http://mol.ax/3seq. RDP4 has the previous version of 3SEQ (v1.1) and it can handle alignments with up to about 1000 polymorphic sites; this depends on how many of these polymorphic sites are classified as recombination-informative.

I have uploaded the key analysis files to this public folder:

https://filedn.com/lexUxgNbsuUbyRIygA2lmeR/nCoV2019/

3SEQ inferred breakpoints in the same general regions but a little bit off from David and Xiaowei’s analysis above:

Breakpoint 1: 13280 or 13570
Breakpoint 2: 18635

and these are really reported as breakpoint ranges, with all detail shown in the “3s.rec” files that I posted at the filedn.com link above. I generated trees for these sub-regions (link to PDF) and it looks like the outer part of the nCoV2019 genome has ancestry/origins in the bat viruses included in this alignment, but there is no clear ancestry signal for the middle part (13500-18500) part of the alignment. This suggests that there are more coronaviruses to be added to our alignments and phylogenies.

However, just because these recombination analyses give us breakpoints, this does not mean that the inferred sub-regions are free of recombination. I went deeper into the recombination analysis by running 3SEQ iteratively on the three inferred subregions (1-13280, 13281-18634, and 18635-29874), and then additionally on sub-sub-regions of these sub-regions, etc. It was very hard to find a subsegment of the genome that did not have a recombination signal, suggesting that the coronaviruses as a family are highly recombinant. Even when sectioning the genome down to 2kb or 3kb regions (using breakpoints given by 3SEQ sub-analyses) all of these small regions had evidence of mosaic recombination signals (the signals detected by 3SEQ). I did not test for phylogenetic recombination signals in these subsegments simply due to time constraints.

A high level of recombination in coronaviruses is consistent with a past analysis that we did on a MERS alignment of 164 genomes (http://mol.ax/pdf/lam18a.pdf) showing that the majority of these genomes show evidence of recombination. If the recombination rate really is this high, then we need to move to the family of inferential methods that calculate recombination rate not breakpoints; and it may also mean that the origins will be really hard to pin down unless we find a clade of coronaviruses in GenBank that have a relatively weak recombination signal when comparing to nCoV2019 (indicating recent ancestry) .

I’m traveling right now in Vietnam, and a bit hampered with websites being blocked and VPN issues, but will try to keep up if anyone has questions.

Will put online soon. We hadn’t yet as the alignment would be a secondary data release and it’s our understanding, despite the data being made public, there was some sensitivity about this.

The recombination breakpoints in our analysis are from an analysis with GARD in the Hyphy package using the 11 sequences listed in the diversity plot. In recombination analysis the exact locations of breakpoints detected will differ depending on the reference sets used and the method/software used. There’s also other recombination events in the bat coronaviruses (widely reported) that could be causing issues and we detected these both with GARD and RDP. This post’s purpose was to focus on the nCoV lineage. We will provide full details of our analysis in a pre-print very soon.

Very relevant pre-print ‘Discovery of a novel coronavirus associated with the recent pneumonia outbreak in humans and its potential bat origin’: https://www.biorxiv.org/content/10.1101/2020.01.22.914952v1. Zhou et al. report a closer bat betacoronavirus, RaTG13, that is similar to nCoV across the region CoVZC45 and CoVZXC21 are recombinant/not clustering with nCoV. Relatively high sequence identity in Spike reported too.

Motivated by David’s post and Maciej’s post on the extent of recombination, I explored what could potentially still be done in a phylogenetic framework. In line with the recombination results posted, a Neighbor-Net [https://doi.org/10.1093/molbev/msh018] with splits filtered to keep only those with > 95% bootstrap support indicates reticulate evolution:


and the PHI-test [https://doi.org/10.1534/genetics.105.048975] provides significant evidence for recombination. I attempted to heuristically filter the alignment from recombination signal by performing an RDP4 analysis (based on the 5 recombination methods selected by default and 3Seq, requiring evidence from 3 methods to call recombination), and keeping only the major non-recombinant stretches in each genome (remaining parts are masked with N’s). Some additional manual editing was done to remove regions that were left with only very little sequence information. Applying the same network reconstruction procedure on this filtered alignment now provides a tree:

And also the PHI-test does not find significant evidence for recombination anymore. So, despite the extent of recombination, there may still be a prospect for removing the major recombination signal in order to perform phylogenetics.

3 Likes

Thanks Philippe. I took your new alignment and ran it through 3SEQ. It has a much weaker recombination signal. 3SEQ detected 38 recombination events in the alignment with the blanked out or removed sections, but in David’s original alignment around 2700 were detected.

The breakpoints detected (that are relevant for the Wuhan nCoV) were around positions 900, 1650, 4800, 6420, and 9600. I built trees for the sub-regions defined by these breakpoints and they do not show any phylogenetic recombination signal that would be relevant to nCoV. They just show nCoV’s relatedness to two bat coronaviruses in the tree: CoVZC45 and CoVZXC21.

Trees are located here: nCoV2019_TreesOnSixCandidateRecombinantSegments.pdf (20.9 KB)

I think we’ll need an alignment of a larger sequence set, but this is already a good start for reconstructing origins.

1 Like