This is an analysis of 15 SARS genomes from early 2003. This is all of the SARS genomes I could find for which I could obtain or make a good guess at the date of collection.
Figure 1 | Maximum likelihood tree under GTR+gamma for 15 SARS genomes. Click on a branch to re-root at that position. Interactive tree figure by @john.mccrone using figtree.js.
Download the tree file from here.
1 Like
This is an analysis of a data set shared by Tommy Lam, which includes 69 dated genomes sampled over a year:
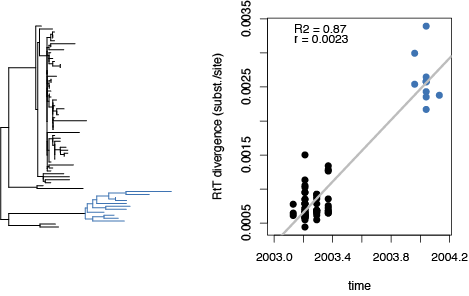
The temporal signal suggested by the root-to-tip divergence plot and the associated metrics (R-squared and rate) may be somewhat misleading because the sequences sampled in 2004 make up a single cluster in the tree, so the data independence assumption of the regression is strongly violated. A strict clock BEAST analysis however estimates a rate of 0.0017 [0.0013,0.0021], which appears to be in line with the latest nCoV rates posted.
1 Like