nCoV's relationship to bat coronaviruses & recombination signals (no snakes) - no evidence the 2019-nCoV lineage is recombinant

Sincere apologies there was an error in the top figure. The tree on the very right from the region 20954 - 29903 was showing the tree from region 1680 - 3014 from further down in the post. This has been updated.

Here’s a CSV file of the “codon usage” table from the JMV paper, in case anyone wants to check it out. Data entry is very calming, I can recommend it. Please let me know if you see any errors.

,beta CoV Wuhan WIV04,bat SL CoV ZC45,Bungarus multicinctus,Naja atra,Marmota,Erinaceus europeaus,manis javanica,Rhonolophus sinicus,Gallus gallus,Homo sapiens
Phe,UUU,1.41,1.33,1.14,1.15,0.94,0.91,0.93,0.99,0.91,0.93
,UUC,0.59,0.67,0.86,0.85,1.06,1.09,1.07,1.01,1.09,1.07
Leu,UUA,1.64,1.38,0.73,0.86,0.46,0.49,0.48,0.56,0.42,0.46
,UUG,1.07,1.19,1.24,1.21,0.77,0.88,0.85,0.87,0.72,0.77
,CUU,1.75,1.78,1.3,1.11,1.11,1,1,1.04,1.05,0.79
,CUC,0.59,0.65,0.78,0.79,1.23,1.17,1.2,0.96,1.14,1.17
,CUA,0.66,0.6,0.5,0.47,0.62,0.63,0.57,0.57,0.6,0.43
,CUG,0.3,0.4,1.45,1.55,1.81,1.83,1.89,2,2.06,2.37
Ile,AUU,1.53,1.58,1.37,1.46,1.09,1.02,1.06,1.28,1.02,1.08
,AUC,0.56,0.57,0.92,0.86,1.27,1.21,1.23,1.25,1.36,1.41
,AUA,0.91,0.85,0.71,0.68,0.64,0.77,0.71,0.47,0.61,0.51
Met ,AUG,1,1,1,1,1,1,1,1,1,1
Val,GUU,1.95,1.89,1.08,1.02,0.89,0.82,0.83,0.87,0.85,0.73
,GUC,0.57,0.55,0.74,0.71,1.04,0.99,1,0.95,1.02,0.95
,GUA,0.9,0.9,0.88,0.71,0.56,0.59,0.56,0.53,0.51,0.47
,GUG,0.58,0.66,1.29,1.56,1.51,1.6,1.61,1.66,1.62,1.85
Ser,UCU,1.96,2.04,1.5,1.43,1.04,1.02,1.02,1.14,0.88,1.13
,UCC,0.47,0.44,0.85,0.81,1.18,1.12,1.16,1.31,1.16,1.31
,UCA,1.66,1.66,1.21,1.16,1.13,1.22,1.15,1,1.13,0.9
,UCG,0.11,0.15,0.17,0.26,0.39,0.4,0.38,0.28,0.41,0.33
,AGU,1.43,1.36,1.35,1.39,0.89,0.86,0.87,0.85,0.93,0.9
,AGC,0.37,0.36,0.91,0.93,1.37,1.38,1.41,1.42,1.5,1.44
Pro,CCU,1.94,1.83,1.7,1.66,1.17,1.08,1.12,1.15,1.05,1.15
,CCC,0.3,0.34,0.57,0.59,1.09,1.09,1.11,1.35,1.12,1.29
,CCA,1.6,1.59,1.51,1.58,1.23,1.27,1.25,1.13,1.02,1.11
,CCG,0.16,0.25,0.21,0.17,0.51,0.56,0.51,0.37,0.81,0.45
Thr,ACU,1.78,1.75,1.3,1.28,1,0.97,0.97,0.96,0.99,0.99
,ACC,0.38,0.44,1.07,1.06,1.25,1.2,1.24,1.39,1.15,1.42
,ACA,1.64,1.58,1.38,1.33,1.29,1.31,1.31,1.15,1.24,1.14
,ACG,0.2,0.24,0.24,0.34,0.47,0.52,0.49,0.5,0.62,0.46
Ala,GCU,2.18,2.13,1.54,1.34,1.15,1.12,1.12,1.25,1.14,1.06
,GCC,0.57,0.55,0.93,0.97,1.24,1.22,1.27,1.59,1.26,1.6
,GCA,1.09,1.09,1.33,1.38,1.12,1.14,1.13,0.93,1.08,0.91
,GCG,0.15,0.24,0.2,0.31,0.48,0.52,0.48,0.24,0.52,0.42
Tyr,UAU,1.22,1.19,1.25,1.21,0.97,0.95,0.94,0.9,1.02,0.89
,UAC,0.78,0.81,0.75,0.79,1.03,1.05,1.06,1.1,0.98,1.11
His,CAU,1.39,1.39,1.19,1.04,0.99,0.95,0.95,1,0.9,0.84
,CAC,0.61,0.61,0.81,0.96,1.01,1.05,1.05,1,1.1,1.16
Gln,CAA,1.39,1.24,0.89,0.94,0.85,0.8,0.75,0.76,0.81,0.53
,CAG,0.61,0.76,1.11,1.06,1.15,1.2,1.25,1.24,1.19,1.47
Asn,AAU,1.35,1.35,1.16,1.06,1,0.94,0.97,0.93,0.92,0.94
,AAC,0.65,0.65,0.84,0.94,1,1.06,1.03,1.07,1.08,1.06
Lys,AAA,1.31,1.2,1.16,1.18,0.99,0.94,0.96,1,0.93,0.87
,AAG,0.69,0.8,0.84,0.82,1.01,1.06,1.04,1,1.07,1.13
Asp,GAU,1.28,1.24,1.32,1.27,0.96,0.93,0.94,1.08,1.02,0.93
,GAC,0.72,0.76,0.68,0.73,1.04,1.07,1.06,0.92,0.98,1.07
Glu,GAA,1.44,1.27,1.15,1.17,1.03,1.01,0.99,0.92,1.04,0.84
,GAG,0.56,0.73,0.85,0.83,0.97,0.99,1.01,1.08,0.96,1.16
Cys,UGU,1.56,1.48,1.03,1,0.9,0.85,0.87,1.14,0.86,0.91
,UGC,0.44,0.52,0.97,1,1.1,1.15,1.13,0.86,1.14,1.09
Trp,UGG,1,1,1,1,1,1,1,1,1,1
Arg,CGU,1.45,1.51,0.42,0.59,0.43,0.41,0.44,0.69,0.66,0.48
,CGC,0.59,0.64,0.48,0.43,0.66,0.67,0.65,0.87,0.82,1.1
,CGA,0.29,0.33,0.66,0.6,0.6,0.55,0.55,0.72,0.71,0.65
,CGG,0.19,0.1,0.67,0.69,0.73,0.79,0.78,1.1,0.99,1.21
,AGA,2.67,2.63,2.29,2.07,2.07,1.97,1.94,1.42,1.46,1.29
,AGG,0.81,0.79,1.47,1.61,1.51,1.61,1.63,1.19,1.36,1.27
Gly,GGU,2.34,2.16,0.99,0.93,0.66,0.63,0.63,0.79,0.7,0.65
,GGC,0.71,0.76,0.75,0.77,1.07,1.09,1.09,1.39,1.03,1.35
,GGA,0.83,0.92,1.59,1.64,1.39,1.33,1.31,1.03,1.29,1
,GGG,0.12,0.16,0.77,0.81,0.88,0.62,0.95,0.88,0.99,1.01

Hi David - do you have your alignment posted somewhere? I will run this through the new 3SEQ (not in RDP4 yet) which can compute exact breakpoints for alignments with >5000 polymorphic sites. New version is here: http://mol.ax/pdf/lam18a.pdf and it has recombination results for MERS-CoV.

Thanks
Maciek

If anyone is interested in doing it the obvious thing to do with respect to the ‘snake’ analysis is to look at a few more coronaviruses that have known hosts such as MERS (camel), bovine coronavirus (bovines), bat coronaviruses (bats) etc etc. My guess is that snakes have an particular codon usage bias that just happens to be in the same direction as coronaviruses (in general).

1 Like

How conserved is codon usage in vertebrates? Perhaps there’s plenty of codon usage biases to pick from within snakes (or other vertebrates).

I did a quick comparison, using coding sequences from Ensembl genomes, so the snakes there are Eastern Brown snake and Mainland Tiger Snake. Using the same euclidian distance on RSCU values as in the paper, it does look like snakes are closer to the Wuhan coronavirus than human, bats, cow, pig, cat, dog, chicken. But, I get the same result for MERS and SARS, and as Andy pointed out also Ebola. Just trying to automate it a bit to share the results tables

1 Like

I have a pipeline set up for CAICal - I’ll run some quick analyses looking at MERS, SARS, and nCoV against a bunch of species. Will post in a few hours.

As I’m setting up these analyses, I have already identified the main problem - the codon tables they used for the snakes (Naja atra and Bungarus multicinctus) are highly biased. Specifically, these codon tables are built on only 57 and 59 CDSs, which typically leads to completely wrong estimates of codon adaptation (which is how they link nCoV to snakes). Compare this to the human codon table (93487 CDSs) or Chicken (6017 CDSs - a notoriously badly undersampled genome).

Given how many genes snake genomes have, one can’t possibly create a representative codon table from less than 60 genes.

Also, remember there is variation in base composition across any 1 genome, and also between genomes.

Highly correlated (as in almost perfectly so). E.g., see Fig S5 from our Lassa paper: https://1kqjk8ux43922ffco17voba8-wpengine.netdna-ssl.com/files/andersen-cell.pdf

We looked at many others not in the paper too.

I attempted to replicate the recombination analysis on an alignment provided by Trevor Bedford (from this nextstrain tree). Alignment length is 29874nt and the number of polymorphic sites is 11586.

I used the new 3SEQ (v1.7) algorithm which can handle alignments with thousands of polymorphic sites. Source code for 3SEQ is here http://mol.ax/3seq. RDP4 has the previous version of 3SEQ (v1.1) and it can handle alignments with up to about 1000 polymorphic sites; this depends on how many of these polymorphic sites are classified as recombination-informative.

I have uploaded the key analysis files to this public folder:

https://filedn.com/lexUxgNbsuUbyRIygA2lmeR/nCoV2019/

3SEQ inferred breakpoints in the same general regions but a little bit off from David and Xiaowei’s analysis above:

Breakpoint 1: 13280 or 13570
Breakpoint 2: 18635

and these are really reported as breakpoint ranges, with all detail shown in the “3s.rec” files that I posted at the filedn.com link above. I generated trees for these sub-regions (link to PDF) and it looks like the outer part of the nCoV2019 genome has ancestry/origins in the bat viruses included in this alignment, but there is no clear ancestry signal for the middle part (13500-18500) part of the alignment. This suggests that there are more coronaviruses to be added to our alignments and phylogenies.

However, just because these recombination analyses give us breakpoints, this does not mean that the inferred sub-regions are free of recombination. I went deeper into the recombination analysis by running 3SEQ iteratively on the three inferred subregions (1-13280, 13281-18634, and 18635-29874), and then additionally on sub-sub-regions of these sub-regions, etc. It was very hard to find a subsegment of the genome that did not have a recombination signal, suggesting that the coronaviruses as a family are highly recombinant. Even when sectioning the genome down to 2kb or 3kb regions (using breakpoints given by 3SEQ sub-analyses) all of these small regions had evidence of mosaic recombination signals (the signals detected by 3SEQ). I did not test for phylogenetic recombination signals in these subsegments simply due to time constraints.

A high level of recombination in coronaviruses is consistent with a past analysis that we did on a MERS alignment of 164 genomes (http://mol.ax/pdf/lam18a.pdf) showing that the majority of these genomes show evidence of recombination. If the recombination rate really is this high, then we need to move to the family of inferential methods that calculate recombination rate not breakpoints; and it may also mean that the origins will be really hard to pin down unless we find a clade of coronaviruses in GenBank that have a relatively weak recombination signal when comparing to nCoV2019 (indicating recent ancestry) .

I’m traveling right now in Vietnam, and a bit hampered with websites being blocked and VPN issues, but will try to keep up if anyone has questions.

Will put online soon. We hadn’t yet as the alignment would be a secondary data release and it’s our understanding, despite the data being made public, there was some sensitivity about this.

The recombination breakpoints in our analysis are from an analysis with GARD in the Hyphy package using the 11 sequences listed in the diversity plot. In recombination analysis the exact locations of breakpoints detected will differ depending on the reference sets used and the method/software used. There’s also other recombination events in the bat coronaviruses (widely reported) that could be causing issues and we detected these both with GARD and RDP. This post’s purpose was to focus on the nCoV lineage. We will provide full details of our analysis in a pre-print very soon.

Very relevant pre-print ‘Discovery of a novel coronavirus associated with the recent pneumonia outbreak in humans and its potential bat origin’: https://www.biorxiv.org/content/10.1101/2020.01.22.914952v1. Zhou et al. report a closer bat betacoronavirus, RaTG13, that is similar to nCoV across the region CoVZC45 and CoVZXC21 are recombinant/not clustering with nCoV. Relatively high sequence identity in Spike reported too.

Motivated by David’s post and Maciej’s post on the extent of recombination, I explored what could potentially still be done in a phylogenetic framework. In line with the recombination results posted, a Neighbor-Net [https://doi.org/10.1093/molbev/msh018] with splits filtered to keep only those with > 95% bootstrap support indicates reticulate evolution:


and the PHI-test [https://doi.org/10.1534/genetics.105.048975] provides significant evidence for recombination. I attempted to heuristically filter the alignment from recombination signal by performing an RDP4 analysis (based on the 5 recombination methods selected by default and 3Seq, requiring evidence from 3 methods to call recombination), and keeping only the major non-recombinant stretches in each genome (remaining parts are masked with N’s). Some additional manual editing was done to remove regions that were left with only very little sequence information. Applying the same network reconstruction procedure on this filtered alignment now provides a tree:

And also the PHI-test does not find significant evidence for recombination anymore. So, despite the extent of recombination, there may still be a prospect for removing the major recombination signal in order to perform phylogenetics.

3 Likes

Thanks Philippe. I took your new alignment and ran it through 3SEQ. It has a much weaker recombination signal. 3SEQ detected 38 recombination events in the alignment with the blanked out or removed sections, but in David’s original alignment around 2700 were detected.

The breakpoints detected (that are relevant for the Wuhan nCoV) were around positions 900, 1650, 4800, 6420, and 9600. I built trees for the sub-regions defined by these breakpoints and they do not show any phylogenetic recombination signal that would be relevant to nCoV. They just show nCoV’s relatedness to two bat coronaviruses in the tree: CoVZC45 and CoVZXC21.

Trees are located here: nCoV2019_TreesOnSixCandidateRecombinantSegments.pdf (20.9 KB)

I think we’ll need an alignment of a larger sequence set, but this is already a good start for reconstructing origins.

1 Like

Hi,

I have added the 2013 Yunnan bat sequence (much more closely related to the Wuhan2019-2020 virus than are the XC21 and ZC45 viruses) and built trees from complete genomes and some subgenomic regions chosen based on similarity plots.

57_Wuhan_Simplo800t_JP

From this type of data, we cannot say which viruses are “recombinant” and which are “pure”
or never recombined in their history. It is only clear that recombination has been happening in the evolution of these viruses.

My alignment is built from a sampling of complete genomes of only the SARS and “SARS-like” subclade of the Betacoronaviruses. It does not include MERS or other Betacoronaviruses. For the SimPlot (Stuart Ray software) I first gap-stripped the alignment.

I am now running an RDP4 (Darren Martin software) alignment on the gap-stripped set, and it is finding a lot of recombination. The recombination events that I found evident in SimPlot are also detected in RDP4, but I am a new user of RDP4 and it will take me a while to get up to speed with using it.

Brian Foley
HIV Databases at LANL

1 Like

Just to be clear our first post on Jan 22nd was to highlight there’s no evidence the new human lineage nCoV was recombinant, rather the, at that time, known to be related bat coronaviruses are clearly the recombinants. Since then a pre-print has come out from Wuhan-based researchers with senior author Zheng-Li Shi: https://www.biorxiv.org/content/10.1101/2020.01.22.914952v1 including a similarity plot. In this very important study Zhou et al. report a closer bat coronavirus to the nCoV lineage, RaTG13, in all of its genome confirming the nCoV lineage is not recombinant. The bat coronaviruses are themselves recorded to be frequently recombinant in the published literature so while interesting this is not a new finding. Update, Zhou et al’s paper is now available in Nature: https://www.nature.com/articles/s41586-020-2012-7.

2 Likes

I have put together a figure of the recombination pattern of some of the closest viruses to SARS-CoV-2 including RaTG13 and the pangolins. Includes the region indexed as 1680-3014 by David, above, although I call the breakpoints as 1455-2836. The entire region after the spike is just lumped together.

Figure 1 | Phylogenetic trees for regions across the genome of SARS-CoV-2 and related betacoronaviruses.

spike protein

Here is a similar diagram for the spike protein. Generally the bat virus, RaTG13, is the closest to the SARS-CoV-2 virus across the whole spike with the exception of the small variable loop region in the C-terminus domain (the receptor binding domain). In this region, RaTG13 suddenly leaps away in divergence leaving the pangolin virus, Guangdong/1/2020 as the closest. This suggests that RaTG13 acquired this different loop region by recombination with another bat virus.

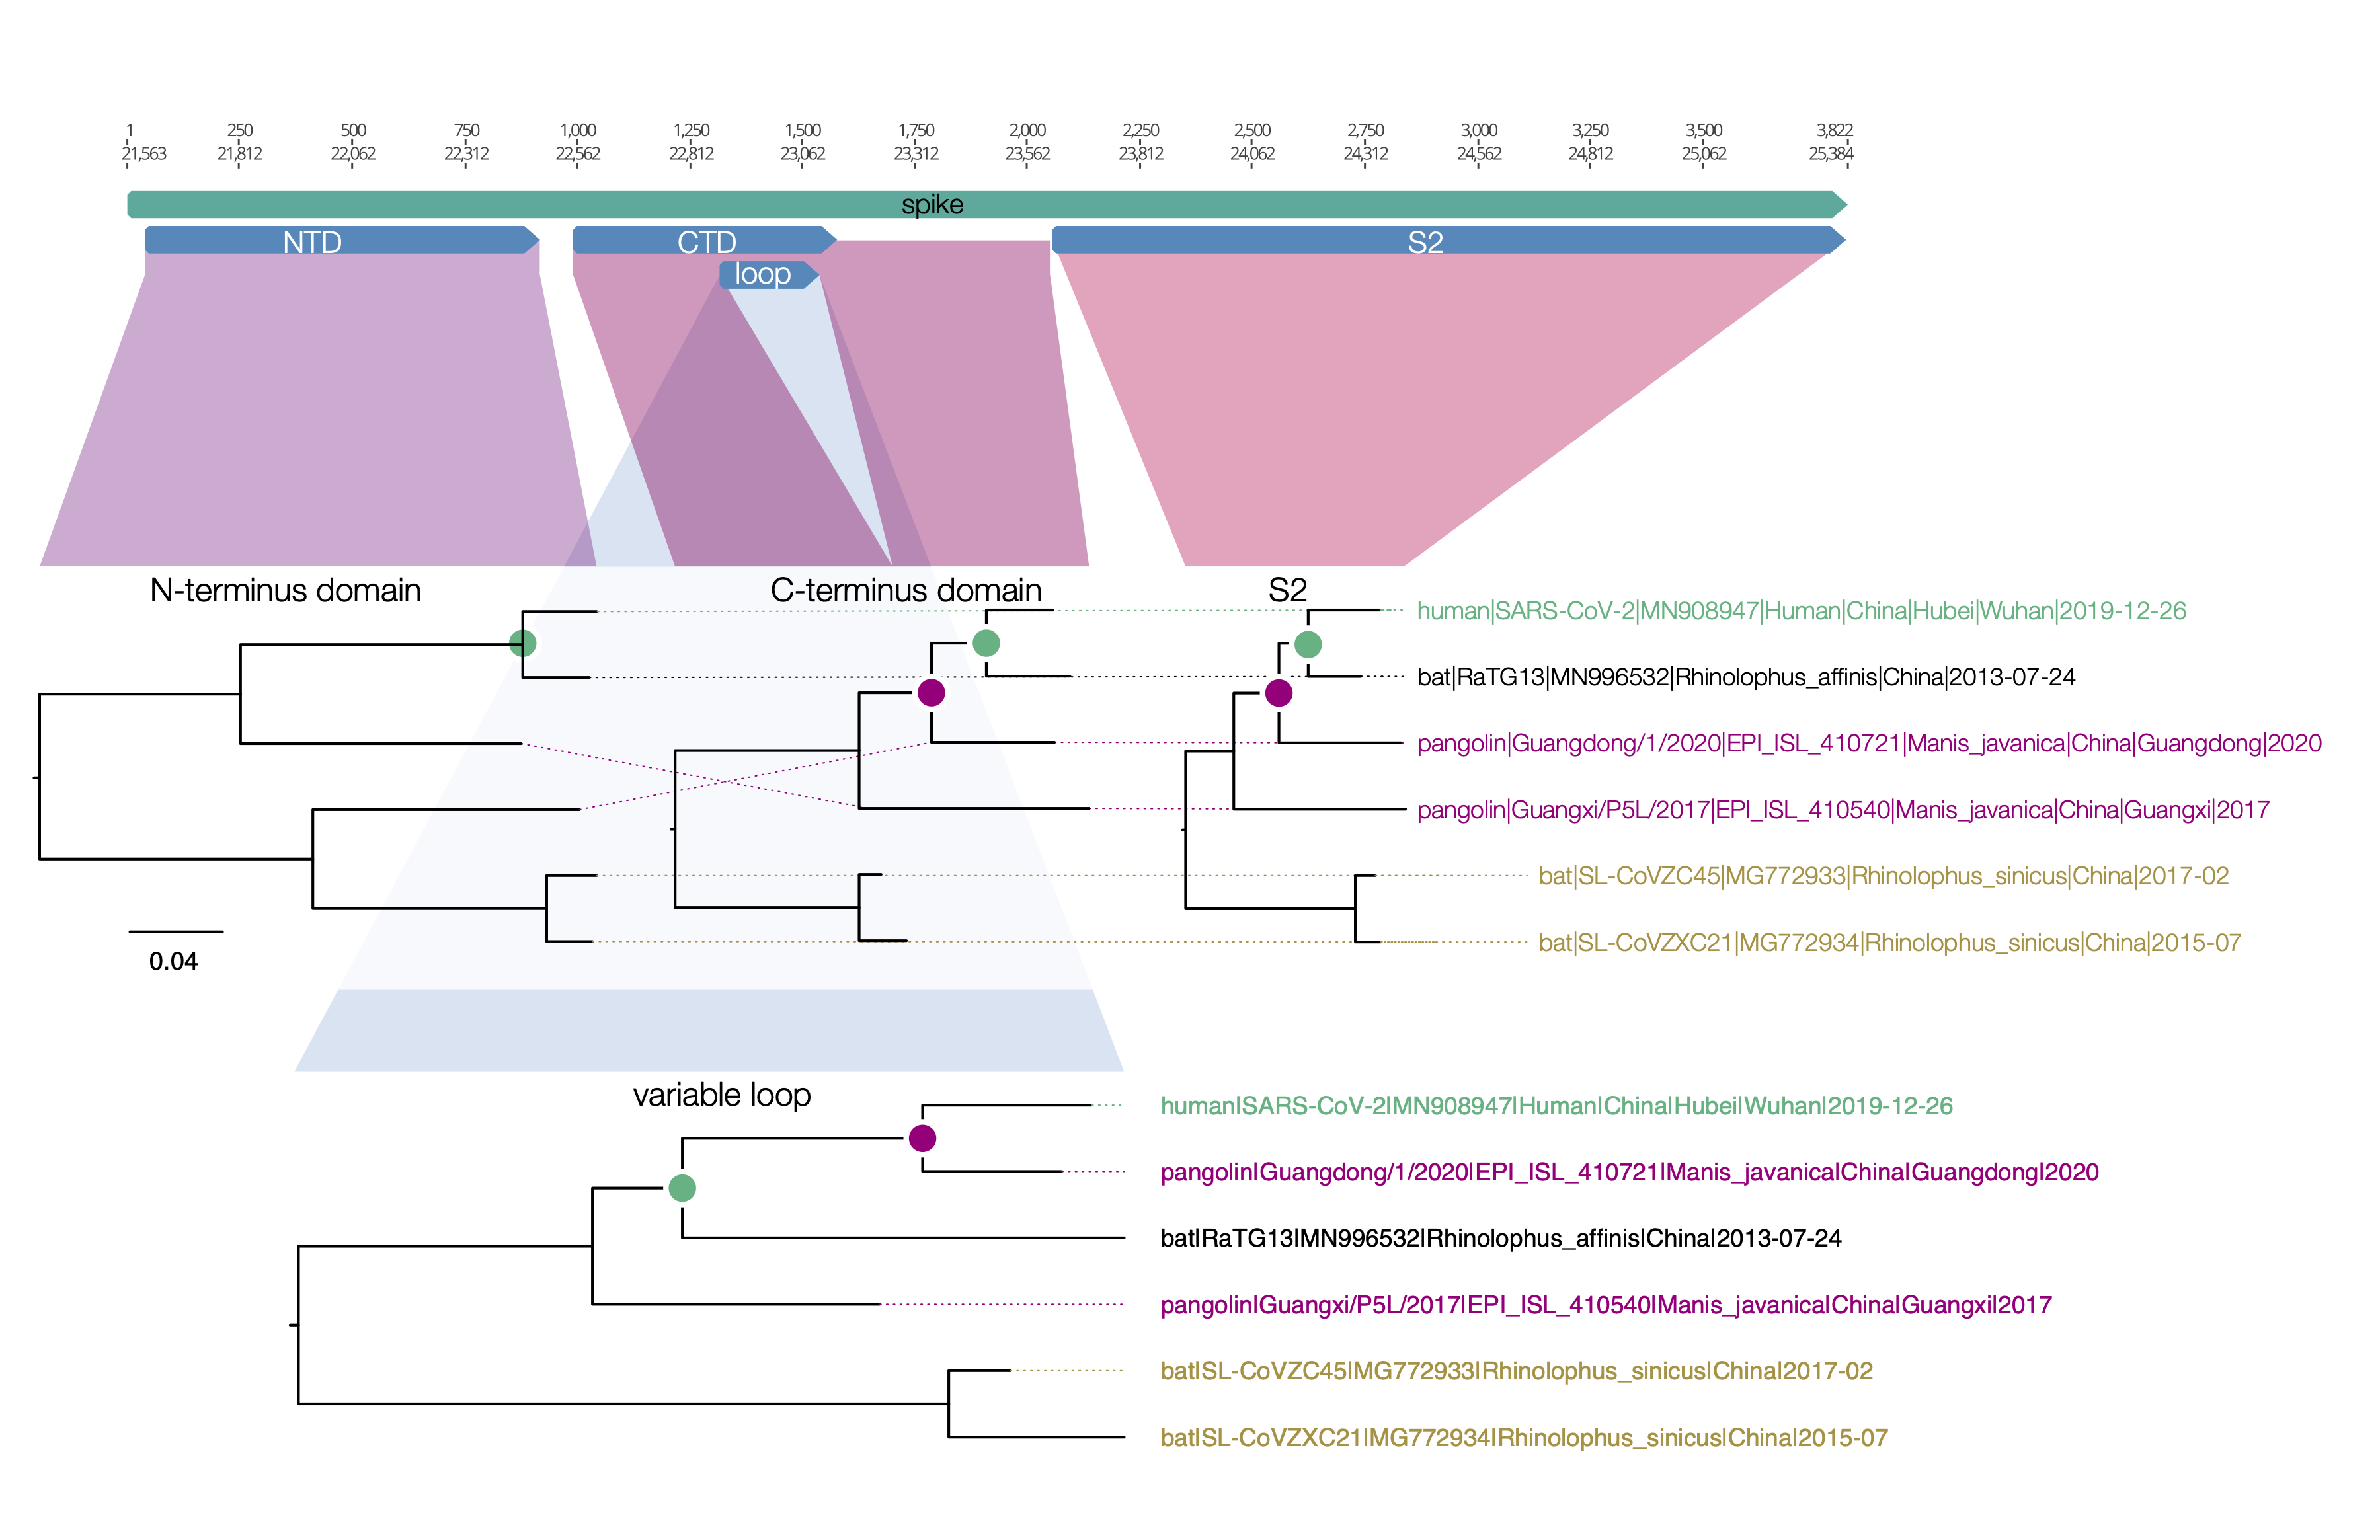
Figure 1 | Regions of the spike protein SARS-CoV-2 and its closest relatives. Trees are drawn to the same scale.

What is interesting about this loop region is that it contains the six key contact residues for the ACE2 receptor (see this post for more details about the RBD). So this suggests the common ancestor of the RaTG13 virus, the pangolin and the SARS-CoV-2 had the optimal receptor binding domain for ACE2 and then RaTG13 lost it.

2 Likes

The phylogenetic tree of this loop is indeed interesting (ACE2 binding motif). We have been working on this too. Using the same data set as we used above with six new pangolin sequences, we find that the clustering with ACE2 using bat strains (labelled red, experimentally verified see Functional assessment of cell entry and receptor usage for lineage B β- coronaviruses, including 2019-nCoV) suggests the ability to use human ACE2 may have been pre-adapted before jumping to humans in a bat species or there may be other regions close to RBD involved to determine ACE2 usage.


The pangolin strain, which causes clinical symptoms in pangolin, may come from a bat species originally. We may still need to find the actual intermediate animal.

1 Like