With the exception of Hubei Province, Guangdong Province in southern China has the highest number of recorded COVID-19 cases in the country. Guangdong Province and the Pearl River Delta Metropolitan Region comprise one of the world’s largest and most-densely populated urban areas. Guangdong Province is home to 113 million people and contains many large cities including Guangzhou (12m people), Shenzhen (10m), Dongguan (8m) and Foshan (7m). The province is connected by strong transportation links to Hubei Province, where the COVID-19 epidemic was first reported. Consequently, Guangdong detected its first case of hCoV-19 infection early during the epidemic, on 19th Jan 2020. Numbers of confirmed cases grew until early Feb 2020 (peaking at >100 cases per day) and declined thereafter (Figure 1; https://bit.ly/38GVWME). In recent days the province has recorded only one or no newly-confirmed cases.
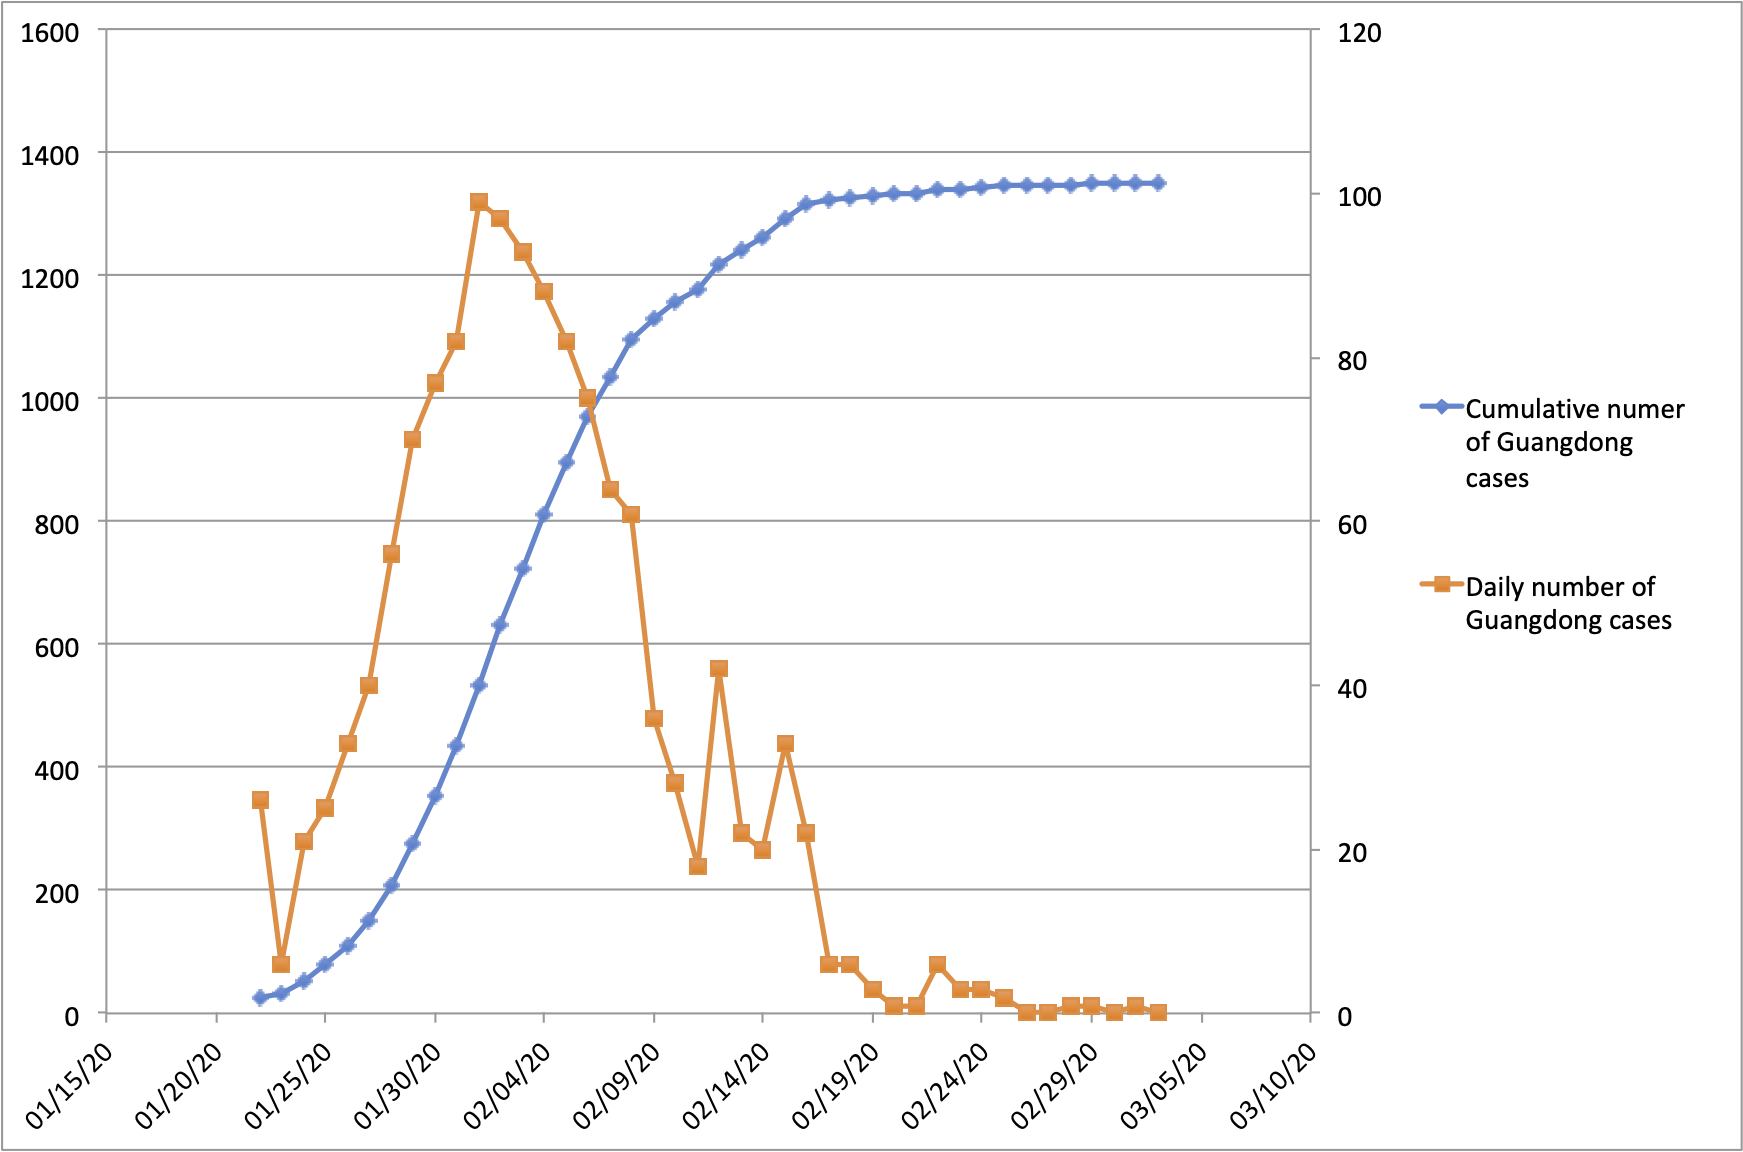
Figure 1 | Number of reported COVID-19 cases in Guangdong Province, China
An investigation of the genomic epidemiology of hCoV-19 in Guangdong is needed in order to understand (i) how the virus disseminated from Hubei across China and subsequently worldwide, (ii) the number, size, persistence and dynamics of transmission chains that are imported into large, highly-populated urban areas, and (iii) how public health responses in Guangdong led to the successful reduction and elimination of these transmission chains.
To answer these questions we have generated near-complete and partial genomes from 53 COVID-19 patients in Guangdong Province, China. The genomes were generated by two different approaches, (i) untargeted metagenomic sequencing on the BGI (n=16) and NextSeq (n=2) platforms, and (ii) using the ARTIC COVID-19 multiplex PCR primers, following by nanopore sequencing on an ONT MinION device (n=35). We report only those genomes for which we were able to generate >50% genome coverage. Sequence sampling dates ranged from 30th Jan 2020 to 28th Feb 2020 (Figure 2).
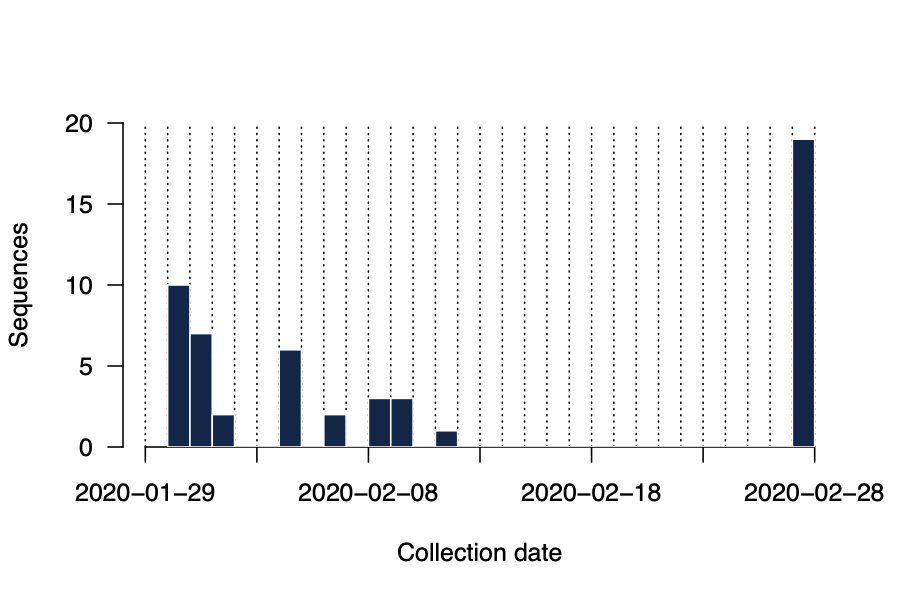
Figure 2 | Histogram of sampling dates for the sequences reported here.
Reference-based assembly of the metagenomic raw data was performed as follows. Illumina adaptors were removed, and reads were filtered for quality (q30 quality and read length >15nt) using Cutadapt 1.18. The mapping of cleaned reads was performed against GenBank reference strain MN908947.3 using Bowtie2. Consensus sequences were generated using samtools 1.2. Sites are called at depth>=3 if they matched the reference strain, or depth>=5 if they differed from the reference, otherwise sites were denoted N. Ambiguity nucleotide codes were used if (i) the minor variant is observed at >30% frequency and (ii) the minor variant is represented by 5 or more reads. Assembly of the nanopore raw data was performed using the version of the ARTIC bioinformatic pipeline for COVID-19 employing minimap2 and medaka for consensus sequence generation. Where samples from the same patient had been sequenced on both platforms, we retained only the sequence with the highest genome coverage.
As Figure 3 shows, RT-PCR Ct values for the sequences reported here ranged from 19 to 36 (the range for all samples, including those with coverage <50%, was 19 to 40.86). Genome coverage of the metagenomic-sequenced samples ranged from 79.6% to 99.9%, whilst genome coverage of the nanopore-sequenced samples ranged from 57.3% to 99%. Genome coverage is high for most samples with RT-PCR Ct<30, and declines as Ct values increase from 30 to 36. Figure 4 displays the genome coverage map for each sequence. There are common regions of poor coverage among the sequences generated with multiplex PCR primers and nanopore sequencing, suggesting that some primers in these regions could be redesigned to improve coverage. We are currently undertaking a more detailed comparison of performance among sequencing platforms.
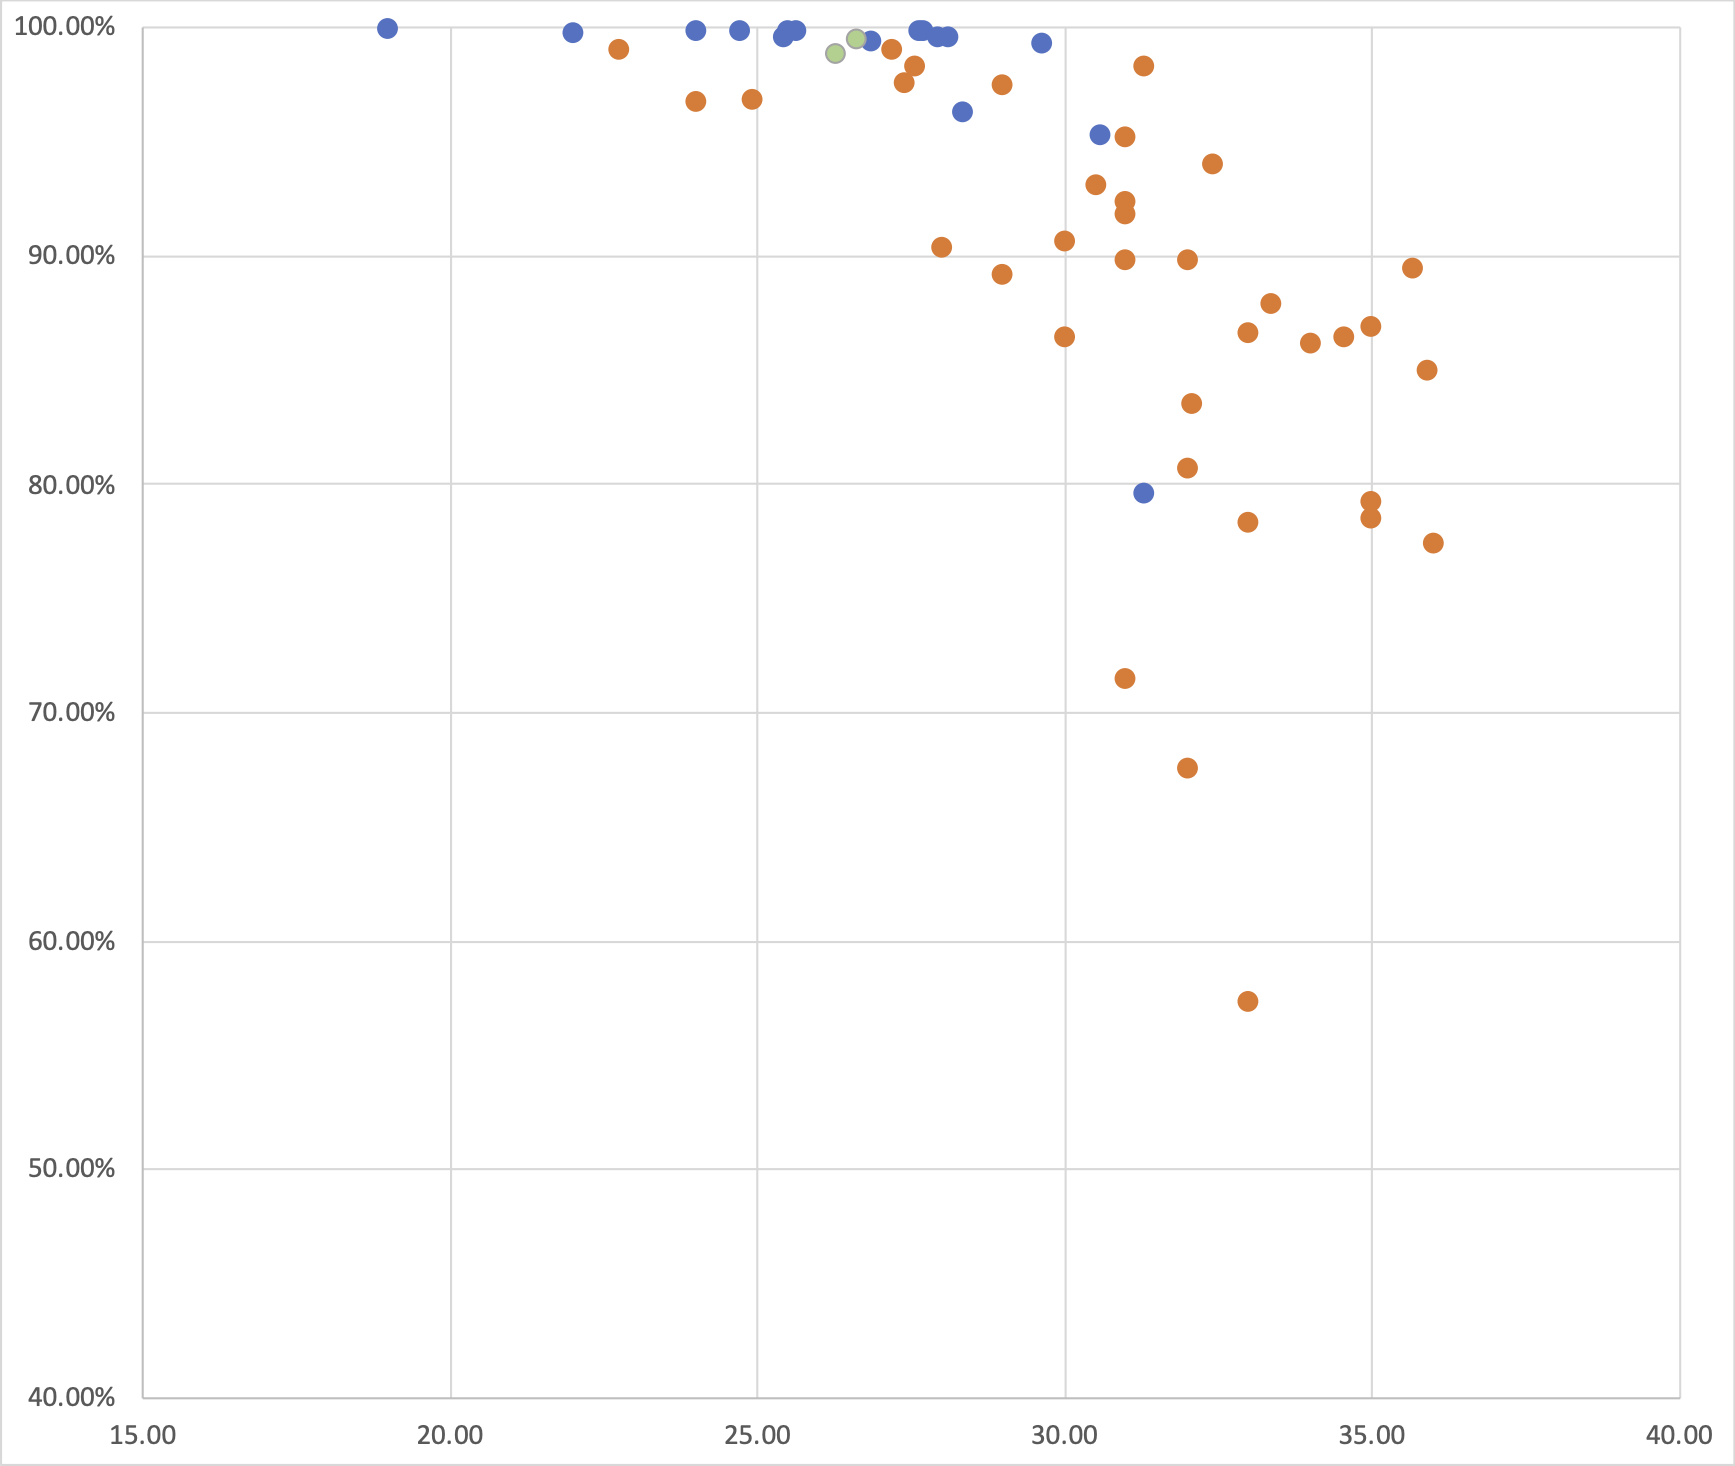
Figure 3 | A plot of hCoV-19 genome coverage (vertical axis) against RT-PCR Ct value (horizontal axis) for the genomes reported here. Each sequence is coloured by sequencing approach used: blue = BGI metagenomic sequencing, orange = multiplex PCR nanopore sequencing, green = NextSeq metagenomic sequencing.
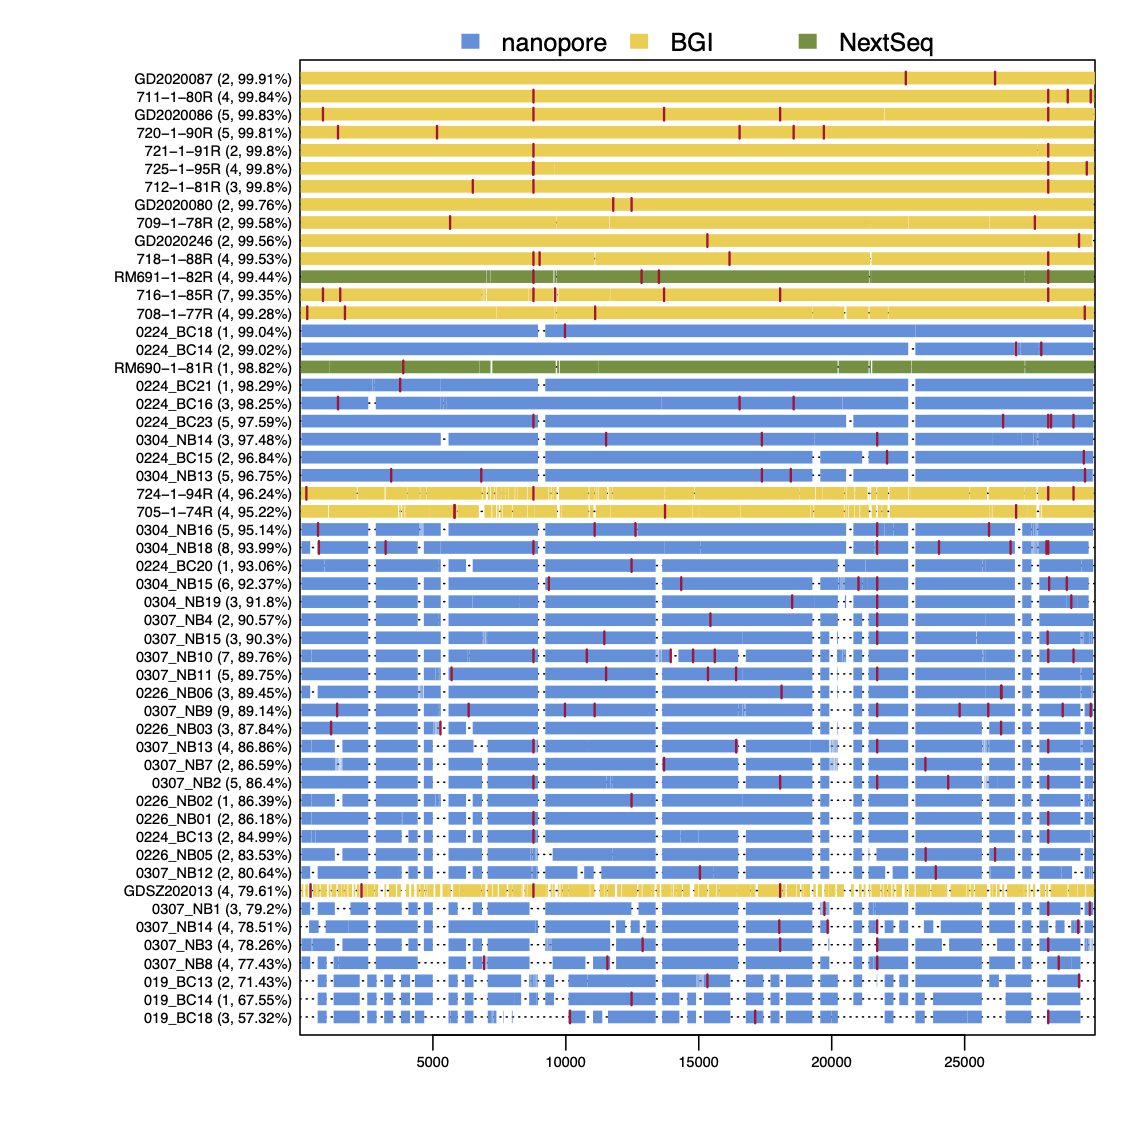
Figure 4 | Genome coverage map. Sequences are ranked top to bottom in order of decreasing coverage and coloured by sequencing approach: yellow = BGI metagenomic sequencing, blue = multiplex PCR nanopore sequencing, green = NextSeq metagenomic sequencing. Red bars show nucleotide differences from the reference.
We here provide a very preliminary phylogenetic analysis to accompany the sharing of these genomes through GISAID. A more comprehensive phylogenetic and phylodynamic analysis of the data is ongoing.
We added our new hCoV-19 genomes from Guangdong to an alignment of 176 publicly-available sequences (87 of which were sampled in China, 19 of which represent previously-sampled Guangdong cases). Our data set has increased the number of available hCoV-19 genomes from China by ~60%. The result was a completed alignment comprising 229 sequences. We estimated a phylogenetic tree from this alignment using the maximum likelihood approached implemented in PhyML, using the HKY+Ⲅ4 substitution model (default parameters).
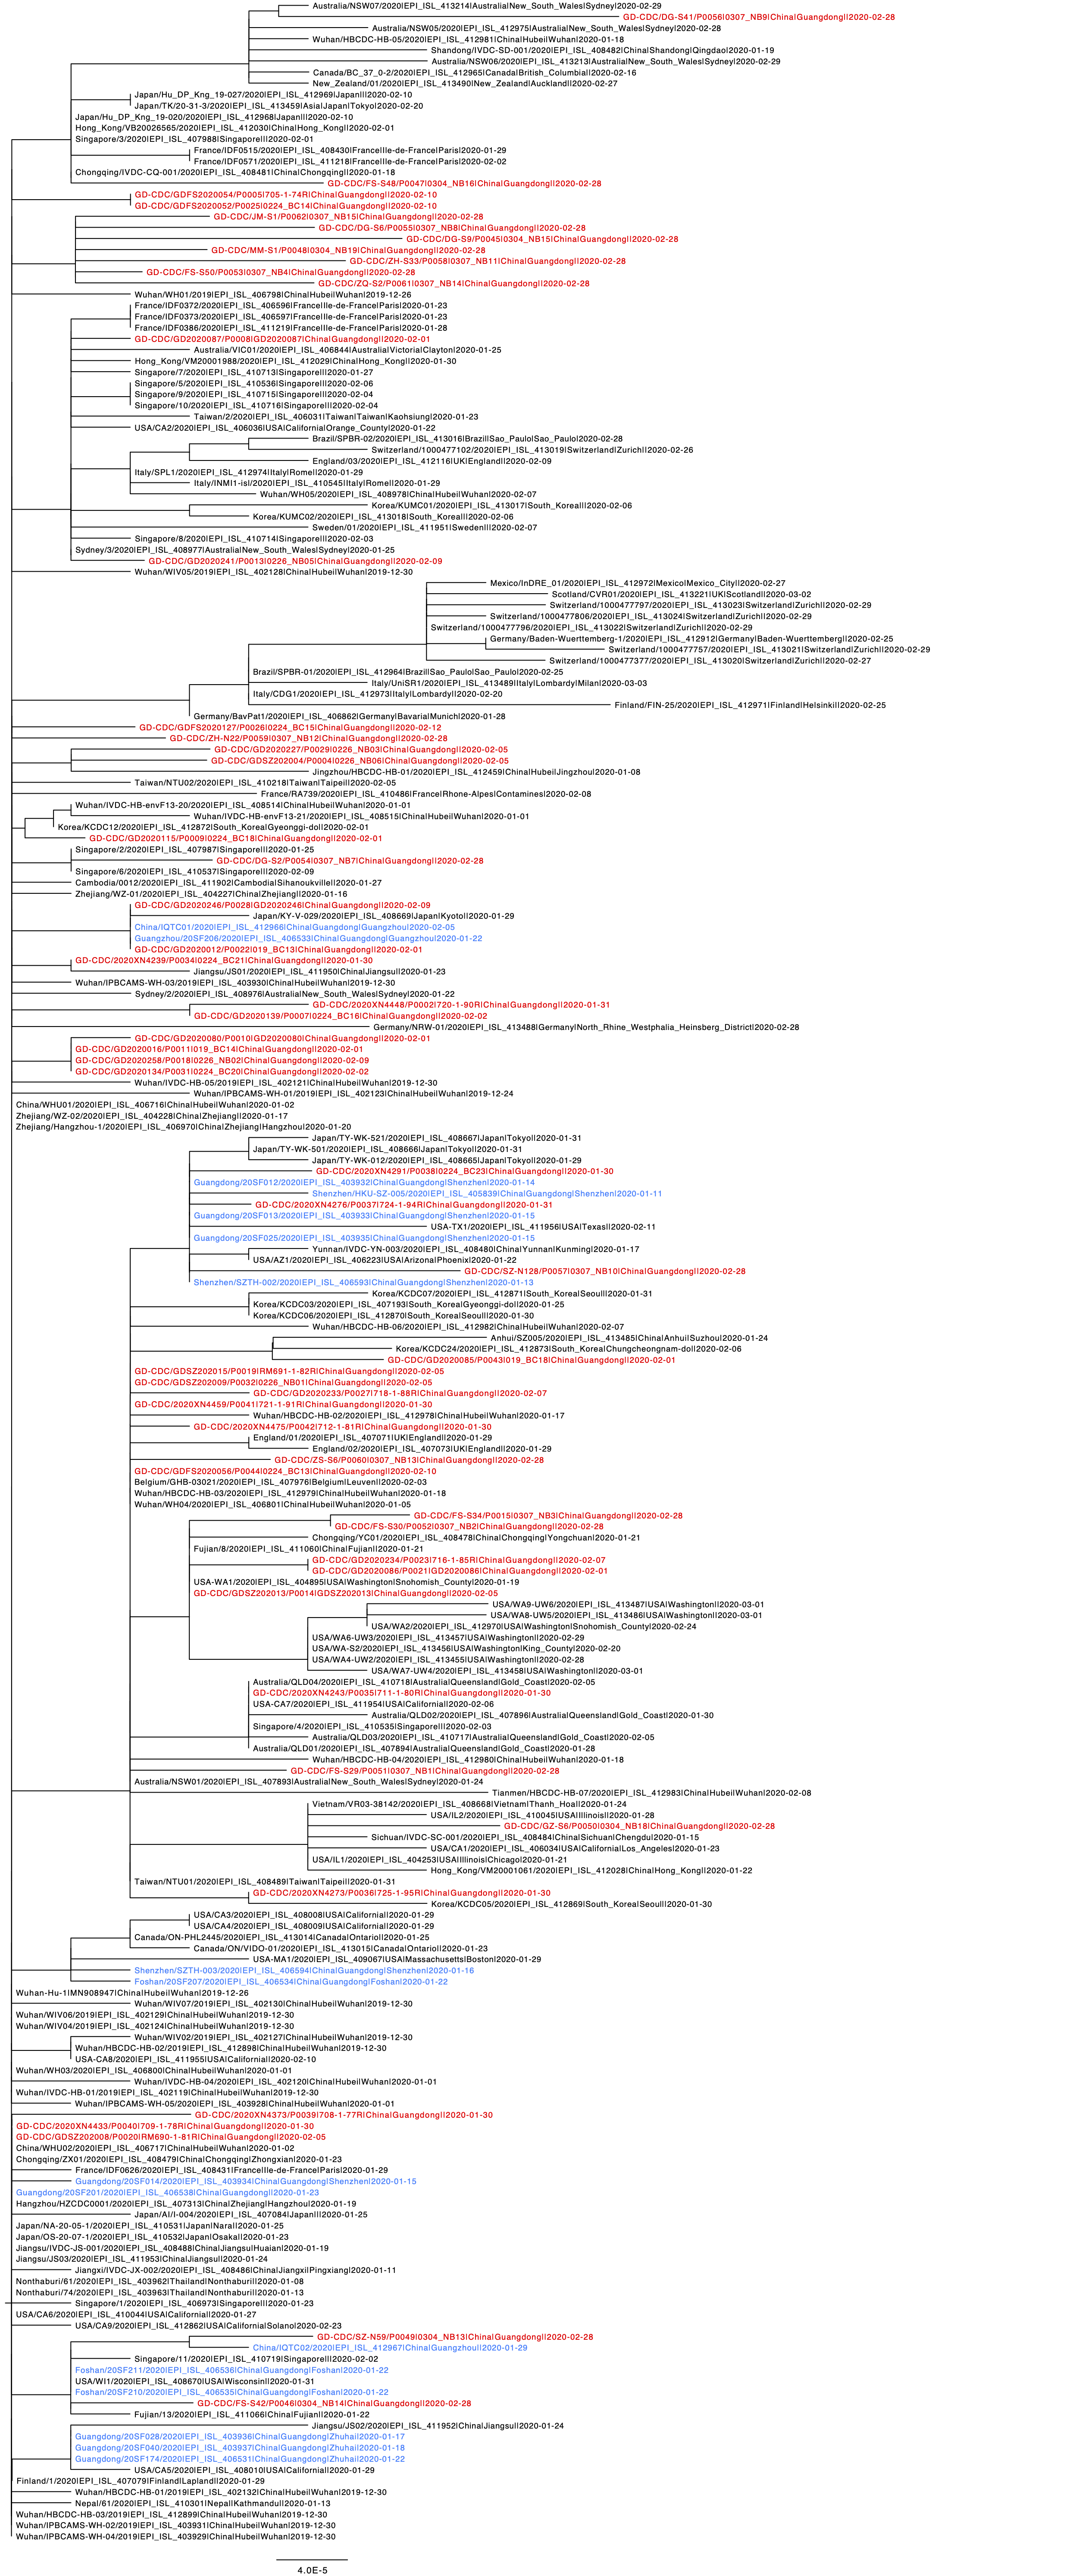
Figure 5 | Newly reported sequences from Guangdong are shown in red. Previously reported sequences from Guangdong are shown in blue. The scale bar shows expected substitutions per site.
2020-03-09_covid19_combinedcov50uniquepatients_GISAID.phy_phyml.tree.pdf (14.1 KB)
The estimated phylogeny (Figure 5) shows that the sequences from Guangdong are interspersed across the COVID-19 outbreak phylogeny. The Guangdong sequences substantially extend the known genetic diversity of hCoV-19 genomes from China. Some of the Guangdong sequences reported here were sampled from patients who had travelled from Hubei and therefore these likely represent infections acquired in Hubei. The diversity of the Guangdong sequences reflects the large number of COVID-19 cases in the province and its connectedness to the epidemic in Hubei.
Further sampling and sequencing of hCoV-19 from other provinces, including Hubei, will very likely increase this diversity further. One consequence of this trend is that phylogenetic clusters comprising cases from outside China will become interspersed with sequences from China, thereby more clearly delineating individual local chains of transmission in other countries worldwide. If phylogenetic results are considered alone, then under-sampling of virus genomes from regions with high incidence can lead to an underestimation of the number of introductions into recipient locations, and an over-estimation of the size and duration of transmission chains in those recipient locations (e.g. Grubaugh et al. 2017. Nature 546:401-5; Kraemer et al. 2019. Epidemiol. Infect. 147:e34). It is therefore essential that the hCoV-19 phylogeny is interpreted in the context of all available epidemiological information, and that uncertainties arising from under-sampling and other sources of bias are carefully considered.
There is evidence of phylogenetic clustering of some GD sequences. Three samples (2020XN4291, 2020XN4276, SZ-N128) cluster with five previously-reported sequences that were sampled in Shenzhen. Samples GD2020012 and GD2020246 cluster with two previously-reported sequences from Guangzhou. Four sequences (GD2020134, GD2020016, GD2020258, GD2020080) form a cluster of Guangdong sequences that is defined by one shared mutation from the root. Another cluster of seven Guangdong sequences is defined similarly but with a different mutation (JM-S1, DG-S6, DG-S9, MM-S1, ZH-S33, FS-S50, ZQ-S2). Notably, five of our new sequences (GD2020234, GD2020086, FS-S34, FS-S30, GDSZ202013) fall as part of a cluster that also contains sequenced COVID-19 cases from Washington state, USA (up to 6 March 2020). This cluster also contains two sequences from other Chinese provinces so our sequences likely represent better sampling from the source of Washington outbreak.
In this provisional analysis we do not attempt to evaluate the statistical robustness of these groupings. We caution that, at this stage of the epidemic, node support values are likely to be weak due to the small number of mutations between sequenced strains, which may be similar to the number of sequence differences arising from errors introduced during reverse transcription, amplification and sequencing. The common bootstrap approach for evaluating node support is based on an approximation that assumes the alignment contains a large number of phylogenetically informative sites, and in addition is not well suited for alignments that contain many partial genomes. Further, as noted above, evaluating hypotheses that depend on the phylogenetic topology is challenged by low and variable sampling among locations. Hence conclusions drawn from the current COVID-19 phylogeny should be made cautiously.
Please note these results are provisional and may be subject to change. Please let us know if you find anything in this report that requires correction.
Contributing Authors:
Jing Lu, Liu Zhe, Jiufeng Sun, Huifang Lin, Jingju Peng, Qianlin Xiong, Runyu Yuan, Lilian Zeng, Pingping Zhou, Chuming Liang, Tao Liu, Wenjun Ma (Guangdong Provincial Institution of Public Health, Guangzhou, China)
Changwen Ke, Wei Li, Juan Su, Huanying Zheng, Kang Min, Song Tie (Guangdong Provincial Center for Diseases Control and Prevention, Guangzhou, China)
Bo Peng, Shisong Fang (Shenzhen Center for Diseases Control and Prevention, Shenzhen, China)
Wenzhe Su, Kuibiao Li (Guangzhou Center for Diseases Control and Prevention, Guangzhou, China)
Ruilin Sun, Ru bai (Guangdong Provincial Second People’s Hospital, Guangzhou, China)
Xi Tang, Minfeng Liang (Foshan First People’s Hospital, Foshan, China)
In collaboration with:
Louis du Plessis, Sarah François, Nuno Faria, Moritz Kraemer, Oliver Pybus (Oxford, UK)
Andrew Rambaut, Verity Hill (Edinburgh, UK)
Nick Loman, Josh Quick (Birmingham, UK)
Data Availability
The new sequences have been deposited in GISAID with accession IDs EPI_ISL_413850 – EPI_ISL_413902.
UPDATE 10/3/20: because some of our sequences have coverage <90% they cannot be uploaded to GISAID. We will find another way to share them ASAP.
Note on Future Plans and Data Usage
We are in the process of undertaking phylogenetic, molecular clock, phylodynamic, travel history, and transmission chain analyses of these data. We intend to submit the results of this work for publication. A preprint will be posted as soon as the manuscript is completed. Please feel free to download, share, use, and analyse the genomes we have uploaded to GISAID. We ask that you communicate with us directly if you wish to publish results or analyses that use these genomes. If you have any other questions, please contact us directly.
Acknowledgments
We would like to thank all the authors who have kindly deposited and shared genome data on GISAID. A table with genome sequence acknowledgments can be found here: Acknowledgments_176.rtf.gz (19.9 KB)